-
×
 Hit and Run Trading Updated Version with Jeff Cooper
1 × $6.00
Hit and Run Trading Updated Version with Jeff Cooper
1 × $6.00 -
×
 Forex Secrets Exposed
1 × $15.00
Forex Secrets Exposed
1 × $15.00 -
×
 Four Steps to Trading Economic Indicators
1 × $6.00
Four Steps to Trading Economic Indicators
1 × $6.00 -
×
 Linda Raschke Short Term Trading Strategies with David Vomund
1 × $6.00
Linda Raschke Short Term Trading Strategies with David Vomund
1 × $6.00 -
×
 Trident. A Trading Strategy with Charles L.Lindsay
1 × $6.00
Trident. A Trading Strategy with Charles L.Lindsay
1 × $6.00 -
×
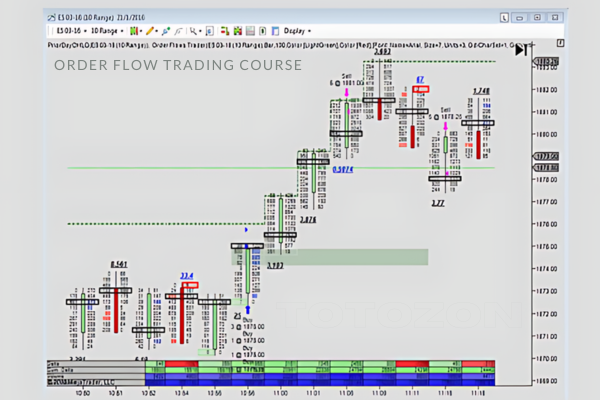 Order Flow Trading Course with Orderflows
1 × $23.00
Order Flow Trading Course with Orderflows
1 × $23.00 -
×
 Options Mastery 32 DVDs
1 × $6.00
Options Mastery 32 DVDs
1 × $6.00 -
×
 Naked Put Selling Acquiring Blue Chip Stocks and Creating Cash Flow with Lee Lowell
1 × $6.00
Naked Put Selling Acquiring Blue Chip Stocks and Creating Cash Flow with Lee Lowell
1 × $6.00 -
×
 Inside the Mind of Trader Stewie - Art of Trading
1 × $23.00
Inside the Mind of Trader Stewie - Art of Trading
1 × $23.00 -
×
 Unlearn and Relearn with Market Fluidity
1 × $6.00
Unlearn and Relearn with Market Fluidity
1 × $6.00 -
×
 0 DTE Options Trading Workshop with Aeromir Corporation
1 × $15.00
0 DTE Options Trading Workshop with Aeromir Corporation
1 × $15.00 -
×
 Matrix Spread Options Trading Course with Base Camp Trading
1 × $31.00
Matrix Spread Options Trading Course with Base Camp Trading
1 × $31.00 -
×
 Deep Dive Butterfly Trading Strategy Class with SJG Trades
1 × $41.00
Deep Dive Butterfly Trading Strategy Class with SJG Trades
1 × $41.00 -
×
 Wave Trading
1 × $23.00
Wave Trading
1 × $23.00 -
×
 Forecast 2024 Clarification with Larry Williams
1 × $15.00
Forecast 2024 Clarification with Larry Williams
1 × $15.00 -
×
 BWT Precision 7.0.2.3 (bluewavetrading.com)
1 × $31.00
BWT Precision 7.0.2.3 (bluewavetrading.com)
1 × $31.00 -
×
 Ichimoku Cloud Trading Course with FollowMeTrades
1 × $15.00
Ichimoku Cloud Trading Course with FollowMeTrades
1 × $15.00 -
×
 Trading Analysis Crash Course
1 × $23.00
Trading Analysis Crash Course
1 × $23.00 -
×
 OTC Oracle Course - PENNY WHALE with Simple Trade
1 × $31.00
OTC Oracle Course - PENNY WHALE with Simple Trade
1 × $31.00 -
×
 Mql4 Bundle: Basics, Scripts, Indicators, Experts with Jim Hodges
1 × $15.00
Mql4 Bundle: Basics, Scripts, Indicators, Experts with Jim Hodges
1 × $15.00 -
×
 The Complete Day Trading Course (New 2020)
1 × $6.00
The Complete Day Trading Course (New 2020)
1 × $6.00 -
×
 MLT Divergence Indicator with Major League Trading
1 × $23.00
MLT Divergence Indicator with Major League Trading
1 × $23.00 -
×
 Wall Street Stories with Edwin Lefevre
1 × $6.00
Wall Street Stories with Edwin Lefevre
1 × $6.00 -
×
 Best of the Best: Collars with Amy Meissner & Scott Ruble
1 × $15.00
Best of the Best: Collars with Amy Meissner & Scott Ruble
1 × $15.00 -
×
 Wave Trader Software 2004 with Bryce Gilmore
1 × $6.00
Wave Trader Software 2004 with Bryce Gilmore
1 × $6.00 -
×
 Stock Patterns for DayTrading I & II with Barry Rudd
1 × $6.00
Stock Patterns for DayTrading I & II with Barry Rudd
1 × $6.00 -
×
 Daytraders Bulletin – Recurrent Structures for Profit with Charles Holt
1 × $6.00
Daytraders Bulletin – Recurrent Structures for Profit with Charles Holt
1 × $6.00 -
×
 E-mini Weekly Options Income with Peter Titus
1 × $15.00
E-mini Weekly Options Income with Peter Titus
1 × $15.00 -
×
 Emini Day Trading Boot Camp - Base Camp Trading
1 × $6.00
Emini Day Trading Boot Camp - Base Camp Trading
1 × $6.00 -
×
 Creating & Using a Trading Plan with Paul Lange
1 × $8.00
Creating & Using a Trading Plan with Paul Lange
1 × $8.00 -
×
 Setups, Entries, and Stops with Rob Hoffman - Become A Better Trader
1 × $6.00
Setups, Entries, and Stops with Rob Hoffman - Become A Better Trader
1 × $6.00 -
×
 Tandem Trader - The Ultimate Day Trading Course with Nathan Michaud - Investors Underground
1 × $54.00
Tandem Trader - The Ultimate Day Trading Course with Nathan Michaud - Investors Underground
1 × $54.00 -
×
 Management Consultancy & Banking in a Era of Globalization
1 × $6.00
Management Consultancy & Banking in a Era of Globalization
1 × $6.00 -
×
 Bear Market Investing Strategies with Harry Schultz
1 × $6.00
Bear Market Investing Strategies with Harry Schultz
1 × $6.00 -
×
 Foundation Options - Time Decay, Implied Volatility, Greeks
1 × $6.00
Foundation Options - Time Decay, Implied Volatility, Greeks
1 × $6.00 -
×
 Trading Earnings Using Measured-Move Targets with AlphaShark
1 × $23.00
Trading Earnings Using Measured-Move Targets with AlphaShark
1 × $23.00 -
×
 Using the Techniques of Andrews & Babson
1 × $6.00
Using the Techniques of Andrews & Babson
1 × $6.00 -
×
 Ultimate Trading Course with Dodgy's Dungeon
1 × $8.00
Ultimate Trading Course with Dodgy's Dungeon
1 × $8.00 -
×
 The Pitbull Investor (2009 Ed.)
1 × $6.00
The Pitbull Investor (2009 Ed.)
1 × $6.00 -
×
 Premium Forex Trading
1 × $31.00
Premium Forex Trading
1 × $31.00 -
×
 Schooloftrade - SOT Beginners Course (May 2014)
1 × $23.00
Schooloftrade - SOT Beginners Course (May 2014)
1 × $23.00 -
×
 Robotic Trading: Skill Sharpening with Claytrader
1 × $23.00
Robotic Trading: Skill Sharpening with Claytrader
1 × $23.00 -
×
 Levines Guide to Spss for Analysis of Variance with Melanie Page, Sanford Braver & David Mackinnon
1 × $6.00
Levines Guide to Spss for Analysis of Variance with Melanie Page, Sanford Braver & David Mackinnon
1 × $6.00 -
×
 Scalp Strategy and Flipping Small Accounts with Opes Trading Group
1 × $5.00
Scalp Strategy and Flipping Small Accounts with Opes Trading Group
1 × $5.00

Day Trading with Lines in the Sky By R.L.Muehlberg
$6.00
File Size: 19.8 MB
Delivery Time: 1–12 hours
Media Type: Online Course
You may check content of “DayTrading with Lines in the Sky By R.L.Muehlberg” below:
Introduction
Day trading is an exhilarating and potentially profitable endeavor that attracts many traders worldwide. “Day Trading with Lines in the Sky” by R.L. Muehlberg offers a unique approach to this trading style, focusing on specific technical analysis techniques that use “lines in the sky” to predict market movements. In this article, we will delve into the core concepts of Muehlberg’s strategy, exploring how these lines can help traders make informed decisions.
Understanding Lines in the Sky
What Are Lines in the Sky?
Definition
- Technical Lines: Lines in the sky refer to specific technical indicators and trend lines drawn on stock charts to predict future price movements.
- Purpose: These lines help traders identify support and resistance levels, trend directions, and potential reversal points.
Importance of Lines in Trading
Trend Identification
- Bullish Trends: Identifying upward trends to capitalize on price increases.
- Bearish Trends: Recognizing downward trends to profit from falling prices.
Support and Resistance
- Support Levels: Price levels where a stock tends to find buying interest.
- Resistance Levels: Price points where selling pressure often occurs.
Key Components of Muehlberg’s Strategy
Technical Indicators
Moving Averages
- Simple Moving Average (SMA): Average price over a specified period, used to smooth out price data.
- Exponential Moving Average (EMA): Gives more weight to recent prices, making it more responsive to new information.
Relative Strength Index (RSI)
- Overbought and Oversold Conditions: Helps identify potential reversal points when the market is overbought or oversold.
Trend Lines
Drawing Trend Lines
- Connecting Highs and Lows: Draw lines connecting consecutive highs or lows to identify the direction of the trend.
- Channel Patterns: Creating channels by drawing parallel lines to the main trend line.
Volume Analysis
Volume Spikes
- Significance: High volume can indicate strong market interest and potential trend continuations or reversals.
- Volume Patterns: Analyzing volume patterns helps confirm price movements.
Implementing the Strategy
Setting Up Your Chart
Selecting Time Frames
- Intraday Charts: Using 1-minute, 5-minute, or 15-minute charts for day trading.
- Daily and Weekly Charts: For broader market context and trend analysis.
Applying Indicators
- Moving Averages: Adding SMA and EMA to identify trend directions.
- RSI: Implementing RSI to gauge market momentum.
Identifying Trade Opportunities
Trend Confirmation
- Trend Line Breaks: Entering trades when price breaks above or below a trend line.
- Moving Average Crossovers: Trading signals generated when shorter-term moving averages cross longer-term moving averages.
Support and Resistance Trades
- Buying at Support: Entering long positions at identified support levels.
- Selling at Resistance: Initiating short positions at resistance points.
Risk Management
Stop-Loss Orders
- Placement: Setting stop-loss orders below support levels for long positions and above resistance levels for short positions.
- Adjustments: Modifying stop-loss levels as the trade progresses to lock in profits.
Position Sizing
- Capital Allocation: Determining the appropriate amount of capital to risk on each trade based on account size and risk tolerance.
- Consistency: Maintaining consistent position sizes to manage risk effectively.
Case Studies
Example 1: Successful Breakout Trade
Scenario
- Setup: Stock breaks above a key resistance level with high volume.
- Execution: Trader enters a long position, setting a stop-loss just below the breakout level.
- Outcome: Stock continues to rise, resulting in a profitable trade.
Example 2: Trend Reversal
Scenario
- Setup: Stock shows bearish divergence on RSI while forming lower highs.
- Execution: Trader initiates a short position as the price breaks below the trend line.
- Outcome: Stock declines significantly, leading to a successful trade.
Advanced Techniques
Fibonacci Retracements
Application
- Drawing Retracements: Using Fibonacci levels to identify potential support and resistance levels during pullbacks.
- Trade Decisions: Entering trades at key Fibonacci levels for optimal entry points.
Candlestick Patterns
Popular Patterns
- Doji: Indicates potential reversal points.
- Engulfing Patterns: Strong reversal signals when a small candle is followed by a larger candle in the opposite direction.
Common Mistakes to Avoid
Overtrading
Definition
- Excessive Trading: Making too many trades can lead to high transaction costs and emotional exhaustion.
Prevention
- Discipline: Sticking to a well-defined trading plan and avoiding impulsive trades.
Ignoring Volume
Importance
- Volume Confirmation: Always consider volume as a confirmation tool for price movements.
Integration
- Volume Indicators: Using volume indicators alongside price charts to validate trades.
Conclusion
Day trading with lines in the sky, as outlined by R.L. Muehlberg, offers a structured approach to navigating the stock market’s complexities. By integrating technical indicators, trend lines, and volume analysis, traders can make informed decisions and manage risks effectively. Continuous learning and practice are key to mastering this strategy and achieving consistent trading success.
Frequently Asked Questions:
- Business Model Innovation:
Embrace our legitimate business model! We organize group buys, allowing participants to share costs for popular courses, making them accessible to those with limited financial resources. Our approach ensures affordability and accessibility, despite author concerns. - The Legal Environment:
The legality of our activity is uncertain. While we lack specific permission from course authors, there’s a technicality: authors didn’t impose resale limits upon course purchase. This presents both an opportunity for us and a benefit for individuals seeking low-cost access. - Quality Control:
Unveiling the Truth
Quality is paramount. Purchasing courses directly from sales pages ensures consistency with traditionally obtained materials. However, we’re not official course providers and don’t offer premium services:
- No scheduled coaching calls or sessions with the author.
- No access to the author’s private Facebook group or web portal.
- No entry to the author’s private membership forum.
- Direct email support from the author or their team is unavailable.Operating independently, we aim to bridge the pricing gap without additional services provided by official channels. Your understanding of our unique approach is valued.
Be the first to review “Day Trading with Lines in the Sky By R.L.Muehlberg”
You must be logged in to post a review.
Related products
Original price was: $999.00.$5.00Current price is: $5.00.

Forex Trading
Original price was: $1,098.00.$39.00Current price is: $39.00.
Original price was: $497.00.$31.00Current price is: $31.00.

Original price was: $1,849.00.$15.00Current price is: $15.00.

Original price was: $139.00.$23.00Current price is: $23.00.

Forex Trading
Original price was: $2,000.00.$23.00Current price is: $23.00.
Original price was: $695.00.$41.00Current price is: $41.00.

Forex Trading
Original price was: $850.00.$23.00Current price is: $23.00.
Forex Trading
Original price was: $239.00.$8.00Current price is: $8.00.

Forex Trading
Original price was: $500.00.$5.00Current price is: $5.00.

Original price was: $649.00.$20.00Current price is: $20.00.

Forex Trading
Original price was: $2,995.00.$31.00Current price is: $31.00.

Original price was: $700.00.$39.00Current price is: $39.00.

Forex Trading
Quantamentals – The Next Great Forefront Of Trading and Investing with Trading Markets
Original price was: $1,495.00.$8.00Current price is: $8.00.

Forex Trading
Original price was: $550.00.$5.00Current price is: $5.00.

Original price was: $997.00.$13.00Current price is: $13.00.

Forex Trading
Original price was: $799.00.$15.00Current price is: $15.00.

Forex Trading
Original price was: $4,997.00.$27.00Current price is: $27.00.

Original price was: $1,800.00.$54.00Current price is: $54.00.
Forex Trading
Original price was: $249.00.$15.00Current price is: $15.00.
Reviews
There are no reviews yet.