-
×
 Trading The Nasdaq Seminar with Alan Rich
1 × $6.00
Trading The Nasdaq Seminar with Alan Rich
1 × $6.00 -
×
 Inside the Mind of Trader Stewie - Art of Trading
1 × $23.00
Inside the Mind of Trader Stewie - Art of Trading
1 × $23.00 -
×
 Trading Connors VIX Reversals & Tradestation Files with Larry Connors
1 × $6.00
Trading Connors VIX Reversals & Tradestation Files with Larry Connors
1 × $6.00 -
×
 Steve Nison Member Files
1 × $6.00
Steve Nison Member Files
1 × $6.00 -
×
 Module IV - Day Trading to Short Term Swing Trades with FX MindShift
1 × $6.00
Module IV - Day Trading to Short Term Swing Trades with FX MindShift
1 × $6.00 -
×
 Workshop Earnings Powerplay with Base Camp Trading
1 × $17.00
Workshop Earnings Powerplay with Base Camp Trading
1 × $17.00 -
×
 Essentials in Quantitative Trading QT01 By HangukQuant's
1 × $23.00
Essentials in Quantitative Trading QT01 By HangukQuant's
1 × $23.00 -
×
 Selected Articles by the Late by George Lindsay
1 × $6.00
Selected Articles by the Late by George Lindsay
1 × $6.00 -
×
 Asset Allocation for the Individual Investor with CFA Institute
1 × $6.00
Asset Allocation for the Individual Investor with CFA Institute
1 × $6.00 -
×
 Toolkit For Thinkorswim with Bigtrends
1 × $54.00
Toolkit For Thinkorswim with Bigtrends
1 × $54.00 -
×
 Cracking The Forex Code with Kevin Adams
1 × $6.00
Cracking The Forex Code with Kevin Adams
1 × $6.00 -
×
 Mastering Metatrader 4 in 90 Minutes & Members Site with Alan Benefield
1 × $15.00
Mastering Metatrader 4 in 90 Minutes & Members Site with Alan Benefield
1 × $15.00 -
×
 Price Headley - Using Williams %R The BigTrends Way
1 × $6.00
Price Headley - Using Williams %R The BigTrends Way
1 × $6.00 -
×
 Weekly Options Boot Camp with Price Headley
1 × $15.00
Weekly Options Boot Camp with Price Headley
1 × $15.00 -
×
 Mutual Funds for Dummies (6th edition) with Eric Tyson
1 × $6.00
Mutual Funds for Dummies (6th edition) with Eric Tyson
1 × $6.00 -
×
 Stock Cycles with Michael Alexander
1 × $6.00
Stock Cycles with Michael Alexander
1 × $6.00 -
×
 Bobokus Training Program
1 × $6.00
Bobokus Training Program
1 × $6.00 -
×
 PPC Lead Pro Training Program
1 × $31.00
PPC Lead Pro Training Program
1 × $31.00 -
×
 Mechanics of Trading Module
1 × $6.00
Mechanics of Trading Module
1 × $6.00 -
×
 Relentless Trading Course Advanced with Ryan Relentless
1 × $5.00
Relentless Trading Course Advanced with Ryan Relentless
1 × $5.00 -
×
 Art of Yen Course (Feb 2014)
1 × $23.00
Art of Yen Course (Feb 2014)
1 × $23.00 -
×
 MarketSharks Forex Training
1 × $31.00
MarketSharks Forex Training
1 × $31.00 -
×
 TradeCraft: Your Path to Peak Performance Trading By Adam Grimes
1 × $15.00
TradeCraft: Your Path to Peak Performance Trading By Adam Grimes
1 × $15.00 -
×
 The Options Course Woorkbook. Exercises and Tests for Options Course Book with George Fontanillis
1 × $6.00
The Options Course Woorkbook. Exercises and Tests for Options Course Book with George Fontanillis
1 × $6.00 -
×
 Flux Investor Package v2.2.1, (Jan 2016) with Back To The Future Trading
1 × $85.00
Flux Investor Package v2.2.1, (Jan 2016) with Back To The Future Trading
1 × $85.00 -
×
 CFA Level 1,2,3 - Study Guides 2006
1 × $6.00
CFA Level 1,2,3 - Study Guides 2006
1 × $6.00 -
×
 Bond Market Course with The Macro Compass
1 × $15.00
Bond Market Course with The Macro Compass
1 × $15.00 -
×
 Market Stalkers Level 2 - Daytrading College (2020)
1 × $8.00
Market Stalkers Level 2 - Daytrading College (2020)
1 × $8.00 -
×
 The Apple Way with Jeffrey Cruikshank
1 × $6.00
The Apple Way with Jeffrey Cruikshank
1 × $6.00 -
×
 Advanced Fibonacci Course with Major League Trading
1 × $23.00
Advanced Fibonacci Course with Major League Trading
1 × $23.00 -
×
 Risk Stop Loss and Position Size with Daryl Guppy
1 × $6.00
Risk Stop Loss and Position Size with Daryl Guppy
1 × $6.00 -
×
 Trading Short TermSame Day Trades Sep 2023 with Dan Sheridan & Mark Fenton - Sheridan Options Mentoring
1 × $31.00
Trading Short TermSame Day Trades Sep 2023 with Dan Sheridan & Mark Fenton - Sheridan Options Mentoring
1 × $31.00 -
×
 WEBINAR series 5 – EXECUTION: A DETAILED PROCESS with FuturesTrader71
1 × $4.00
WEBINAR series 5 – EXECUTION: A DETAILED PROCESS with FuturesTrader71
1 × $4.00 -
×
 FX Childs Play System
1 × $6.00
FX Childs Play System
1 × $6.00 -
×
 Astrology & Stock Market Forecasting with Louise McWhirter
1 × $4.00
Astrology & Stock Market Forecasting with Louise McWhirter
1 × $4.00 -
×
 Futures Trading Secrets Home Study Course 2008 with Bill McCready
1 × $6.00
Futures Trading Secrets Home Study Course 2008 with Bill McCready
1 × $6.00 -
×
 High Probability Trading Using Elliott Wave And Fibonacci Analysis withVic Patel - Forex Training Group
1 × $10.00
High Probability Trading Using Elliott Wave And Fibonacci Analysis withVic Patel - Forex Training Group
1 × $10.00

Day Trading with Lines in the Sky By R.L.Muehlberg
$6.00
File Size: 19.8 MB
Delivery Time: 1–12 hours
Media Type: Online Course
You may check content of “DayTrading with Lines in the Sky By R.L.Muehlberg” below:
Introduction
Day trading is an exhilarating and potentially profitable endeavor that attracts many traders worldwide. “Day Trading with Lines in the Sky” by R.L. Muehlberg offers a unique approach to this trading style, focusing on specific technical analysis techniques that use “lines in the sky” to predict market movements. In this article, we will delve into the core concepts of Muehlberg’s strategy, exploring how these lines can help traders make informed decisions.
Understanding Lines in the Sky
What Are Lines in the Sky?
Definition
- Technical Lines: Lines in the sky refer to specific technical indicators and trend lines drawn on stock charts to predict future price movements.
- Purpose: These lines help traders identify support and resistance levels, trend directions, and potential reversal points.
Importance of Lines in Trading
Trend Identification
- Bullish Trends: Identifying upward trends to capitalize on price increases.
- Bearish Trends: Recognizing downward trends to profit from falling prices.
Support and Resistance
- Support Levels: Price levels where a stock tends to find buying interest.
- Resistance Levels: Price points where selling pressure often occurs.
Key Components of Muehlberg’s Strategy
Technical Indicators
Moving Averages
- Simple Moving Average (SMA): Average price over a specified period, used to smooth out price data.
- Exponential Moving Average (EMA): Gives more weight to recent prices, making it more responsive to new information.
Relative Strength Index (RSI)
- Overbought and Oversold Conditions: Helps identify potential reversal points when the market is overbought or oversold.
Trend Lines
Drawing Trend Lines
- Connecting Highs and Lows: Draw lines connecting consecutive highs or lows to identify the direction of the trend.
- Channel Patterns: Creating channels by drawing parallel lines to the main trend line.
Volume Analysis
Volume Spikes
- Significance: High volume can indicate strong market interest and potential trend continuations or reversals.
- Volume Patterns: Analyzing volume patterns helps confirm price movements.
Implementing the Strategy
Setting Up Your Chart
Selecting Time Frames
- Intraday Charts: Using 1-minute, 5-minute, or 15-minute charts for day trading.
- Daily and Weekly Charts: For broader market context and trend analysis.
Applying Indicators
- Moving Averages: Adding SMA and EMA to identify trend directions.
- RSI: Implementing RSI to gauge market momentum.
Identifying Trade Opportunities
Trend Confirmation
- Trend Line Breaks: Entering trades when price breaks above or below a trend line.
- Moving Average Crossovers: Trading signals generated when shorter-term moving averages cross longer-term moving averages.
Support and Resistance Trades
- Buying at Support: Entering long positions at identified support levels.
- Selling at Resistance: Initiating short positions at resistance points.
Risk Management
Stop-Loss Orders
- Placement: Setting stop-loss orders below support levels for long positions and above resistance levels for short positions.
- Adjustments: Modifying stop-loss levels as the trade progresses to lock in profits.
Position Sizing
- Capital Allocation: Determining the appropriate amount of capital to risk on each trade based on account size and risk tolerance.
- Consistency: Maintaining consistent position sizes to manage risk effectively.
Case Studies
Example 1: Successful Breakout Trade
Scenario
- Setup: Stock breaks above a key resistance level with high volume.
- Execution: Trader enters a long position, setting a stop-loss just below the breakout level.
- Outcome: Stock continues to rise, resulting in a profitable trade.
Example 2: Trend Reversal
Scenario
- Setup: Stock shows bearish divergence on RSI while forming lower highs.
- Execution: Trader initiates a short position as the price breaks below the trend line.
- Outcome: Stock declines significantly, leading to a successful trade.
Advanced Techniques
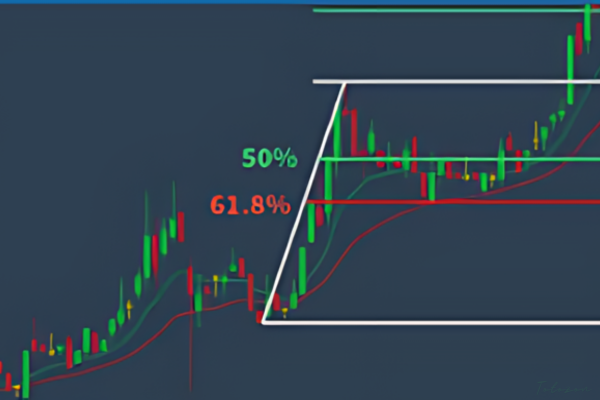
Fibonacci Retracements
Application
- Drawing Retracements: Using Fibonacci levels to identify potential support and resistance levels during pullbacks.
- Trade Decisions: Entering trades at key Fibonacci levels for optimal entry points.
Candlestick Patterns
Popular Patterns
- Doji: Indicates potential reversal points.
- Engulfing Patterns: Strong reversal signals when a small candle is followed by a larger candle in the opposite direction.
Common Mistakes to Avoid
Overtrading
Definition
- Excessive Trading: Making too many trades can lead to high transaction costs and emotional exhaustion.
Prevention
- Discipline: Sticking to a well-defined trading plan and avoiding impulsive trades.
Ignoring Volume
Importance
- Volume Confirmation: Always consider volume as a confirmation tool for price movements.
Integration
- Volume Indicators: Using volume indicators alongside price charts to validate trades.
Conclusion
Day trading with lines in the sky, as outlined by R.L. Muehlberg, offers a structured approach to navigating the stock market’s complexities. By integrating technical indicators, trend lines, and volume analysis, traders can make informed decisions and manage risks effectively. Continuous learning and practice are key to mastering this strategy and achieving consistent trading success.
Frequently Asked Questions:
- Business Model Innovation:
Embrace our legitimate business model! We organize group buys, allowing participants to share costs for popular courses, making them accessible to those with limited financial resources. Our approach ensures affordability and accessibility, despite author concerns. - The Legal Environment:
The legality of our activity is uncertain. While we lack specific permission from course authors, there’s a technicality: authors didn’t impose resale limits upon course purchase. This presents both an opportunity for us and a benefit for individuals seeking low-cost access. - Quality Control:
Unveiling the Truth
Quality is paramount. Purchasing courses directly from sales pages ensures consistency with traditionally obtained materials. However, we’re not official course providers and don’t offer premium services:
- No scheduled coaching calls or sessions with the author.
- No access to the author’s private Facebook group or web portal.
- No entry to the author’s private membership forum.
- Direct email support from the author or their team is unavailable.Operating independently, we aim to bridge the pricing gap without additional services provided by official channels. Your understanding of our unique approach is valued.
Be the first to review “Day Trading with Lines in the Sky By R.L.Muehlberg”
You must be logged in to post a review.
Related products

Original price was: $997.00.$8.00Current price is: $8.00.

Forex Trading
Quantamentals – The Next Great Forefront Of Trading and Investing with Trading Markets
Original price was: $1,495.00.$8.00Current price is: $8.00.
Forex Trading
Original price was: $1,898.00.$10.00Current price is: $10.00.

Forex Trading
Original price was: $550.00.$5.00Current price is: $5.00.

Original price was: $695.00.$41.00Current price is: $41.00.

Original price was: $310.00.$23.00Current price is: $23.00.

Forex Trading
The Complete Guide to Multiple Time Frame Analysis & Reading Price Action with Aiman Almansoori
Original price was: $1,399.00.$13.00Current price is: $13.00.

Original price was: $1,200.00.$23.00Current price is: $23.00.

Forex Trading
Original price was: $500.00.$5.00Current price is: $5.00.

Original price was: $799.00.$15.00Current price is: $15.00.

Forex Trading
Original price was: $1,098.00.$39.00Current price is: $39.00.

Original price was: $497.00.$31.00Current price is: $31.00.
Original price was: $4,995.00.$15.00Current price is: $15.00.

Forex Trading
Original price was: $2,995.00.$31.00Current price is: $31.00.

Forex Trading
Original price was: $2,000.00.$23.00Current price is: $23.00.

Forex Trading
Original price was: $239.00.$8.00Current price is: $8.00.

Original price was: $299.00.$8.00Current price is: $8.00.

Forex Trading
Original price was: $125.00.$17.00Current price is: $17.00.

Forex Trading
Original price was: $4,997.00.$27.00Current price is: $27.00.

Original price was: $1,800.00.$54.00Current price is: $54.00.
Reviews
There are no reviews yet.