-
×
 Learn To Day-Trade the E-Mini S&P 500. Simple-as-123 with Marshall Jones
1 × $6.00
Learn To Day-Trade the E-Mini S&P 500. Simple-as-123 with Marshall Jones
1 × $6.00 -
×
 The Complete 12 Week Transformation Course
1 × $31.00
The Complete 12 Week Transformation Course
1 × $31.00 -
×
 The LP Trading Course
1 × $13.00
The LP Trading Course
1 × $13.00 -
×
 Technical Analysis for Long-Term Investors with Clay Allen
1 × $6.00
Technical Analysis for Long-Term Investors with Clay Allen
1 × $6.00 -
×
 How To Read The Market Professionally with TradeSmart
1 × $27.00
How To Read The Market Professionally with TradeSmart
1 × $27.00 -
×
 Short Swing Trading v6.0 with David Smith
1 × $6.00
Short Swing Trading v6.0 with David Smith
1 × $6.00 -
×
 Profitable Patterns for Stock Trading with Larry Pesavento
1 × $6.00
Profitable Patterns for Stock Trading with Larry Pesavento
1 × $6.00 -
×
 The MMXM Trader – Personal Approach
1 × $5.00
The MMXM Trader – Personal Approach
1 × $5.00 -
×
 Futures & Options Course with Talkin Options
1 × $15.00
Futures & Options Course with Talkin Options
1 × $15.00 -
×
 Trading Natural Resources in a Volatile Market with Kevin Kerr
1 × $6.00
Trading Natural Resources in a Volatile Market with Kevin Kerr
1 × $6.00 -
×
 Compass Trading System with Right Line Trading
1 × $39.00
Compass Trading System with Right Line Trading
1 × $39.00 -
×
 Natural Language Processing in Trading with Dr. Terry Benzschawel
1 × $31.00
Natural Language Processing in Trading with Dr. Terry Benzschawel
1 × $31.00 -
×
 Professional Chart Reading Bootcamp - 2 CDs
1 × $6.00
Professional Chart Reading Bootcamp - 2 CDs
1 × $6.00 -
×
 T3 Live - The Simple Art of Trading
1 × $31.00
T3 Live - The Simple Art of Trading
1 × $31.00 -
×
 The Prop Trading Code with Brannigan Barrett - Axia Futures
1 × $23.00
The Prop Trading Code with Brannigan Barrett - Axia Futures
1 × $23.00 -
×
 WondaFX Signature Strategy with WondaFX
1 × $5.00
WondaFX Signature Strategy with WondaFX
1 × $5.00 -
×
 Adx Mastery Complete Course
1 × $6.00
Adx Mastery Complete Course
1 × $6.00 -
×
 White Phoenix’s The Smart (Money) Approach to Trading with Jayson Casper
1 × $39.00
White Phoenix’s The Smart (Money) Approach to Trading with Jayson Casper
1 × $39.00 -
×
 W. D Gann 's Square Of 9 Applied To Modern Markets with Sean Avidar - Hexatrade350
1 × $23.00
W. D Gann 's Square Of 9 Applied To Modern Markets with Sean Avidar - Hexatrade350
1 × $23.00 -
×
 Option Strategies with Courtney Smith
1 × $6.00
Option Strategies with Courtney Smith
1 × $6.00 -
×
 Equity Research and Valuation Techniques with Kemp Dolliver
1 × $6.00
Equity Research and Valuation Techniques with Kemp Dolliver
1 × $6.00 -
×
 The Complete Turtle Trader with Michael Covel
1 × $6.00
The Complete Turtle Trader with Michael Covel
1 × $6.00 -
×
 The Great Depression with David Burg
1 × $6.00
The Great Depression with David Burg
1 × $6.00 -
×
 Supply and Demand 2023 with Willy Jay
1 × $5.00
Supply and Demand 2023 with Willy Jay
1 × $5.00 -
×
 Tradingmarkets - Introduction to AmiBroker Programming
1 × $15.00
Tradingmarkets - Introduction to AmiBroker Programming
1 × $15.00 -
×
 The Instagram DM Automation Playbook with Natasha Takahashi
1 × $6.00
The Instagram DM Automation Playbook with Natasha Takahashi
1 × $6.00 -
×
 OTC Oracle Course - PENNY WHALE with Simple Trade
1 × $31.00
OTC Oracle Course - PENNY WHALE with Simple Trade
1 × $31.00 -
×
 Dynamic Trading Indicators with Mark W.Helweg, David C.Stendahl
1 × $6.00
Dynamic Trading Indicators with Mark W.Helweg, David C.Stendahl
1 × $6.00 -
×
 Forecast 2024 Clarification with Larry Williams
1 × $15.00
Forecast 2024 Clarification with Larry Williams
1 × $15.00 -
×
 Professional Trader Course
1 × $5.00
Professional Trader Course
1 × $5.00 -
×
 Advanced Spread Trading with Guy Bower - MasterClass Trader
1 × $15.00
Advanced Spread Trading with Guy Bower - MasterClass Trader
1 × $15.00 -
×
 Simpler Options - Ultimate Guide to Debit Spreads – Nov 2014
1 × $6.00
Simpler Options - Ultimate Guide to Debit Spreads – Nov 2014
1 × $6.00 -
×
 The Orderflows Trade Opportunities Encyclopedia with Michael Valtos
1 × $8.00
The Orderflows Trade Opportunities Encyclopedia with Michael Valtos
1 × $8.00 -
×
 Elliott Wave Simplified with Clif Droke
1 × $6.00
Elliott Wave Simplified with Clif Droke
1 × $6.00 -
×
 Order flow self-study training program with iMFtracker
1 × $10.00
Order flow self-study training program with iMFtracker
1 × $10.00 -
×
 Simpler Options - Weekly Butterflies for Income
1 × $6.00
Simpler Options - Weekly Butterflies for Income
1 × $6.00 -
×
 Study Guide for Technical Analysis Explained (1st Edition) with Martin Pring
1 × $6.00
Study Guide for Technical Analysis Explained (1st Edition) with Martin Pring
1 × $6.00 -
×
 The Loyalty Effect with Frederick Reichheld
1 × $6.00
The Loyalty Effect with Frederick Reichheld
1 × $6.00 -
×
 Simpler Traders - Ultimate Guide to Debit Spreads (PREMIUM)
1 × $39.00
Simpler Traders - Ultimate Guide to Debit Spreads (PREMIUM)
1 × $39.00 -
×
 Activedaytrader - Mastering Technicals
1 × $15.00
Activedaytrader - Mastering Technicals
1 × $15.00 -
×
 Right Line Trading IndicatorSuite (May 2015)
1 × $31.00
Right Line Trading IndicatorSuite (May 2015)
1 × $31.00 -
×
 Confidence to Hypnotize
1 × $6.00
Confidence to Hypnotize
1 × $6.00 -
×
 Street-Smart Chart Reading – Volume 2 – Digging Deeper with Donald G.Worden
1 × $6.00
Street-Smart Chart Reading – Volume 2 – Digging Deeper with Donald G.Worden
1 × $6.00 -
×
 The 10%ers with Trader Mike
1 × $5.00
The 10%ers with Trader Mike
1 × $5.00 -
×
 RSI Unleashed: Building a Comprehensive Trading Framework By Doc Severson
1 × $6.00
RSI Unleashed: Building a Comprehensive Trading Framework By Doc Severson
1 × $6.00 -
×
 Power Index Method for Profitable Futures Trading with Harold Goldberg
1 × $6.00
Power Index Method for Profitable Futures Trading with Harold Goldberg
1 × $6.00 -
×
 Gillen Predicts with Jack Gillen
1 × $6.00
Gillen Predicts with Jack Gillen
1 × $6.00 -
×
 Neural Networks in the Capital Markets with Apostolos Paul Refenes
1 × $6.00
Neural Networks in the Capital Markets with Apostolos Paul Refenes
1 × $6.00 -
×
 Advanced Group Analysis Turorial with David Vomund
1 × $6.00
Advanced Group Analysis Turorial with David Vomund
1 × $6.00 -
×
 Algo Trading Masterclass with Ali Casey - StatOasis
1 × $23.00
Algo Trading Masterclass with Ali Casey - StatOasis
1 × $23.00 -
×
 Essential Skills for Consistency in Trading Class with Don Kaufman
1 × $6.00
Essential Skills for Consistency in Trading Class with Don Kaufman
1 × $6.00 -
×
 Options Trading & Ultimate MasterClass With Tyrone Abela - FX Evolution
1 × $54.00
Options Trading & Ultimate MasterClass With Tyrone Abela - FX Evolution
1 × $54.00

The Art and Application of Technical Analysis with Cynthia Kase
$6.00
File Size: 7.13 GB
Delivery Time: 1–12 hours
Media Type: Online Course
Content Proof: Watch Here!
You may check content proof of “The Art and Application of Technical Analysis with Cynthia Kase” below:

The Art and Application of Technical Analysis with Cynthia Kase
Technical analysis is a powerful tool used by traders to predict future price movements based on historical data. One of the foremost experts in this field is Cynthia Kase, whose methodologies have revolutionized the way we approach technical analysis. Let’s delve into the art and application of technical analysis through the lens of Cynthia Kase.
Introduction to Technical Analysis
Technical analysis involves analyzing past market data, primarily price and volume, to forecast future price movements. Unlike fundamental analysis, which evaluates a company’s financial health, technical analysis focuses on price trends and patterns.
The Role of Cynthia Kase in Technical Analysis
Cynthia Kase is a prominent figure in the world of technical analysis. Her innovative methods and tools, such as the Kase StatWare and the Kase PeakOscillator, have provided traders with robust ways to interpret market data.
Understanding Kase’s Approach
Kase StatWare
Kase StatWare is a set of indicators designed to improve the accuracy of market predictions. These indicators include the KaseCD, KasePO, and Kase DevStops.
KaseCD (Convergence-Divergence)
The KaseCD measures momentum and helps traders identify potential reversal points in the market.
KasePO (Peak Oscillator)
The KasePO is used to detect overbought and oversold conditions, providing signals for potential market entries and exits.
Kase DevStops
Kase DevStops are dynamic stop-loss levels that adjust according to market volatility, helping traders manage risk more effectively.
The Kase Wave
The Kase Wave is another crucial aspect of Kase’s technical analysis. It is a unique wave structure that helps traders understand market cycles and potential turning points.
Application of Kase’s Methods
Trend Analysis
Kase’s methods are instrumental in identifying and analyzing trends. By using tools like the Kase StatWare, traders can determine the strength and direction of a trend.
Risk Management
Effective risk management is vital in trading. Kase’s DevStops provide dynamic stop-loss levels, ensuring that traders can protect their investments from unexpected market movements.
Market Entries and Exits
Kase’s PeakOscillator and Convergence-Divergence indicators are essential for timing market entries and exits. These tools help traders make informed decisions based on market conditions.
Practical Application in Trading
Step-by-Step Guide
- Identify the Trend: Use Kase’s StatWare to determine the current market trend.
- Analyze Momentum: Employ the KaseCD to assess market momentum.
- Set Stop-Loss Levels: Utilize Kase DevStops for dynamic risk management.
- Determine Entry and Exit Points: Apply the KasePO to find optimal market entry and exit points.
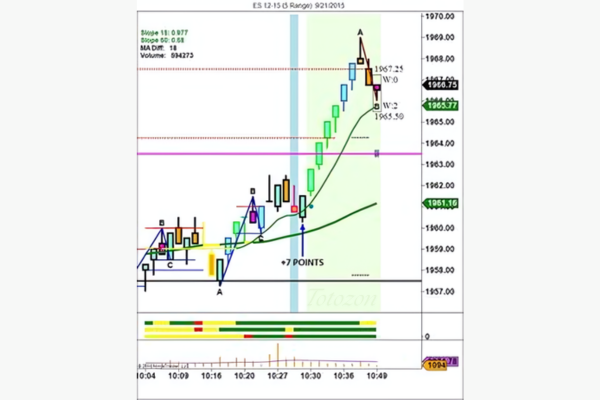
Case Study: Using Kase’s Tools
Let’s consider a case study to illustrate the practical application of Kase’s tools. Imagine a trader using the Kase StatWare indicators to analyze the S&P 500 index. By identifying a bullish trend with strong momentum, the trader decides to enter a long position, setting stop-loss levels using Kase DevStops. The Kase PeakOscillator signals an overbought condition, prompting the trader to exit the position with a profit.
Advantages of Kase’s Methods
Enhanced Accuracy
Kase’s indicators are known for their precision, providing traders with reliable signals to make informed decisions.
Dynamic Risk Management
The Kase DevStops offer dynamic stop-loss levels, which adjust according to market conditions, enhancing risk management.
Comprehensive Analysis
Kase’s approach combines multiple indicators, offering a holistic view of the market and improving the overall analysis.
Conclusion
Cynthia Kase’s contributions to technical analysis have provided traders with advanced tools and methods to navigate the complexities of the financial markets. By understanding and applying Kase’s techniques, traders can enhance their trading strategies and improve their market outcomes.
FAQs
What is Kase StatWare?
Kase StatWare is a set of technical indicators developed by Cynthia Kase, including the KaseCD, KasePO, and Kase DevStops.
How does the Kase PeakOscillator work?
The Kase PeakOscillator identifies overbought and oversold conditions, helping traders determine optimal entry and exit points.
What are Kase DevStops?
Kase DevStops are dynamic stop-loss levels that adjust according to market volatility, providing effective risk management.
Why is Cynthia Kase significant in technical analysis?
Cynthia Kase is renowned for her innovative technical analysis tools and methodologies, which have improved the accuracy and effectiveness of market predictions.
How can Kase’s methods improve my trading?
Kase’s methods offer precise indicators for trend analysis, momentum assessment, and risk management, enhancing overall trading performance.
Be the first to review “The Art and Application of Technical Analysis with Cynthia Kase”
You must be logged in to post a review.
Related products

Original price was: $310.00.$23.00Current price is: $23.00.

Forex Trading
Original price was: $850.00.$23.00Current price is: $23.00.

Original price was: $997.00.$8.00Current price is: $8.00.

Forex Trading
Original price was: $797.00.$10.00Current price is: $10.00.

Original price was: $2,120.00.$15.00Current price is: $15.00.

Original price was: $197.00.$5.00Current price is: $5.00.
Forex Trading
Original price was: $550.00.$5.00Current price is: $5.00.

Forex Trading
Original price was: $999.00.$15.00Current price is: $15.00.

Forex Trading
Original price was: $799.00.$15.00Current price is: $15.00.

Forex Trading
Original price was: $499.00.$15.00Current price is: $15.00.
Forex Trading
Original price was: $249.00.$15.00Current price is: $15.00.
Original price was: $1,800.00.$54.00Current price is: $54.00.

Original price was: $799.00.$15.00Current price is: $15.00.

Forex Trading
Original price was: $2,997.00.$23.00Current price is: $23.00.

Original price was: $1,849.00.$15.00Current price is: $15.00.

Original price was: $450.00.$23.00Current price is: $23.00.

Forex Trading
Quantamentals – The Next Great Forefront Of Trading and Investing with Trading Markets
Original price was: $1,495.00.$8.00Current price is: $8.00.

Original price was: $695.00.$41.00Current price is: $41.00.

Original price was: $649.00.$20.00Current price is: $20.00.

Forex Trading
Original price was: $2,995.00.$31.00Current price is: $31.00.

Reviews
There are no reviews yet.