-
×
 Patterns to Profits with Ryan Mallory - Share Planner
1 × $6.00
Patterns to Profits with Ryan Mallory - Share Planner
1 × $6.00 -
×
 Learn To Fish Part III - How To Swing Trade for Consistent Gains with Daniel
1 × $15.00
Learn To Fish Part III - How To Swing Trade for Consistent Gains with Daniel
1 × $15.00 -
×
 NQ Price Action Mastery with Trade Smart
1 × $15.00
NQ Price Action Mastery with Trade Smart
1 × $15.00 -
×
 ICT – Inner Circle Trader 2020 Weekly Review
1 × $20.00
ICT – Inner Circle Trader 2020 Weekly Review
1 × $20.00 -
×
 Traders Forge with Ryan Litchfield
1 × $6.00
Traders Forge with Ryan Litchfield
1 × $6.00 -
×
 Confidence Game. How a Hadge Fund Manager Called Wall Street’s Bluff with Christine Richard
1 × $6.00
Confidence Game. How a Hadge Fund Manager Called Wall Street’s Bluff with Christine Richard
1 × $6.00 -
×
 The Active Investor Blueprint with Steve Nison - Candle Charts
1 × $23.00
The Active Investor Blueprint with Steve Nison - Candle Charts
1 × $23.00 -
×
 Asset Allocation for the Individual Investor with CFA Institute
1 × $6.00
Asset Allocation for the Individual Investor with CFA Institute
1 × $6.00 -
×
 When Buy Means Sell : An Investor's Guide to Investing When It Counts with Eric Shkolnik
1 × $6.00
When Buy Means Sell : An Investor's Guide to Investing When It Counts with Eric Shkolnik
1 × $6.00 -
×
 Best of AM Review (Volume 1-3) with Peter Bain
1 × $6.00
Best of AM Review (Volume 1-3) with Peter Bain
1 × $6.00 -
×
 Accelerated Learning Techniques in Action with Colin Rose, Jayne Nicholl & Malcolm Nicholl
1 × $6.00
Accelerated Learning Techniques in Action with Colin Rose, Jayne Nicholl & Malcolm Nicholl
1 × $6.00 -
×
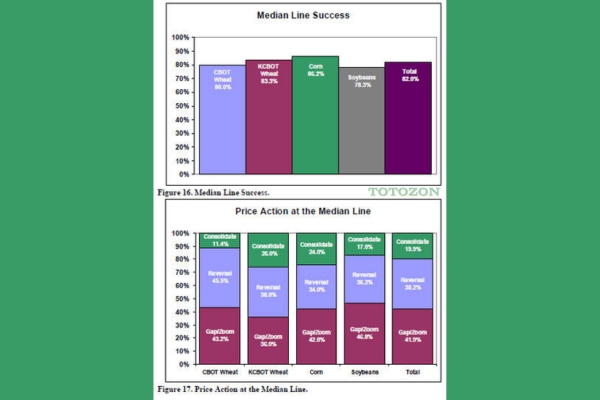 Using Median Lines as a Trading Tool with Greg Fisher
1 × $6.00
Using Median Lines as a Trading Tool with Greg Fisher
1 × $6.00 -
×
 Trading For A Living Course with Yvan Byeajee - Trading Composure
1 × $6.00
Trading For A Living Course with Yvan Byeajee - Trading Composure
1 × $6.00 -
×
 Asset Prices, Booms & Recessions (2nd Ed.) with Willi Semmler
1 × $6.00
Asset Prices, Booms & Recessions (2nd Ed.) with Willi Semmler
1 × $6.00 -
×
 Increasing Vertical Spread Probabilities with Technical Analysis with Doc Severson
1 × $6.00
Increasing Vertical Spread Probabilities with Technical Analysis with Doc Severson
1 × $6.00 -
×
 Trading Academy 2024 with Tradeciety
1 × $5.00
Trading Academy 2024 with Tradeciety
1 × $5.00 -
×
 Sami Abusaad Elite Mentorship
1 × $31.00
Sami Abusaad Elite Mentorship
1 × $31.00 -
×
 Technical Analysis By JC Parets - Investopedia Academy
1 × $15.00
Technical Analysis By JC Parets - Investopedia Academy
1 × $15.00 -
×
 Bond Market Course with The Macro Compass
1 × $15.00
Bond Market Course with The Macro Compass
1 × $15.00 -
×
 T3 Live - The Simple Art of Trading
1 × $31.00
T3 Live - The Simple Art of Trading
1 × $31.00 -
×
 Advanced Bond Trading Course
1 × $62.00
Advanced Bond Trading Course
1 × $62.00 -
×
 Trading for a Living with Alexander Elder
1 × $6.00
Trading for a Living with Alexander Elder
1 × $6.00 -
×
 Technical Trader Workshop with Jason Stapleton
1 × $5.00
Technical Trader Workshop with Jason Stapleton
1 × $5.00 -
×
 Dynamic Time Cycles with Peter Eliades
1 × $6.00
Dynamic Time Cycles with Peter Eliades
1 × $6.00 -
×
 How Do You Read Charts? A Guide to Classic Price Pattern Recognition Class with Professor Jeff Bierman
1 × $6.00
How Do You Read Charts? A Guide to Classic Price Pattern Recognition Class with Professor Jeff Bierman
1 × $6.00 -
×
 AG Trading Journal with Ace Gazette
1 × $6.00
AG Trading Journal with Ace Gazette
1 × $6.00 -
×
 The Kiloby Inquiries Online with Scott Kiloby
1 × $39.00
The Kiloby Inquiries Online with Scott Kiloby
1 × $39.00 -
×
 Safety in the Market. Smarter Starter Pack 1st Edition
1 × $6.00
Safety in the Market. Smarter Starter Pack 1st Edition
1 × $6.00 -
×
 PFA SD Model Trading System (Apr 2013)
1 × $31.00
PFA SD Model Trading System (Apr 2013)
1 × $31.00 -
×
 Advanced Spread Trading with Guy Bower - MasterClass Trader
1 × $15.00
Advanced Spread Trading with Guy Bower - MasterClass Trader
1 × $15.00 -
×
 ICT Mentorship – 2019
1 × $13.00
ICT Mentorship – 2019
1 × $13.00 -
×
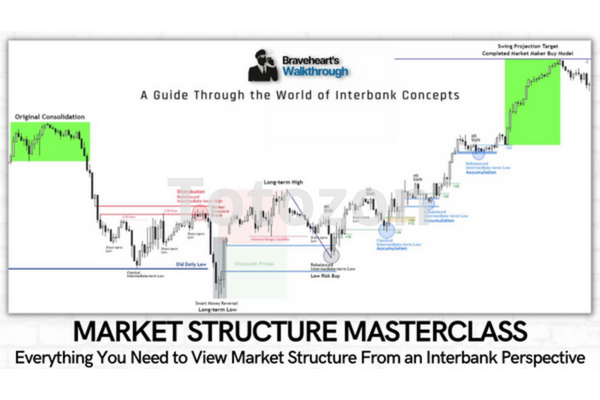 Market Structure Masterclass with Braveheart Trading
1 × $5.00
Market Structure Masterclass with Braveheart Trading
1 × $5.00 -
×
 Fibonacci for the Active Trader with Derrik Hobbs
1 × $6.00
Fibonacci for the Active Trader with Derrik Hobbs
1 × $6.00 -
×
 Sequence Trading Course with Kevin Haggerty
1 × $4.00
Sequence Trading Course with Kevin Haggerty
1 × $4.00 -
×
 The Aggressive Investor. Case Studies with Colin Nicholson
1 × $6.00
The Aggressive Investor. Case Studies with Colin Nicholson
1 × $6.00 -
×
 Compass Trading System with Right Line Trading
1 × $39.00
Compass Trading System with Right Line Trading
1 × $39.00 -
×
 Quantitative Trading Systems (1st Edition) with Howard Bandy
1 × $6.00
Quantitative Trading Systems (1st Edition) with Howard Bandy
1 × $6.00 -
×
 Market Evolution
1 × $6.00
Market Evolution
1 × $6.00 -
×
 Boomer Quick Profits Day Trading Course
1 × $23.00
Boomer Quick Profits Day Trading Course
1 × $23.00 -
×
 3 Day Master Advanced Workshop Seminar (Video & Manuals 8.48 GB)
1 × $6.00
3 Day Master Advanced Workshop Seminar (Video & Manuals 8.48 GB)
1 × $6.00 -
×
 Pyrapoint with D.E.Hall
1 × $6.00
Pyrapoint with D.E.Hall
1 × $6.00 -
×
 Daytrade (Italian) with Guiuseppe Migliorino
1 × $6.00
Daytrade (Italian) with Guiuseppe Migliorino
1 × $6.00 -
×
 Pattern, Price & Time: Using Gann Theory in Trading Systems (1st Edition) with James Hyerczyk
1 × $6.00
Pattern, Price & Time: Using Gann Theory in Trading Systems (1st Edition) with James Hyerczyk
1 × $6.00 -
×
 Pattern- Price & Time. Using Gann Theory in Trading Systems (2nd Ed.)
1 × $6.00
Pattern- Price & Time. Using Gann Theory in Trading Systems (2nd Ed.)
1 × $6.00 -
×
 Practical Applications of Candlestick Charts with Gary Wagner
1 × $6.00
Practical Applications of Candlestick Charts with Gary Wagner
1 × $6.00 -
×
 TradingMind Course with Jack Bernstein
1 × $6.00
TradingMind Course with Jack Bernstein
1 × $6.00 -
×
 Algo Wizard Essentials Course with Srategy Quant
1 × $13.00
Algo Wizard Essentials Course with Srategy Quant
1 × $13.00 -
×
 Tradingmarkets - Introduction to AmiBroker Programming
1 × $15.00
Tradingmarkets - Introduction to AmiBroker Programming
1 × $15.00 -
×
 MTI - Basics UTP
1 × $6.00
MTI - Basics UTP
1 × $6.00 -
×
 Order Flow Trading Advanced Masterclass with The Forex Scalpers
1 × $24.00
Order Flow Trading Advanced Masterclass with The Forex Scalpers
1 × $24.00 -
×
 Pre-Previews. 23 Articles and Forecasts
1 × $6.00
Pre-Previews. 23 Articles and Forecasts
1 × $6.00 -
×
 Profit.ly - Bitcoin Basics
1 × $6.00
Profit.ly - Bitcoin Basics
1 × $6.00 -
×
 Managing By The Greeks (6 Classes) Sept 2010 [9 Videos(mp4) 11 docs(pdf)] by Dan Sheridan
1 × $6.00
Managing By The Greeks (6 Classes) Sept 2010 [9 Videos(mp4) 11 docs(pdf)] by Dan Sheridan
1 × $6.00 -
×
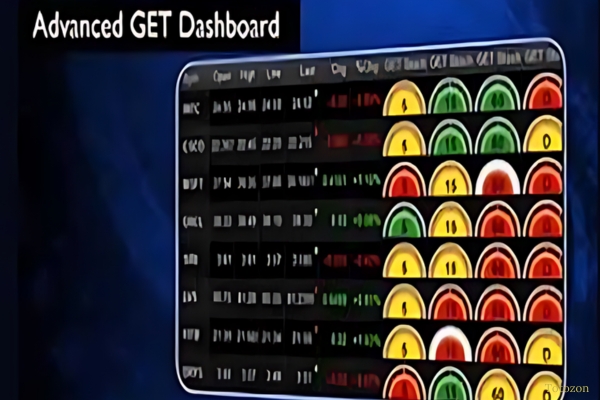 Advanced GET 8.0 EOD
1 × $6.00
Advanced GET 8.0 EOD
1 × $6.00 -
×
 Fibsdontlie - Fibs Don’t Lie Advanced Course
1 × $15.00
Fibsdontlie - Fibs Don’t Lie Advanced Course
1 × $15.00 -
×
 Neural Networks in Trading with Dr. Ernest P. Chan
1 × $31.00
Neural Networks in Trading with Dr. Ernest P. Chan
1 × $31.00 -
×
 Letal Forex System with Alex Seeni
1 × $6.00
Letal Forex System with Alex Seeni
1 × $6.00 -
×
 The Orderflows Trade Opportunities Encyclopedia with Michael Valtos
1 × $8.00
The Orderflows Trade Opportunities Encyclopedia with Michael Valtos
1 × $8.00

The Art and Application of Technical Analysis with Cynthia Kase
$6.00
File Size: 7.13 GB
Delivery Time: 1–12 hours
Media Type: Online Course
Content Proof: Watch Here!
You may check content proof of “The Art and Application of Technical Analysis with Cynthia Kase” below:

The Art and Application of Technical Analysis with Cynthia Kase
Technical analysis is a powerful tool used by traders to predict future price movements based on historical data. One of the foremost experts in this field is Cynthia Kase, whose methodologies have revolutionized the way we approach technical analysis. Let’s delve into the art and application of technical analysis through the lens of Cynthia Kase.
Introduction to Technical Analysis
Technical analysis involves analyzing past market data, primarily price and volume, to forecast future price movements. Unlike fundamental analysis, which evaluates a company’s financial health, technical analysis focuses on price trends and patterns.
The Role of Cynthia Kase in Technical Analysis
Cynthia Kase is a prominent figure in the world of technical analysis. Her innovative methods and tools, such as the Kase StatWare and the Kase PeakOscillator, have provided traders with robust ways to interpret market data.
Understanding Kase’s Approach
Kase StatWare
Kase StatWare is a set of indicators designed to improve the accuracy of market predictions. These indicators include the KaseCD, KasePO, and Kase DevStops.
KaseCD (Convergence-Divergence)
The KaseCD measures momentum and helps traders identify potential reversal points in the market.
KasePO (Peak Oscillator)
The KasePO is used to detect overbought and oversold conditions, providing signals for potential market entries and exits.
Kase DevStops
Kase DevStops are dynamic stop-loss levels that adjust according to market volatility, helping traders manage risk more effectively.
The Kase Wave
The Kase Wave is another crucial aspect of Kase’s technical analysis. It is a unique wave structure that helps traders understand market cycles and potential turning points.
Application of Kase’s Methods
Trend Analysis
Kase’s methods are instrumental in identifying and analyzing trends. By using tools like the Kase StatWare, traders can determine the strength and direction of a trend.
Risk Management
Effective risk management is vital in trading. Kase’s DevStops provide dynamic stop-loss levels, ensuring that traders can protect their investments from unexpected market movements.
Market Entries and Exits
Kase’s PeakOscillator and Convergence-Divergence indicators are essential for timing market entries and exits. These tools help traders make informed decisions based on market conditions.
Practical Application in Trading
Step-by-Step Guide
- Identify the Trend: Use Kase’s StatWare to determine the current market trend.
- Analyze Momentum: Employ the KaseCD to assess market momentum.
- Set Stop-Loss Levels: Utilize Kase DevStops for dynamic risk management.
- Determine Entry and Exit Points: Apply the KasePO to find optimal market entry and exit points.
Case Study: Using Kase’s Tools
Let’s consider a case study to illustrate the practical application of Kase’s tools. Imagine a trader using the Kase StatWare indicators to analyze the S&P 500 index. By identifying a bullish trend with strong momentum, the trader decides to enter a long position, setting stop-loss levels using Kase DevStops. The Kase PeakOscillator signals an overbought condition, prompting the trader to exit the position with a profit.
Advantages of Kase’s Methods
Enhanced Accuracy
Kase’s indicators are known for their precision, providing traders with reliable signals to make informed decisions.
Dynamic Risk Management
The Kase DevStops offer dynamic stop-loss levels, which adjust according to market conditions, enhancing risk management.
Comprehensive Analysis
Kase’s approach combines multiple indicators, offering a holistic view of the market and improving the overall analysis.
Conclusion
Cynthia Kase’s contributions to technical analysis have provided traders with advanced tools and methods to navigate the complexities of the financial markets. By understanding and applying Kase’s techniques, traders can enhance their trading strategies and improve their market outcomes.
FAQs
What is Kase StatWare?
Kase StatWare is a set of technical indicators developed by Cynthia Kase, including the KaseCD, KasePO, and Kase DevStops.
How does the Kase PeakOscillator work?
The Kase PeakOscillator identifies overbought and oversold conditions, helping traders determine optimal entry and exit points.
What are Kase DevStops?
Kase DevStops are dynamic stop-loss levels that adjust according to market volatility, providing effective risk management.
Why is Cynthia Kase significant in technical analysis?
Cynthia Kase is renowned for her innovative technical analysis tools and methodologies, which have improved the accuracy and effectiveness of market predictions.
How can Kase’s methods improve my trading?
Kase’s methods offer precise indicators for trend analysis, momentum assessment, and risk management, enhancing overall trading performance.
Be the first to review “The Art and Application of Technical Analysis with Cynthia Kase”
You must be logged in to post a review.
Related products

Forex Trading
Original price was: $999.00.$15.00Current price is: $15.00.
Forex Trading
Original price was: $1,898.00.$10.00Current price is: $10.00.

Original price was: $139.00.$23.00Current price is: $23.00.

Forex Trading
Original price was: $797.00.$10.00Current price is: $10.00.

Original price was: $4,995.00.$15.00Current price is: $15.00.

Forex Trading
Original price was: $500.00.$5.00Current price is: $5.00.
Forex Trading
Original price was: $1,098.00.$39.00Current price is: $39.00.

Forex Trading
Original price was: $2,997.00.$23.00Current price is: $23.00.

Original price was: $310.00.$23.00Current price is: $23.00.

Forex Trading
Original price was: $125.00.$17.00Current price is: $17.00.

Original price was: $1,800.00.$54.00Current price is: $54.00.

Original price was: $695.00.$41.00Current price is: $41.00.

Forex Trading
Original price was: $2,995.00.$31.00Current price is: $31.00.

Forex Trading
Original price was: $239.00.$8.00Current price is: $8.00.

Original price was: $1,200.00.$23.00Current price is: $23.00.

Forex Trading
Quantamentals – The Next Great Forefront Of Trading and Investing with Trading Markets
Original price was: $1,495.00.$8.00Current price is: $8.00.

Original price was: $999.00.$5.00Current price is: $5.00.

Forex Trading
Original price was: $4,997.00.$27.00Current price is: $27.00.

Original price was: $497.00.$11.00Current price is: $11.00.

Forex Trading
Original price was: $550.00.$5.00Current price is: $5.00.

Reviews
There are no reviews yet.