-
×
 Brand new for 2017 - “Renko 2.0” with Nikos Mermigas & Jeff Wilde
1 × $23.00
Brand new for 2017 - “Renko 2.0” with Nikos Mermigas & Jeff Wilde
1 × $23.00 -
×
 7 Day FX Mastery Course with Market Masters
1 × $6.00
7 Day FX Mastery Course with Market Masters
1 × $6.00 -
×
 0 DTE Options Trading Workshop with Aeromir Corporation
1 × $15.00
0 DTE Options Trading Workshop with Aeromir Corporation
1 × $15.00 -
×
 Foolproof Forex Trading with Louise Woof
1 × $6.00
Foolproof Forex Trading with Louise Woof
1 × $6.00 -
×
 Trading Dave Landry’s Ultimate Bow Ties Strategy with Dave Landry
1 × $6.00
Trading Dave Landry’s Ultimate Bow Ties Strategy with Dave Landry
1 × $6.00 -
×
 Active Trading Course Notes with Alan Hull
1 × $6.00
Active Trading Course Notes with Alan Hull
1 × $6.00 -
×
 Speculating with Futures and Traditional Commodities Part II (Liverpool Group) - Noble DraKoln
1 × $6.00
Speculating with Futures and Traditional Commodities Part II (Liverpool Group) - Noble DraKoln
1 × $6.00 -
×
 Secret Income with James Altucher
1 × $62.00
Secret Income with James Altucher
1 × $62.00 -
×
 The Market Masters: Wall Street's Top Investment Pros Reveal How to Make Money in Both Bull and Bear Markets - Kirk Kazanjian
1 × $6.00
The Market Masters: Wall Street's Top Investment Pros Reveal How to Make Money in Both Bull and Bear Markets - Kirk Kazanjian
1 × $6.00 -
×
 Cyber Trading University - Power Trading 7 CD
1 × $8.00
Cyber Trading University - Power Trading 7 CD
1 × $8.00 -
×
 Scalp Strategy and Flipping Small Accounts with Opes Trading Group
1 × $5.00
Scalp Strategy and Flipping Small Accounts with Opes Trading Group
1 × $5.00 -
×
 Applying Fibonacci Analysis to Price Action
1 × $6.00
Applying Fibonacci Analysis to Price Action
1 × $6.00 -
×
 Video On Demand Pathway with Trade With Profile
1 × $5.00
Video On Demand Pathway with Trade With Profile
1 × $5.00 -
×
 White Phoenix’s The Smart (Money) Approach to Trading with Jayson Casper
1 × $39.00
White Phoenix’s The Smart (Money) Approach to Trading with Jayson Casper
1 × $39.00 -
×
 Advanced Ichimoku Kinkō Hyō - Ichimoku Cloud Strategy with Rafał Zuchowicz - TopMasterTrader
1 × $17.00
Advanced Ichimoku Kinkō Hyō - Ichimoku Cloud Strategy with Rafał Zuchowicz - TopMasterTrader
1 × $17.00 -
×
 CHARTCHAMPIONS Course
1 × $10.00
CHARTCHAMPIONS Course
1 × $10.00 -
×
 Lazy Emini Trader Master Class
1 × $15.00
Lazy Emini Trader Master Class
1 × $15.00 -
×
 Ultimate Trading Course with Dodgy's Dungeon
1 × $8.00
Ultimate Trading Course with Dodgy's Dungeon
1 × $8.00 -
×
 Master Forecasting Method & Unpublished Stock Market Forecasting Courses with W.D.Gann
1 × $6.00
Master Forecasting Method & Unpublished Stock Market Forecasting Courses with W.D.Gann
1 × $6.00 -
×
 All About Stock Market Strategies: The Easy Way To Get Started (All About Series) with David Brown
1 × $6.00
All About Stock Market Strategies: The Easy Way To Get Started (All About Series) with David Brown
1 × $6.00 -
×
 Complete Cryptocurrency Trading 2021
1 × $5.00
Complete Cryptocurrency Trading 2021
1 × $5.00 -
×
 How To Trade Forex Using Support & Resistance Levels with Vic Noble
1 × $6.00
How To Trade Forex Using Support & Resistance Levels with Vic Noble
1 × $6.00 -
×
 FOUS4 with Cameron Fous
1 × $5.00
FOUS4 with Cameron Fous
1 × $5.00 -
×
 Confidence Game. How a Hadge Fund Manager Called Wall Street’s Bluff with Christine Richard
1 × $6.00
Confidence Game. How a Hadge Fund Manager Called Wall Street’s Bluff with Christine Richard
1 × $6.00 -
×
 Market Stalkers Level 2 - Daytrading College (2020)
1 × $8.00
Market Stalkers Level 2 - Daytrading College (2020)
1 × $8.00 -
×
 Area 61 with BCFX
1 × $6.00
Area 61 with BCFX
1 × $6.00 -
×
 The Bare Essentials Of Investing: Teaching The Horse To Talk with Harold Bierman
1 × $6.00
The Bare Essentials Of Investing: Teaching The Horse To Talk with Harold Bierman
1 × $6.00 -
×
 Cycle Hunter Support with Brian James Sklenka
1 × $6.00
Cycle Hunter Support with Brian James Sklenka
1 × $6.00 -
×
 Starter Guide to Investing Stocks, Crypto & Precious Metals with Ryan Hogue
1 × $5.00
Starter Guide to Investing Stocks, Crypto & Precious Metals with Ryan Hogue
1 × $5.00 -
×
 Equity Valuation for Analysts and Investors: A Unique Stock Valuation Tool for Financial Statement Analysis and Model-Building with James Kelleher
1 × $6.00
Equity Valuation for Analysts and Investors: A Unique Stock Valuation Tool for Financial Statement Analysis and Model-Building with James Kelleher
1 × $6.00 -
×
 The Quarters Theory with Ilian Yotov
1 × $6.00
The Quarters Theory with Ilian Yotov
1 × $6.00 -
×
 Trading Analysis Crash Course
1 × $23.00
Trading Analysis Crash Course
1 × $23.00 -
×
 Managing By The Greeks (6 Classes) Sept 2010 [9 Videos(mp4) 11 docs(pdf)] by Dan Sheridan
1 × $6.00
Managing By The Greeks (6 Classes) Sept 2010 [9 Videos(mp4) 11 docs(pdf)] by Dan Sheridan
1 × $6.00 -
×
 Patterns to Profits with Ryan Mallory - Share Planner
1 × $6.00
Patterns to Profits with Ryan Mallory - Share Planner
1 × $6.00 -
×
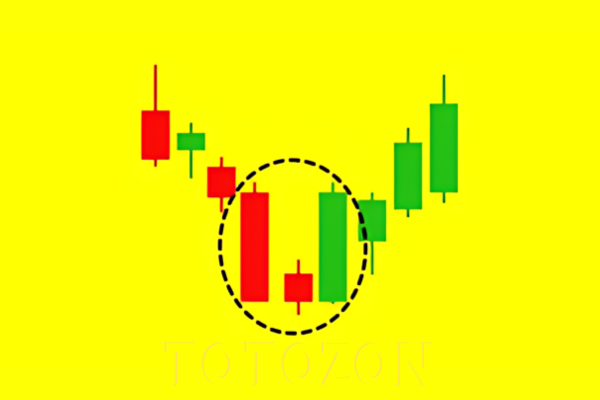 Level 1 - Japanese Candlesticks Trading Mastery Program with Rohit Musale & Rashmi Musale
1 × $5.00
Level 1 - Japanese Candlesticks Trading Mastery Program with Rohit Musale & Rashmi Musale
1 × $5.00 -
×
 9-Pack of TOS Indicators
1 × $6.00
9-Pack of TOS Indicators
1 × $6.00 -
×
 5 Basic Elliott Wave Patterns + Technical Tools = Trading Success with Jeffrey Kennedy
1 × $15.00
5 Basic Elliott Wave Patterns + Technical Tools = Trading Success with Jeffrey Kennedy
1 × $15.00 -
×
 Trading Blox Builder 4.3.2.1
1 × $31.00
Trading Blox Builder 4.3.2.1
1 × $31.00 -
×
 Elliott Wave Mastery Course with Todd Gordon
1 × $54.00
Elliott Wave Mastery Course with Todd Gordon
1 × $54.00 -
×
 Best Trading Set Ups Playbook with Stacey Burke Trading
1 × $5.00
Best Trading Set Ups Playbook with Stacey Burke Trading
1 × $5.00 -
×
 Perfect Publishing System Elite with Johnny Andrews
1 × $6.00
Perfect Publishing System Elite with Johnny Andrews
1 × $6.00 -
×
 The One Trading Secret That Could Make You Rich Inside Days
1 × $6.00
The One Trading Secret That Could Make You Rich Inside Days
1 × $6.00 -
×
 WondaFX Signature Strategy with WondaFX
1 × $5.00
WondaFX Signature Strategy with WondaFX
1 × $5.00 -
×
 The M21 Strategy
1 × $15.00
The M21 Strategy
1 × $15.00 -
×
 Trading Freak Academy (Full Course) with JP - Trading Freak
1 × $5.00
Trading Freak Academy (Full Course) with JP - Trading Freak
1 × $5.00 -
×
 Seasonality. Systems, Strategies & Signals
1 × $6.00
Seasonality. Systems, Strategies & Signals
1 × $6.00 -
×
 Applications of Abstract Algebra with Maple - Richard E.Kline, Neil Sigmon, Ernst Stitzinger
1 × $6.00
Applications of Abstract Algebra with Maple - Richard E.Kline, Neil Sigmon, Ernst Stitzinger
1 × $6.00 -
×
 ICT Prodigy Trading Course – $650K in Payouts with Alex Solignani
1 × $15.00
ICT Prodigy Trading Course – $650K in Payouts with Alex Solignani
1 × $15.00 -
×
 Fibonnacci Trader WorkShop (Video 2.38 GB) with Dennis Bolze, Thom Hartle
1 × $6.00
Fibonnacci Trader WorkShop (Video 2.38 GB) with Dennis Bolze, Thom Hartle
1 × $6.00 -
×
 The Complete Guide to Multiple Time Frame Analysis & Reading Price Action with Aiman Almansoori
1 × $13.00
The Complete Guide to Multiple Time Frame Analysis & Reading Price Action with Aiman Almansoori
1 × $13.00

Charting the Major Forex Pairs: Focus on Major Currencies with James Bickford
$6.00
File Size: Coming soon!
Delivery Time: 1–12 hours
Media Type: Online Course
Content Proof: Watch Here!
You may check content proof of “Charting the Major Forex Pairs: Focus on Major Currencies with James Bickford” below:

Charting the Major Forex Pairs: Focus on Major Currencies with James Bickford
In the fast-paced world of forex trading, understanding the major currency pairs is essential for success. James Bickford, a seasoned forex trader, provides invaluable insights into charting these major pairs. This article will explore the key techniques and strategies for effectively charting the major forex pairs, helping you to navigate the forex market with confidence.
Introduction to Major Forex Pairs
What Are Major Forex Pairs?
Major forex pairs are the most traded currency pairs in the forex market. They include currencies from the world’s largest economies and offer high liquidity and tight spreads.
List of Major Forex Pairs
- EUR/USD (Euro/US Dollar)
- USD/JPY (US Dollar/Japanese Yen)
- GBP/USD (British Pound/US Dollar)
- USD/CHF (US Dollar/Swiss Franc)
- AUD/USD (Australian Dollar/US Dollar)
- USD/CAD (US Dollar/Canadian Dollar)
Why Focus on Major Forex Pairs?
High Liquidity
Major forex pairs are highly liquid, meaning they can be traded quickly and easily without significantly affecting their price.
Tight Spreads
These pairs have tight spreads, which reduce the cost of trading and increase profit margins.
Predictable Market Behavior
Major currency pairs tend to have more predictable market behavior due to the large amount of data and analysis available.
Key Charting Techniques
Candlestick Charts
Candlestick charts are a popular tool for visualizing price movements. They show the opening, closing, high, and low prices for a given period.
Line Charts
Line charts provide a simple way to visualize the overall direction of a currency pair by connecting closing prices over a specific period.
Bar Charts
Bar charts display price information in a vertical bar, showing the high, low, opening, and closing prices.
Technical Indicators for Major Pairs
Moving Averages
Moving averages smooth out price data to identify trends. The simple moving average (SMA) and exponential moving average (EMA) are commonly used.
Relative Strength Index (RSI)
RSI measures the speed and change of price movements, helping to identify overbought or oversold conditions.
MACD Indicator
The Moving Average Convergence Divergence (MACD) indicator shows the relationship between two moving averages, indicating momentum and trend strength.
Chart Patterns to Watch
Head and Shoulders
This pattern signals a potential reversal. It consists of a peak (shoulder), a higher peak (head), and another lower peak (shoulder).
Double Top and Double Bottom
Double tops indicate a potential downtrend reversal, while double bottoms suggest an uptrend reversal.
Triangles
Triangles are continuation patterns that indicate a period of consolidation before the price continues in the direction of the existing trend.
Analyzing Major Currency Pairs
EUR/USD Analysis
The EUR/USD pair is influenced by economic data from both the Eurozone and the United States, including GDP growth, employment rates, and central bank policies.
USD/JPY Analysis
The USD/JPY pair is impacted by interest rate differentials, economic policies, and geopolitical events involving the US and Japan.
GBP/USD Analysis
The GBP/USD pair is sensitive to economic data from the UK and US, as well as political events such as Brexit.
Fundamental Analysis for Major Pairs
Economic Indicators
Key economic indicators include GDP, inflation rates, employment data, and interest rates.
Central Bank Policies
Decisions by central banks, such as the Federal Reserve and the European Central Bank, have a significant impact on currency values.
Geopolitical Events
Events such as elections, trade agreements, and geopolitical tensions can cause significant fluctuations in major currency pairs.
Practical Trading Tips
Stay Informed
Keep up-to-date with the latest economic news and events that could impact major currency pairs.
Use a Trading Plan
Develop a trading plan that includes entry and exit points, risk management strategies, and regular review of your performance.
Practice Patience
Successful trading requires patience and discipline. Avoid making impulsive decisions based on short-term market movements.
Case Studies
Case Study 1: EUR/USD Trading
A trader uses moving averages and RSI to identify a buy signal in the EUR/USD pair. After entering the trade, the trader monitors economic news to manage the position effectively.
Case Study 2: USD/JPY Trading
Another trader spots a head and shoulders pattern in the USD/JPY pair. By using this pattern, the trader successfully predicts a trend reversal and exits a short position with a profit.
Common Mistakes in Charting
Ignoring Market Context
Always consider the broader market context and avoid relying solely on technical indicators.
Overtrading
Avoid overtrading by sticking to your trading plan and not chasing the market.
Neglecting Risk Management
Implementing proper risk management strategies is crucial to long-term trading success.
Advanced Charting Techniques
Multiple Time Frame Analysis
Analyze currency pairs across multiple time frames to get a comprehensive view of market trends and potential trading opportunities.
Volume Analysis
Volume analysis helps confirm the strength of a price movement. High volume during a price increase suggests strong buying interest.
The Psychological Aspect of Trading
Managing Emotions
Trading can be emotional. Learn to manage your emotions and stick to your trading plan.
Building Confidence
Confidence comes with experience. Practice your charting skills and learn from both your successes and mistakes.
Conclusion
Charting the major forex pairs is a crucial skill for any trader. By focusing on major currencies and utilizing the insights from James Bickford, you can develop a robust trading strategy. Remember to combine technical analysis with fundamental insights and maintain discipline in your trading approach.
FAQs
1. What are the most important indicators for charting major forex pairs?
Key indicators include moving averages, RSI, and MACD.
2. How do economic events impact major forex pairs?
Economic events such as GDP releases, employment reports, and central bank decisions can cause significant price movements.
3. Can I use charting techniques for other currency pairs?
Yes, charting techniques can be applied to any currency pair, but major pairs offer more liquidity and predictable behavior.
4. What is the best chart type for beginners?
Candlestick charts are highly recommended for beginners due to their detailed price information and visual clarity.
5. How can I improve my charting skills?
Regular practice, staying informed about market events, and learning from experienced traders can enhance your charting skills.
Be the first to review “Charting the Major Forex Pairs: Focus on Major Currencies with James Bickford”
You must be logged in to post a review.
Related products

Original price was: $450.00.$23.00Current price is: $23.00.

Forex Trading
Original price was: $2,000.00.$23.00Current price is: $23.00.

Original price was: $997.00.$13.00Current price is: $13.00.

Original price was: $197.00.$5.00Current price is: $5.00.

Original price was: $139.00.$23.00Current price is: $23.00.

Forex Trading
Original price was: $797.00.$10.00Current price is: $10.00.

Original price was: $1,849.00.$15.00Current price is: $15.00.

Forex Trading
Original price was: $499.00.$15.00Current price is: $15.00.

Original price was: $497.00.$31.00Current price is: $31.00.

Original price was: $997.00.$8.00Current price is: $8.00.

Forex Trading
Original price was: $249.00.$15.00Current price is: $15.00.
Forex Trading
The Complete Guide to Multiple Time Frame Analysis & Reading Price Action with Aiman Almansoori
Original price was: $1,399.00.$13.00Current price is: $13.00.
Forex Trading
Original price was: $1,898.00.$10.00Current price is: $10.00.

Forex Trading
Original price was: $2,997.00.$23.00Current price is: $23.00.

Original price was: $1,800.00.$54.00Current price is: $54.00.

Original price was: $695.00.$41.00Current price is: $41.00.
Original price was: $2,120.00.$15.00Current price is: $15.00.

Original price was: $649.00.$20.00Current price is: $20.00.

Forex Trading
Quantamentals – The Next Great Forefront Of Trading and Investing with Trading Markets
Original price was: $1,495.00.$8.00Current price is: $8.00.

Original price was: $4,995.00.$15.00Current price is: $15.00.

Reviews
There are no reviews yet.