-
×
 WondaFX Signature Strategy with WondaFX
1 × $5.00
WondaFX Signature Strategy with WondaFX
1 × $5.00 -
×
 Cash Flow Investing Course
1 × $20.00
Cash Flow Investing Course
1 × $20.00 -
×
 AI For Traders with Trading Markets
1 × $31.00
AI For Traders with Trading Markets
1 × $31.00 -
×
 The Indices Orderflow Masterclass with The Forex Scalpers
1 × $23.00
The Indices Orderflow Masterclass with The Forex Scalpers
1 × $23.00 -
×
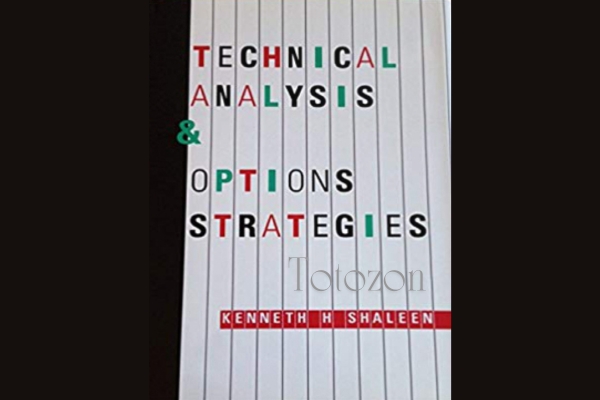 Technical Analysis & Options Strategies with K.H.Shaleen
1 × $6.00
Technical Analysis & Options Strategies with K.H.Shaleen
1 × $6.00 -
×
 W. D Gann 's Square Of 9 Applied To Modern Markets with Sean Avidar - Hexatrade350
1 × $23.00
W. D Gann 's Square Of 9 Applied To Modern Markets with Sean Avidar - Hexatrade350
1 × $23.00 -
×
 3-Day Day Trading Seminar Online CD with John Carter & Hubert Senters
1 × $6.00
3-Day Day Trading Seminar Online CD with John Carter & Hubert Senters
1 × $6.00 -
×
 $20 – 52k 20 pips a day challange with Rafał Zuchowicz - TopMasterTrader
1 × $5.00
$20 – 52k 20 pips a day challange with Rafał Zuchowicz - TopMasterTrader
1 × $5.00 -
×
 Secrets of the Darvas Trading System
1 × $6.00
Secrets of the Darvas Trading System
1 × $6.00 -
×
 A Complete Course in Option Trading Fundamentals with Joseph Frey
1 × $6.00
A Complete Course in Option Trading Fundamentals with Joseph Frey
1 × $6.00 -
×
 White Phoenix’s The Smart (Money) Approach to Trading with Jayson Casper
1 × $39.00
White Phoenix’s The Smart (Money) Approach to Trading with Jayson Casper
1 × $39.00 -
×
 How I Day Trade Course with Traderade
1 × $15.00
How I Day Trade Course with Traderade
1 × $15.00 -
×
 The A to Z of Mathematics: A Basic Guide with Thomas Sidebotham
1 × $6.00
The A to Z of Mathematics: A Basic Guide with Thomas Sidebotham
1 × $6.00 -
×
 How to Avoid Tax on Your Stock Market Profits with Lee Hadnum
1 × $6.00
How to Avoid Tax on Your Stock Market Profits with Lee Hadnum
1 × $6.00 -
×
 Volume Profile 2023 (Elite Pack) with Trader Dale
1 × $5.00
Volume Profile 2023 (Elite Pack) with Trader Dale
1 × $5.00 -
×
 Advanced Trading System - How To 10x Your Trading Skillsets & Results with The Trade Academy
1 × $6.00
Advanced Trading System - How To 10x Your Trading Skillsets & Results with The Trade Academy
1 × $6.00 -
×
 Quantamentals - The Next Great Forefront Of Trading and Investing with Trading Markets
1 × $8.00
Quantamentals - The Next Great Forefront Of Trading and Investing with Trading Markets
1 × $8.00 -
×
 Home Run Options Trading Course with Dave Aquino - Base Camp Trading
1 × $11.00
Home Run Options Trading Course with Dave Aquino - Base Camp Trading
1 × $11.00 -
×
 Beginner Boot Camp with Optionpit
1 × $62.00
Beginner Boot Camp with Optionpit
1 × $62.00 -
×
 The Orderflow Masterclass with PrimeTrading
1 × $17.00
The Orderflow Masterclass with PrimeTrading
1 × $17.00 -
×
 TRADING NFX Course with Andrew NFX
1 × $5.00
TRADING NFX Course with Andrew NFX
1 × $5.00 -
×
 Pairs Trading The Final Frontier with Don Kaufman
1 × $6.00
Pairs Trading The Final Frontier with Don Kaufman
1 × $6.00 -
×
 Forecast 2024 Clarification with Larry Williams
1 × $15.00
Forecast 2024 Clarification with Larry Williams
1 × $15.00 -
×
 CAT 2007 Seminar with Stephen W.Bigalow
1 × $6.00
CAT 2007 Seminar with Stephen W.Bigalow
1 × $6.00 -
×
 FX Prosperity Academy with Leonard Williams Jr
1 × $5.00
FX Prosperity Academy with Leonard Williams Jr
1 × $5.00 -
×
 Compass Trading System with Right Line Trading
1 × $39.00
Compass Trading System with Right Line Trading
1 × $39.00 -
×
 How To Buy with Justin Mamis
1 × $6.00
How To Buy with Justin Mamis
1 × $6.00 -
×
 A Complete Guide to the Futures Markets: Fundamental Analysis, Technical Analysis, Trading, Spreads, and Options (1st Edition) - Jack Schwager
1 × $6.00
A Complete Guide to the Futures Markets: Fundamental Analysis, Technical Analysis, Trading, Spreads, and Options (1st Edition) - Jack Schwager
1 × $6.00 -
×
 TradeCraft: Your Path to Peak Performance Trading By Adam Grimes
1 × $15.00
TradeCraft: Your Path to Peak Performance Trading By Adam Grimes
1 × $15.00 -
×
 Active Beta Indexes with Khalid Ghayur
1 × $6.00
Active Beta Indexes with Khalid Ghayur
1 × $6.00 -
×
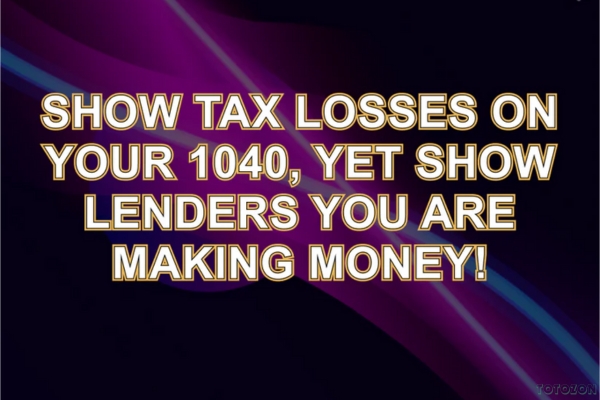 Show Tax Losses On Your 1040, Yet Show Lenders You Are Making Money! with Information Services Unlimited
1 × $6.00
Show Tax Losses On Your 1040, Yet Show Lenders You Are Making Money! with Information Services Unlimited
1 × $6.00 -
×
 High Probability Trading Using Elliott Wave And Fibonacci Analysis withVic Patel - Forex Training Group
1 × $10.00
High Probability Trading Using Elliott Wave And Fibonacci Analysis withVic Patel - Forex Training Group
1 × $10.00 -
×
 The Complete Guide to Multiple Time Frame Analysis & Reading Price Action with Aiman Almansoori
1 × $13.00
The Complete Guide to Multiple Time Frame Analysis & Reading Price Action with Aiman Almansoori
1 × $13.00 -
×
 The Prop Trading Code with Brannigan Barrett - Axia Futures
1 × $23.00
The Prop Trading Code with Brannigan Barrett - Axia Futures
1 × $23.00 -
×
 Crypto Trading Academy with Cheeky Investor - Aussie Day Trader
1 × $13.00
Crypto Trading Academy with Cheeky Investor - Aussie Day Trader
1 × $13.00 -
×
 Deep Dive Butterfly Trading Strategy Class with SJG Trades
1 × $41.00
Deep Dive Butterfly Trading Strategy Class with SJG Trades
1 × $41.00 -
×
 Original Curriculum with Home Options Trading Course
1 × $6.00
Original Curriculum with Home Options Trading Course
1 × $6.00 -
×
 The All Put Flat Butterfly with Dan Sheridan - Sheridan Options Mentoring
1 × $6.00
The All Put Flat Butterfly with Dan Sheridan - Sheridan Options Mentoring
1 × $6.00 -
×
 The Chaos Course. Cash in on Chaos with Hans Hannula
1 × $6.00
The Chaos Course. Cash in on Chaos with Hans Hannula
1 × $6.00 -
×
 Trading Aplications of Japanese Candlestick Charting with Gary S.Wagner & Bradley L.Matheny
1 × $6.00
Trading Aplications of Japanese Candlestick Charting with Gary S.Wagner & Bradley L.Matheny
1 × $6.00 -
×
 Smart Money Concepts with MFX Trading
1 × $13.00
Smart Money Concepts with MFX Trading
1 × $13.00 -
×
 4×4 Course with Gregoire Dupont
1 × $6.00
4×4 Course with Gregoire Dupont
1 × $6.00 -
×
 Advanced Spread Trading with Guy Bower - MasterClass Trader
1 × $15.00
Advanced Spread Trading with Guy Bower - MasterClass Trader
1 × $15.00 -
×
 8 Strategies for Day Trading
1 × $31.00
8 Strategies for Day Trading
1 × $31.00 -
×
 Advanced Trader with Nikos Trading Academy
1 × $5.00
Advanced Trader with Nikos Trading Academy
1 × $5.00 -
×
 Private Access Pro Webinars 2021-2022 with Trader Lion
1 × $5.00
Private Access Pro Webinars 2021-2022 with Trader Lion
1 × $5.00 -
×
 Options 201: Vertical and Calendar Spread Essentials 5 Part Class with Don Kaufman On Demand Replay
1 × $6.00
Options 201: Vertical and Calendar Spread Essentials 5 Part Class with Don Kaufman On Demand Replay
1 × $6.00 -
×
 All Candlestick Patterns Tested And Ranked with Quantified Strategies
1 × $8.00
All Candlestick Patterns Tested And Ranked with Quantified Strategies
1 × $8.00 -
×
 Matrix Spread Options Trading Course with Base Camp Trading
1 × $31.00
Matrix Spread Options Trading Course with Base Camp Trading
1 × $31.00 -
×
 Modern Portfolio Theory and Investment Analysis (7th Edition) with Edwin Elton, Martin Gruber, Stephen Brown & William Goetzmann
1 × $6.00
Modern Portfolio Theory and Investment Analysis (7th Edition) with Edwin Elton, Martin Gruber, Stephen Brown & William Goetzmann
1 × $6.00 -
×
 4 Strategies That Will Make You a Professional Day Trader with Jerremy Newsome
1 × $6.00
4 Strategies That Will Make You a Professional Day Trader with Jerremy Newsome
1 × $6.00 -
×
 9-Pack of TOS Indicators
1 × $6.00
9-Pack of TOS Indicators
1 × $6.00 -
×
 YTC Price Action Trader
1 × $6.00
YTC Price Action Trader
1 × $6.00 -
×
 Quarterly Theory with Trader Daye
1 × $20.00
Quarterly Theory with Trader Daye
1 × $20.00 -
×
 The Practical Handbook of Genetic Algorithms with Lance Chambers
1 × $6.00
The Practical Handbook of Genetic Algorithms with Lance Chambers
1 × $6.00 -
×
 Ultimate Trading Course with Dodgy's Dungeon
1 × $8.00
Ultimate Trading Course with Dodgy's Dungeon
1 × $8.00 -
×
 Bird Watch in Lion Country 2010 Ed with Dirk Du Toit
1 × $6.00
Bird Watch in Lion Country 2010 Ed with Dirk Du Toit
1 × $6.00 -
×
 CANDLESTICKS APPLIED with Steve Nison & Syl Desaulniers - Candle Charts
1 × $15.00
CANDLESTICKS APPLIED with Steve Nison & Syl Desaulniers - Candle Charts
1 × $15.00 -
×
 Passages To Profitability: A Comprehensive Guide To Channel Trading with Professor Jeff Bierman, CMT
1 × $6.00
Passages To Profitability: A Comprehensive Guide To Channel Trading with Professor Jeff Bierman, CMT
1 × $6.00 -
×
 Advanced Group Analysis Turorial with David Vomund
1 × $6.00
Advanced Group Analysis Turorial with David Vomund
1 × $6.00 -
×
 The Orderflows Trade Opportunities Encyclopedia with Michael Valtos
1 × $8.00
The Orderflows Trade Opportunities Encyclopedia with Michael Valtos
1 × $8.00 -
×
 Traders Winning Edge with Adrienne Laris Toghraie
1 × $6.00
Traders Winning Edge with Adrienne Laris Toghraie
1 × $6.00 -
×
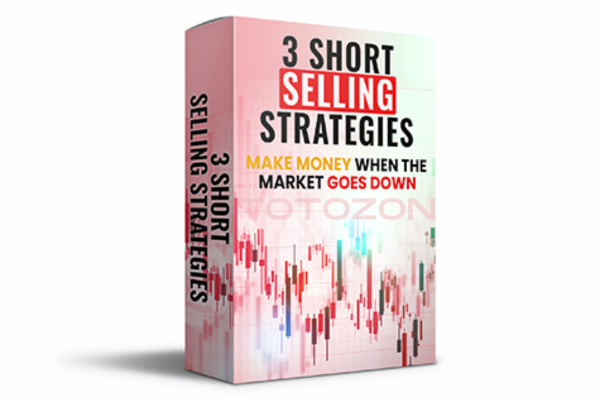 3 Short Selling Strategies - Trading Strategy Bundles – Quantified Strategies
1 × $39.00
3 Short Selling Strategies - Trading Strategy Bundles – Quantified Strategies
1 × $39.00 -
×
 5 Day Bootcamp with AWFX AnthonysWorld
1 × $34.00
5 Day Bootcamp with AWFX AnthonysWorld
1 × $34.00 -
×
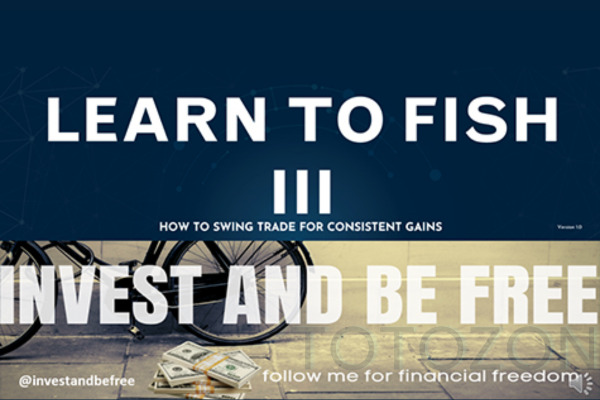 Learn To Fish Part III - How To Swing Trade for Consistent Gains with Daniel
1 × $15.00
Learn To Fish Part III - How To Swing Trade for Consistent Gains with Daniel
1 × $15.00 -
×
 Futures & Options Course with Talkin Options
1 × $15.00
Futures & Options Course with Talkin Options
1 × $15.00 -
×
 How to Call the Top in a Stock (To the Penny!) and Earn 9-11% Annualized Cash Yields Doing It with Dan Ferris
1 × $6.00
How to Call the Top in a Stock (To the Penny!) and Earn 9-11% Annualized Cash Yields Doing It with Dan Ferris
1 × $6.00 -
×
 How I use Technical Analysis & Orderflow with Adam Webb - Traderskew
1 × $54.00
How I use Technical Analysis & Orderflow with Adam Webb - Traderskew
1 × $54.00 -
×
 Financial Markets Online – VIP Membership with James Bentley
1 × $6.00
Financial Markets Online – VIP Membership with James Bentley
1 × $6.00 -
×
 Relationship of the StockMarket Fluctuations to the Lunarcycle with Frank J.Guarino
1 × $6.00
Relationship of the StockMarket Fluctuations to the Lunarcycle with Frank J.Guarino
1 × $6.00 -
×
 The Naked Eye: Raw Data Analytics with Edgar Torres - Raw Data Analytics
1 × $8.00
The Naked Eye: Raw Data Analytics with Edgar Torres - Raw Data Analytics
1 × $8.00 -
×
 Capital with Charles D.Ellis
1 × $6.00
Capital with Charles D.Ellis
1 × $6.00 -
×
 5 Technical Signals You Should Not Trade Without (4 CDs) with Toni Hansen
1 × $6.00
5 Technical Signals You Should Not Trade Without (4 CDs) with Toni Hansen
1 × $6.00 -
×
 Best of AM Review (Volume 1-3) with Peter Bain
1 × $6.00
Best of AM Review (Volume 1-3) with Peter Bain
1 × $6.00 -
×
 Advanced Trading Techniques 2 CDs with Sammy Chua
1 × $6.00
Advanced Trading Techniques 2 CDs with Sammy Chua
1 × $6.00 -
×
 Trading Short TermSame Day Trades Sep 2023 with Dan Sheridan & Mark Fenton - Sheridan Options Mentoring
1 × $31.00
Trading Short TermSame Day Trades Sep 2023 with Dan Sheridan & Mark Fenton - Sheridan Options Mentoring
1 × $31.00 -
×
 Options Trading & Ultimate MasterClass With Tyrone Abela - FX Evolution
1 × $54.00
Options Trading & Ultimate MasterClass With Tyrone Abela - FX Evolution
1 × $54.00 -
×
 How To Read The Market Professionally with TradeSmart
1 × $27.00
How To Read The Market Professionally with TradeSmart
1 × $27.00 -
×
 The Raptor 10 Momentum Methodology Course
1 × $6.00
The Raptor 10 Momentum Methodology Course
1 × $6.00 -
×
 The Binary Trigger (Video, Books) with John Piper
1 × $6.00
The Binary Trigger (Video, Books) with John Piper
1 × $6.00 -
×
 A Litle Keltner, a Litle Wycoff and of lot of Street Smarts with Linda Raschke
1 × $6.00
A Litle Keltner, a Litle Wycoff and of lot of Street Smarts with Linda Raschke
1 × $6.00 -
×
 Simpler Options - Insider’s Guide to Generating Income using Options Strategies Course (Oct 2014)
1 × $6.00
Simpler Options - Insider’s Guide to Generating Income using Options Strategies Course (Oct 2014)
1 × $6.00 -
×
 Essentials in Quantitative Trading QT01 By HangukQuant's
1 × $23.00
Essentials in Quantitative Trading QT01 By HangukQuant's
1 × $23.00 -
×
 All About Stock Market Strategies: The Easy Way To Get Started (All About Series) with David Brown
1 × $6.00
All About Stock Market Strategies: The Easy Way To Get Started (All About Series) with David Brown
1 × $6.00 -
×
 SNR Trader Course with Ariff T
1 × $6.00
SNR Trader Course with Ariff T
1 × $6.00 -
×
 FasTrack Premium with Note Conference
1 × $78.00
FasTrack Premium with Note Conference
1 × $78.00 -
×
 Order flow self-study training program with iMFtracker
1 × $10.00
Order flow self-study training program with iMFtracker
1 × $10.00 -
×
 Complete Short Black Scholes Options Trading Pricing Course
1 × $6.00
Complete Short Black Scholes Options Trading Pricing Course
1 × $6.00 -
×
 Floor Traders Edge Mentorship Program with Market Geeks
1 × $6.00
Floor Traders Edge Mentorship Program with Market Geeks
1 × $6.00 -
×
 WYCKOFF TRADING COURSE (WTC) PART I – ANALYSIS (Fall 2021) with Roman Bogomazov
1 × $209.00
WYCKOFF TRADING COURSE (WTC) PART I – ANALYSIS (Fall 2021) with Roman Bogomazov
1 × $209.00 -
×
 Bond Market Course with The Macro Compass
1 × $15.00
Bond Market Course with The Macro Compass
1 × $15.00
 with Arthur A.Hill")
Introduction to Candlestick (Article) with Arthur A.Hill
$6.00
File Size: Coming soon!
Delivery Time: 1–12 hours
Media Type: Online Course
Content Proof: Watch Here!
You may check content proof of “Introduction to Candlestick (Article) with Arthur A.Hill” below:
 with Arthur A.Hill")
Introduction to Candlestick (Article) with Arthur A. Hill
Candlestick charting is an essential tool for traders and investors, providing a visual representation of price movements. Arthur A. Hill, a renowned expert in technical analysis, offers a comprehensive introduction to candlestick charts, making them accessible to beginners and valuable for experienced traders. Let’s explore the basics of candlestick charting and how it can enhance your trading strategy.
What is a Candlestick Chart?
A candlestick chart is a type of financial chart used to describe price movements of a security, derivative, or currency.
Components of a Candlestick
- Body: The thick part of the candlestick, showing the opening and closing prices.
- Wicks/Shadows: The thin lines above and below the body, indicating the highest and lowest prices during the period.
- Color: Traditionally, a green or white body indicates a closing price higher than the opening price, while a red or black body indicates a closing price lower than the opening price.
History of Candlestick Charting
Candlestick charting originated in Japan over 300 years ago, developed by rice traders to track market prices and daily supply and demand.
Evolution of Candlestick Charts
Over the centuries, candlestick charting has evolved and gained popularity worldwide, becoming a staple in technical analysis.
Introduction to Western Markets
Candlestick charts were introduced to the Western financial markets in the late 20th century and quickly became popular among traders.
Advantages of Candlestick Charts
Candlestick charts offer several advantages over traditional bar charts and line charts.
Visual Clarity
Candlestick charts provide a clear and concise representation of price movements, making it easier to interpret market trends.
Immediate Insight
The color-coded bodies and wicks offer immediate insight into market sentiment and price direction.
Pattern Recognition
Candlestick charts are excellent for identifying patterns that can predict future price movements.
Common Candlestick Patterns
- Doji: Indicates indecision in the market.
- Hammer: Suggests a potential reversal from a downtrend.
- Engulfing: A strong signal of a potential trend reversal.
Basic Candlestick Patterns
Understanding basic candlestick patterns is crucial for any trader looking to use this charting method effectively.
Bullish Patterns
Bullish patterns indicate potential upward price movements.
Hammer and Inverted Hammer
- Hammer: A candlestick with a small body and a long lower wick, indicating potential reversal from a downtrend.
- Inverted Hammer: Similar to the hammer but with a long upper wick, suggesting a potential bullish reversal.
Bearish Patterns
Bearish patterns suggest potential downward price movements.
Shooting Star and Hanging Man
- Shooting Star: A candlestick with a small body and a long upper wick, indicating a potential reversal from an uptrend.
- Hanging Man: Similar to the hammer but occurs after an uptrend, signaling a potential bearish reversal.
Advanced Candlestick Patterns
For more experienced traders, advanced candlestick patterns provide deeper insights into market trends.
Engulfing Patterns
Engulfing patterns occur when a smaller candlestick is followed by a larger candlestick that completely engulfs the smaller one.
Bullish Engulfing
A bullish engulfing pattern occurs at the bottom of a downtrend and signals a potential upward reversal.
Bearish Engulfing
A bearish engulfing pattern appears at the top of an uptrend and suggests a potential downward reversal.
Morning Star and Evening Star
These patterns are three-candlestick formations that indicate strong trend reversals.
Morning Star
The morning star pattern consists of a bearish candle, a small indecisive candle, and a bullish candle, indicating a bullish reversal.
Evening Star
The evening star pattern includes a bullish candle, a small indecisive candle, and a bearish candle, suggesting a bearish reversal.
Incorporating Candlestick Charts into Your Trading Strategy
Candlestick charts are versatile and can be integrated into various trading strategies.
Combining with Other Indicators
Enhance the effectiveness of candlestick charts by combining them with other technical indicators.
Popular Indicators to Combine
- Moving Averages: Confirm trends and potential reversals.
- Relative Strength Index (RSI): Identify overbought or oversold conditions.
- Bollinger Bands: Measure market volatility and potential breakouts.
Setting Up Your Trading Platform
Most trading platforms offer candlestick charting options. Ensure you customize your charts to suit your trading style.
Customization Tips
- Time Frames: Choose appropriate time frames for your trading strategy.
- Color Schemes: Use distinct colors for bullish and bearish candles.
- Indicators: Add complementary indicators to your charts.
Common Mistakes to Avoid
Even with a robust understanding of candlestick charts, traders can make mistakes that affect their performance.
Over-reliance on Patterns
Relying solely on candlestick patterns without considering other factors can lead to false signals.
Diversify Analysis
Always use candlestick patterns in conjunction with other forms of analysis and market indicators.
Ignoring Market Context
Candlestick patterns can be misleading if not considered within the broader market context.
Comprehensive Analysis
Incorporate fundamental analysis and overall market trends to validate candlestick signals.
Conclusion
Candlestick charting, as introduced by Arthur A. Hill, offers a powerful tool for traders to understand and predict market movements. By mastering basic and advanced patterns, combining them with other technical indicators, and avoiding common pitfalls, traders can enhance their market analysis and trading performance. Whether you’re new to trading or an experienced trader, candlestick charts provide valuable insights that can guide your investment decisions.
Frequently Asked Questions:
- What is a candlestick chart?
A candlestick chart is a type of financial chart used to represent price movements over a specific period, showing the opening, closing, high, and low prices. - Why are candlestick charts popular among traders?
They provide visual clarity and help in identifying patterns that can predict future price movements. - What are some basic candlestick patterns?
Basic patterns include the hammer, inverted hammer, shooting star, and hanging man, which indicate potential market reversals. - Can candlestick charts be used with other technical indicators?
Yes, combining candlestick charts with indicators like moving averages, RSI, and Bollinger Bands enhances their effectiveness. - How can I avoid common mistakes when using candlestick charts?
Avoid over-relying on patterns and always consider the broader market context and other forms of analysis.
Be the first to review “Introduction to Candlestick (Article) with Arthur A.Hill”
You must be logged in to post a review.
Related products
Forex Trading
Original price was: $1,898.00.$10.00Current price is: $10.00.

Original price was: $999.00.$5.00Current price is: $5.00.
Original price was: $695.00.$41.00Current price is: $41.00.
Forex Trading
Original price was: $4,997.00.$27.00Current price is: $27.00.

Forex Trading
Original price was: $799.00.$15.00Current price is: $15.00.
Original price was: $1,200.00.$23.00Current price is: $23.00.
Forex Trading
The Complete Guide to Multiple Time Frame Analysis & Reading Price Action with Aiman Almansoori
Original price was: $1,399.00.$13.00Current price is: $13.00.
Forex Trading
Original price was: $125.00.$17.00Current price is: $17.00.
Forex Trading
Quantamentals – The Next Great Forefront Of Trading and Investing with Trading Markets
Original price was: $1,495.00.$8.00Current price is: $8.00.
Forex Trading
Original price was: $2,995.00.$31.00Current price is: $31.00.
Forex Trading
Original price was: $239.00.$8.00Current price is: $8.00.
Original price was: $139.00.$23.00Current price is: $23.00.
Forex Trading
Original price was: $499.00.$15.00Current price is: $15.00.
Original price was: $700.00.$39.00Current price is: $39.00.

Original price was: $310.00.$23.00Current price is: $23.00.
Forex Trading
Original price was: $797.00.$10.00Current price is: $10.00.

Original price was: $649.00.$20.00Current price is: $20.00.
Original price was: $197.00.$5.00Current price is: $5.00.
Original price was: $1,800.00.$54.00Current price is: $54.00.

Forex Trading
Original price was: $697.00.$5.00Current price is: $5.00.

Reviews
There are no reviews yet.