-
×
 Order flow self-study training program with iMFtracker
1 × $10.00
Order flow self-study training program with iMFtracker
1 × $10.00 -
×
 TickScalper Trading System
1 × $23.00
TickScalper Trading System
1 × $23.00 -
×
 My General Counsel™
1 × $23.00
My General Counsel™
1 × $23.00 -
×
 Growing Rich with Growth Stocks: Wall Street's Top Money Managers Reveal the 12 Rules for Investment Success - Kirk Kazanjian
1 × $6.00
Growing Rich with Growth Stocks: Wall Street's Top Money Managers Reveal the 12 Rules for Investment Success - Kirk Kazanjian
1 × $6.00 -
×
 Quantamentals - The Next Great Forefront Of Trading and Investing with Trading Markets
1 × $8.00
Quantamentals - The Next Great Forefront Of Trading and Investing with Trading Markets
1 × $8.00 -
×
 Trading Short TermSame Day Trades Sep 2023 with Dan Sheridan & Mark Fenton - Sheridan Options Mentoring
1 × $31.00
Trading Short TermSame Day Trades Sep 2023 with Dan Sheridan & Mark Fenton - Sheridan Options Mentoring
1 × $31.00 -
×
 The A14 Weekly Option Strategy Workshop with Amy Meissner
1 × $23.00
The A14 Weekly Option Strategy Workshop with Amy Meissner
1 × $23.00 -
×
 The Complete Guide to Multiple Time Frame Analysis & Reading Price Action with Aiman Almansoori
1 × $13.00
The Complete Guide to Multiple Time Frame Analysis & Reading Price Action with Aiman Almansoori
1 × $13.00 -
×
 The Motley Fool Million Dollar Portfolio: How to Build and Grow a Panic-Proof Investment Portfolio with David Gardner & Tom Gardner
1 × $6.00
The Motley Fool Million Dollar Portfolio: How to Build and Grow a Panic-Proof Investment Portfolio with David Gardner & Tom Gardner
1 × $6.00 -
×
 Deep Dive Butterfly Trading Strategy Class with SJG Trades
1 × $41.00
Deep Dive Butterfly Trading Strategy Class with SJG Trades
1 × $41.00 -
×
 Filtered Waves. Basic Theory with Arthur A.Merrill
1 × $7.00
Filtered Waves. Basic Theory with Arthur A.Merrill
1 × $7.00 -
×
 Compass Trading System with Right Line Trading
1 × $39.00
Compass Trading System with Right Line Trading
1 × $39.00 -
×
 W. D Gann 's Square Of 9 Applied To Modern Markets with Sean Avidar - Hexatrade350
1 × $23.00
W. D Gann 's Square Of 9 Applied To Modern Markets with Sean Avidar - Hexatrade350
1 × $23.00 -
×
 The Best Option Trading Course with David Jaffee - Best Stock Strategy
1 × $15.00
The Best Option Trading Course with David Jaffee - Best Stock Strategy
1 × $15.00 -
×
 FruitFly For Consistent Income with Matt Williamson
1 × $6.00
FruitFly For Consistent Income with Matt Williamson
1 × $6.00 -
×
 How To Trade the Best Currency Pairs Using The Ichimoku Cloud with Alphashark
1 × $31.00
How To Trade the Best Currency Pairs Using The Ichimoku Cloud with Alphashark
1 × $31.00 -
×
 Jack Corsellis Bundle 2021 Full Course with Jack Corsellis
1 × $5.00
Jack Corsellis Bundle 2021 Full Course with Jack Corsellis
1 × $5.00 -
×
 SQX Mentorship with Tip Toe Hippo
1 × $23.00
SQX Mentorship with Tip Toe Hippo
1 × $23.00 -
×
 Jtrader - Risk Management 1on1
1 × $23.00
Jtrader - Risk Management 1on1
1 × $23.00 -
×
 Investing With Giants: Tried and True Stocks That Have Sustained the Test of Time with Linda T.Mead
1 × $6.00
Investing With Giants: Tried and True Stocks That Have Sustained the Test of Time with Linda T.Mead
1 × $6.00 -
×
 $20 – 52k 20 pips a day challange with Rafał Zuchowicz - TopMasterTrader
1 × $5.00
$20 – 52k 20 pips a day challange with Rafał Zuchowicz - TopMasterTrader
1 × $5.00 -
×
 Day Trading MasterClass with Tyrone Abela - FX Evolution
1 × $139.00
Day Trading MasterClass with Tyrone Abela - FX Evolution
1 × $139.00 -
×
 TRADING NFX Course with Andrew NFX
1 × $5.00
TRADING NFX Course with Andrew NFX
1 × $5.00 -
×
 The Orderflow Masterclass with PrimeTrading
1 × $17.00
The Orderflow Masterclass with PrimeTrading
1 × $17.00 -
×
 Options Trading & Ultimate MasterClass With Tyrone Abela - FX Evolution
1 × $54.00
Options Trading & Ultimate MasterClass With Tyrone Abela - FX Evolution
1 × $54.00 -
×
 Evolved Traders with Riley Coleman
1 × $5.00
Evolved Traders with Riley Coleman
1 × $5.00 -
×
 Dow Jones Secret. Never Lose a Trade with Karl Dittmann
1 × $6.00
Dow Jones Secret. Never Lose a Trade with Karl Dittmann
1 × $6.00 -
×
 Ichimokutrade - Elliot Wave 101
1 × $15.00
Ichimokutrade - Elliot Wave 101
1 × $15.00 -
×
 Four Steps to Trading Economic Indicators
1 × $6.00
Four Steps to Trading Economic Indicators
1 × $6.00 -
×
 Options, Futures & Other Derivatives . Solutions Manual
1 × $6.00
Options, Futures & Other Derivatives . Solutions Manual
1 × $6.00 -
×
 ICT Prodigy Trading Course – $650K in Payouts with Alex Solignani
1 × $15.00
ICT Prodigy Trading Course – $650K in Payouts with Alex Solignani
1 × $15.00 -
×
 Part I Basic and Part II Beyond the Basic with Strategic Trading
1 × $6.00
Part I Basic and Part II Beyond the Basic with Strategic Trading
1 × $6.00 -
×
 Hit The Mark Trading - Boot Camp 2016 Courses
1 × $23.00
Hit The Mark Trading - Boot Camp 2016 Courses
1 × $23.00 -
×
 DNA Wealth Blueprint 3 (Complete)
1 × $54.00
DNA Wealth Blueprint 3 (Complete)
1 × $54.00 -
×
 Butterfly and Condor Workshop with Aeromir
1 × $15.00
Butterfly and Condor Workshop with Aeromir
1 × $15.00 -
×
 Forex Strategy Master
1 × $31.00
Forex Strategy Master
1 × $31.00 -
×
 The Best of the Professional Traders Journal: Day Trading with Larry Connors
1 × $6.00
The Best of the Professional Traders Journal: Day Trading with Larry Connors
1 × $6.00 -
×
 AI For Traders with Trading Markets
1 × $31.00
AI For Traders with Trading Markets
1 × $31.00 -
×
 Signature Trade from Forexia with Dylan Forexia
1 × $85.00
Signature Trade from Forexia with Dylan Forexia
1 × $85.00 -
×
 The Naked Eye: Raw Data Analytics with Edgar Torres - Raw Data Analytics
1 × $8.00
The Naked Eye: Raw Data Analytics with Edgar Torres - Raw Data Analytics
1 × $8.00 -
×
 Monster IPO with Trick Trades
1 × $23.00
Monster IPO with Trick Trades
1 × $23.00 -
×
 WondaFX Signature Strategy with WondaFX
1 × $5.00
WondaFX Signature Strategy with WondaFX
1 × $5.00 -
×
 Forex Advanced with Prophetic Pips Academy
1 × $5.00
Forex Advanced with Prophetic Pips Academy
1 × $5.00 -
×
 How To Read The Market Professionally with TradeSmart
1 × $27.00
How To Read The Market Professionally with TradeSmart
1 × $27.00 -
×
 Expectations Investing with Alfred Rappaport
1 × $6.00
Expectations Investing with Alfred Rappaport
1 × $6.00 -
×
 The Haller Theory of Stock Market Trends
1 × $6.00
The Haller Theory of Stock Market Trends
1 × $6.00 -
×
 Mind of a Trader with Alpesh Patel
1 × $6.00
Mind of a Trader with Alpesh Patel
1 × $6.00 -
×
 0 DTE Options Trading Workshop with Aeromir Corporation
1 × $15.00
0 DTE Options Trading Workshop with Aeromir Corporation
1 × $15.00 -
×
 Algo Trading Masterclass with Ali Casey - StatOasis
1 × $23.00
Algo Trading Masterclass with Ali Casey - StatOasis
1 × $23.00 -
×
 Out of the Pits with Caitlin Zaloom
1 × $6.00
Out of the Pits with Caitlin Zaloom
1 × $6.00 -
×
 Market Risk Analysis, Volume IV, Value at Risk Models with Carol Alexander
1 × $6.00
Market Risk Analysis, Volume IV, Value at Risk Models with Carol Alexander
1 × $6.00 -
×
 FTMO Academy Course
1 × $5.00
FTMO Academy Course
1 × $5.00 -
×
 Essentials in Quantitative Trading QT01 By HangukQuant's
1 × $23.00
Essentials in Quantitative Trading QT01 By HangukQuant's
1 × $23.00 -
×
 Futures Masterclass with Market Flow Trader
1 × $17.00
Futures Masterclass with Market Flow Trader
1 × $17.00 -
×
 Pro Trend Trader 2017 with James Orr
1 × $31.00
Pro Trend Trader 2017 with James Orr
1 × $31.00 -
×
 Mission Million Money Management Course
1 × $31.00
Mission Million Money Management Course
1 × $31.00 -
×
 White Phoenix’s The Smart (Money) Approach to Trading with Jayson Casper
1 × $39.00
White Phoenix’s The Smart (Money) Approach to Trading with Jayson Casper
1 × $39.00 -
×
 Futures Trading Mastery 2022 | FREE Top 45 Trading Signals!
1 × $5.00
Futures Trading Mastery 2022 | FREE Top 45 Trading Signals!
1 × $5.00 -
×
 Lifestyle Trading with L.E.A.P.S.
1 × $6.00
Lifestyle Trading with L.E.A.P.S.
1 × $6.00 -
×
 Trading NQ At The US Open with TradeSmart
1 × $10.00
Trading NQ At The US Open with TradeSmart
1 × $10.00 -
×
 Scalp Strategy and Flipping Small Accounts with Opes Trading Group
1 × $5.00
Scalp Strategy and Flipping Small Accounts with Opes Trading Group
1 × $5.00 -
×
 The Art Of Adaptive Trading Using Market Profile & Market Delta
1 × $23.00
The Art Of Adaptive Trading Using Market Profile & Market Delta
1 × $23.00 -
×
 Crystal Ball Pack PLUS bonus Live Trade By Pat Mitchell - Trick Trades
1 × $20.00
Crystal Ball Pack PLUS bonus Live Trade By Pat Mitchell - Trick Trades
1 × $20.00 -
×
 TradeCraft: Your Path to Peak Performance Trading By Adam Grimes
1 × $15.00
TradeCraft: Your Path to Peak Performance Trading By Adam Grimes
1 × $15.00 -
×
 Investing with LEAPS. What You Should Know About Long Term Investing with James Bittman
1 × $6.00
Investing with LEAPS. What You Should Know About Long Term Investing with James Bittman
1 × $6.00 -
×
 The Prop Trading Code with Brannigan Barrett - Axia Futures
1 × $23.00
The Prop Trading Code with Brannigan Barrett - Axia Futures
1 × $23.00 -
×
 Forecast 2024 Clarification with Larry Williams
1 × $15.00
Forecast 2024 Clarification with Larry Williams
1 × $15.00 -
×
 Interpreting Balance of Power with Peter Worden
1 × $6.00
Interpreting Balance of Power with Peter Worden
1 × $6.00 -
×
 Compound Stock Earnings Advanced Charting (Video 1.19 GB)
1 × $15.00
Compound Stock Earnings Advanced Charting (Video 1.19 GB)
1 × $15.00 -
×
 MOJO TOOLBOX with ProTrader Mike
1 × $23.00
MOJO TOOLBOX with ProTrader Mike
1 × $23.00 -
×
 The Trading Blueprint with Brad Goh - The Trading Geek
1 × $5.00
The Trading Blueprint with Brad Goh - The Trading Geek
1 × $5.00 -
×
 The Indices Orderflow Masterclass with The Forex Scalpers
1 × $23.00
The Indices Orderflow Masterclass with The Forex Scalpers
1 × $23.00 -
×
 Duration Iron Condors Class: An Income Strategy for All Markets with Don Kaufman
1 × $6.00
Duration Iron Condors Class: An Income Strategy for All Markets with Don Kaufman
1 × $6.00 -
×
 Offensive & Defensive Strengths of Stocks, Groups & Sectors Gary Anderson
1 × $6.00
Offensive & Defensive Strengths of Stocks, Groups & Sectors Gary Anderson
1 × $6.00 -
×
 Fibonacci Swing Trader 2.0 with Frank Paul - Forexmentor
1 × $6.00
Fibonacci Swing Trader 2.0 with Frank Paul - Forexmentor
1 × $6.00 -
×
 Robotic Trading: Skill Sharpening with Claytrader
1 × $23.00
Robotic Trading: Skill Sharpening with Claytrader
1 × $23.00 -
×
 High Probability Trading Using Elliott Wave And Fibonacci Analysis withVic Patel - Forex Training Group
1 × $10.00
High Probability Trading Using Elliott Wave And Fibonacci Analysis withVic Patel - Forex Training Group
1 × $10.00 -
×
 Bond Market Course with The Macro Compass
1 × $15.00
Bond Market Course with The Macro Compass
1 × $15.00 -
×
 Pinpoint Profit Method Class
1 × $31.00
Pinpoint Profit Method Class
1 × $31.00 -
×
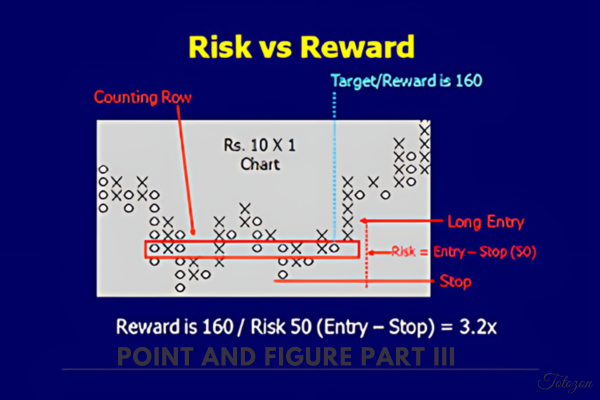 Point And Figure Part III By Bruce Fraser & Roman Bogomazov - Wyckoff Analytics
1 × $23.00
Point And Figure Part III By Bruce Fraser & Roman Bogomazov - Wyckoff Analytics
1 × $23.00 -
×
 Protecting your Retirement Account in a Correction with Dan Sheridan - Sheridan Options Mentoring
1 × $31.00
Protecting your Retirement Account in a Correction with Dan Sheridan - Sheridan Options Mentoring
1 × $31.00 -
×
 Home Run Options Trading Course with Dave Aquino - Base Camp Trading
1 × $11.00
Home Run Options Trading Course with Dave Aquino - Base Camp Trading
1 × $11.00 -
×
 Original Curriculum with Home Options Trading Course
1 × $6.00
Original Curriculum with Home Options Trading Course
1 × $6.00 -
×
 Forex Powerband Dominator
1 × $6.00
Forex Powerband Dominator
1 × $6.00 -
×
 Daryl Guppy Tutorials In Technical Analysis (2000-2001-2003-2004)
1 × $6.00
Daryl Guppy Tutorials In Technical Analysis (2000-2001-2003-2004)
1 × $6.00 -
×
 Forex for Profits with Todd Mitchell
1 × $85.00
Forex for Profits with Todd Mitchell
1 × $85.00 -
×
 Creating & Using a Trading Plan with Paul Lange
1 × $8.00
Creating & Using a Trading Plan with Paul Lange
1 × $8.00 -
×
 The Right Stock at the Right Time. Prospering in the Coming Good Years with Larry Williams
1 × $6.00
The Right Stock at the Right Time. Prospering in the Coming Good Years with Larry Williams
1 × $6.00 -
×
 Matrix Spread Options Trading Course with Base Camp Trading
1 × $31.00
Matrix Spread Options Trading Course with Base Camp Trading
1 × $31.00 -
×
 INSIDER HEDGE FUND FORMULA (IHFF)
1 × $6.00
INSIDER HEDGE FUND FORMULA (IHFF)
1 × $6.00 -
×
 Finding and Analyzing Stocks on your PC with Peter Worden
1 × $4.00
Finding and Analyzing Stocks on your PC with Peter Worden
1 × $4.00 -
×
 Market Profile Training with Futexlive
1 × $23.00
Market Profile Training with Futexlive
1 × $23.00 -
×
 FOREX MASTER TRADING COURSE with BKFOREX
1 × $5.00
FOREX MASTER TRADING COURSE with BKFOREX
1 × $5.00 -
×
 Main Online Course with FestX
1 × $5.00
Main Online Course with FestX
1 × $5.00 -
×
 Linda Raschke Short Term Trading Strategies with David Vomund
1 × $6.00
Linda Raschke Short Term Trading Strategies with David Vomund
1 × $6.00 -
×
 Forex Courses Collection
1 × $55.00
Forex Courses Collection
1 × $55.00 -
×
 Programming in Python For Traders with Trading Markets
1 × $15.00
Programming in Python For Traders with Trading Markets
1 × $15.00 -
×
 Options University - FX Technical Analysis
1 × $6.00
Options University - FX Technical Analysis
1 × $6.00 -
×
 Astro View Horse Racing Show
1 × $6.00
Astro View Horse Racing Show
1 × $6.00 -
×
 Candlesticks MegaPackage Vol 1-4 (CCA) with Candle Charts
1 × $62.00
Candlesticks MegaPackage Vol 1-4 (CCA) with Candle Charts
1 × $62.00 -
×
 Volcano Trading with Claytrader
1 × $15.00
Volcano Trading with Claytrader
1 × $15.00 -
×
 Currency Trading and Intermarket Analysis
1 × $6.00
Currency Trading and Intermarket Analysis
1 × $6.00 -
×
 Best of the Best: Collars with Amy Meissner & Scott Ruble
1 × $15.00
Best of the Best: Collars with Amy Meissner & Scott Ruble
1 × $15.00 -
×
 Power Income FUTURES Day Trading Course with Trade Out Loud
1 × $31.00
Power Income FUTURES Day Trading Course with Trade Out Loud
1 × $31.00 -
×
 Trading Double Diagonals in 2019 with Dan Sheridan - Sheridan Options Mentoring
1 × $5.00
Trading Double Diagonals in 2019 with Dan Sheridan - Sheridan Options Mentoring
1 × $5.00 -
×
 Multi Squeeze Pro Indicator (PREMIUM)
1 × $69.00
Multi Squeeze Pro Indicator (PREMIUM)
1 × $69.00 -
×
 FX Accelerator
1 × $31.00
FX Accelerator
1 × $31.00 -
×
 Precision Pattern Trading with Daryl Guppy
1 × $6.00
Precision Pattern Trading with Daryl Guppy
1 × $6.00 -
×
 Crypto Trading Academy with Cheeky Investor - Aussie Day Trader
1 × $13.00
Crypto Trading Academy with Cheeky Investor - Aussie Day Trader
1 × $13.00 -
×
 SnD SMC Course
1 × $10.00
SnD SMC Course
1 × $10.00 -
×
 The Four Biggest Mistakes in Futures Trading (1st Edition) with Jay Kaeppel
1 × $6.00
The Four Biggest Mistakes in Futures Trading (1st Edition) with Jay Kaeppel
1 × $6.00 -
×
 The Dick Davis Dividend: Straight Talk on Making Money from 40 Years on Wall Street with Dick Davis
1 × $6.00
The Dick Davis Dividend: Straight Talk on Making Money from 40 Years on Wall Street with Dick Davis
1 × $6.00 -
×
 Trading Full Circle the Complete Underground Trader System for Timing with Jea Yu
1 × $6.00
Trading Full Circle the Complete Underground Trader System for Timing with Jea Yu
1 × $6.00 -
×
 Mastering Collar Trades Pro with Vince Vora - TradingWins
1 × $6.00
Mastering Collar Trades Pro with Vince Vora - TradingWins
1 × $6.00 -
×
 TC Top & Bottom Finder with Trader Confident
1 × $93.00
TC Top & Bottom Finder with Trader Confident
1 × $93.00 -
×
 Random Walk Trading Options Professional
1 × $31.00
Random Walk Trading Options Professional
1 × $31.00 -
×
 Advanced Spread Trading with Guy Bower - MasterClass Trader
1 × $15.00
Advanced Spread Trading with Guy Bower - MasterClass Trader
1 × $15.00
 with Arthur A.Hill")
Introduction to Candlestick (Article) with Arthur A.Hill
$6.00
File Size: Coming soon!
Delivery Time: 1–12 hours
Media Type: Online Course
Content Proof: Watch Here!
You may check content proof of “Introduction to Candlestick (Article) with Arthur A.Hill” below:
 with Arthur A.Hill")
Introduction to Candlestick (Article) with Arthur A. Hill
Candlestick charting is an essential tool for traders and investors, providing a visual representation of price movements. Arthur A. Hill, a renowned expert in technical analysis, offers a comprehensive introduction to candlestick charts, making them accessible to beginners and valuable for experienced traders. Let’s explore the basics of candlestick charting and how it can enhance your trading strategy.
What is a Candlestick Chart?
A candlestick chart is a type of financial chart used to describe price movements of a security, derivative, or currency.
Components of a Candlestick
- Body: The thick part of the candlestick, showing the opening and closing prices.
- Wicks/Shadows: The thin lines above and below the body, indicating the highest and lowest prices during the period.
- Color: Traditionally, a green or white body indicates a closing price higher than the opening price, while a red or black body indicates a closing price lower than the opening price.
History of Candlestick Charting
Candlestick charting originated in Japan over 300 years ago, developed by rice traders to track market prices and daily supply and demand.
Evolution of Candlestick Charts
Over the centuries, candlestick charting has evolved and gained popularity worldwide, becoming a staple in technical analysis.
Introduction to Western Markets
Candlestick charts were introduced to the Western financial markets in the late 20th century and quickly became popular among traders.
Advantages of Candlestick Charts
Candlestick charts offer several advantages over traditional bar charts and line charts.
Visual Clarity
Candlestick charts provide a clear and concise representation of price movements, making it easier to interpret market trends.
Immediate Insight
The color-coded bodies and wicks offer immediate insight into market sentiment and price direction.
Pattern Recognition
Candlestick charts are excellent for identifying patterns that can predict future price movements.
Common Candlestick Patterns
- Doji: Indicates indecision in the market.
- Hammer: Suggests a potential reversal from a downtrend.
- Engulfing: A strong signal of a potential trend reversal.
Basic Candlestick Patterns
Understanding basic candlestick patterns is crucial for any trader looking to use this charting method effectively.
Bullish Patterns
Bullish patterns indicate potential upward price movements.
Hammer and Inverted Hammer
- Hammer: A candlestick with a small body and a long lower wick, indicating potential reversal from a downtrend.
- Inverted Hammer: Similar to the hammer but with a long upper wick, suggesting a potential bullish reversal.
Bearish Patterns
Bearish patterns suggest potential downward price movements.
Shooting Star and Hanging Man
- Shooting Star: A candlestick with a small body and a long upper wick, indicating a potential reversal from an uptrend.
- Hanging Man: Similar to the hammer but occurs after an uptrend, signaling a potential bearish reversal.
Advanced Candlestick Patterns
For more experienced traders, advanced candlestick patterns provide deeper insights into market trends.
Engulfing Patterns
Engulfing patterns occur when a smaller candlestick is followed by a larger candlestick that completely engulfs the smaller one.
Bullish Engulfing
A bullish engulfing pattern occurs at the bottom of a downtrend and signals a potential upward reversal.
Bearish Engulfing
A bearish engulfing pattern appears at the top of an uptrend and suggests a potential downward reversal.
Morning Star and Evening Star
These patterns are three-candlestick formations that indicate strong trend reversals.
Morning Star
The morning star pattern consists of a bearish candle, a small indecisive candle, and a bullish candle, indicating a bullish reversal.
Evening Star
The evening star pattern includes a bullish candle, a small indecisive candle, and a bearish candle, suggesting a bearish reversal.
Incorporating Candlestick Charts into Your Trading Strategy
Candlestick charts are versatile and can be integrated into various trading strategies.
Combining with Other Indicators
Enhance the effectiveness of candlestick charts by combining them with other technical indicators.
Popular Indicators to Combine
- Moving Averages: Confirm trends and potential reversals.
- Relative Strength Index (RSI): Identify overbought or oversold conditions.
- Bollinger Bands: Measure market volatility and potential breakouts.
Setting Up Your Trading Platform
Most trading platforms offer candlestick charting options. Ensure you customize your charts to suit your trading style.
Customization Tips
- Time Frames: Choose appropriate time frames for your trading strategy.
- Color Schemes: Use distinct colors for bullish and bearish candles.
- Indicators: Add complementary indicators to your charts.
Common Mistakes to Avoid
Even with a robust understanding of candlestick charts, traders can make mistakes that affect their performance.
Over-reliance on Patterns
Relying solely on candlestick patterns without considering other factors can lead to false signals.
Diversify Analysis
Always use candlestick patterns in conjunction with other forms of analysis and market indicators.
Ignoring Market Context
Candlestick patterns can be misleading if not considered within the broader market context.
Comprehensive Analysis
Incorporate fundamental analysis and overall market trends to validate candlestick signals.
Conclusion
Candlestick charting, as introduced by Arthur A. Hill, offers a powerful tool for traders to understand and predict market movements. By mastering basic and advanced patterns, combining them with other technical indicators, and avoiding common pitfalls, traders can enhance their market analysis and trading performance. Whether you’re new to trading or an experienced trader, candlestick charts provide valuable insights that can guide your investment decisions.
Frequently Asked Questions:
- What is a candlestick chart?
A candlestick chart is a type of financial chart used to represent price movements over a specific period, showing the opening, closing, high, and low prices. - Why are candlestick charts popular among traders?
They provide visual clarity and help in identifying patterns that can predict future price movements. - What are some basic candlestick patterns?
Basic patterns include the hammer, inverted hammer, shooting star, and hanging man, which indicate potential market reversals. - Can candlestick charts be used with other technical indicators?
Yes, combining candlestick charts with indicators like moving averages, RSI, and Bollinger Bands enhances their effectiveness. - How can I avoid common mistakes when using candlestick charts?
Avoid over-relying on patterns and always consider the broader market context and other forms of analysis.
Be the first to review “Introduction to Candlestick (Article) with Arthur A.Hill”
You must be logged in to post a review.
Related products
Forex Trading
Original price was: $1,898.00.$10.00Current price is: $10.00.
Forex Trading
Original price was: $500.00.$5.00Current price is: $5.00.
Forex Trading
Original price was: $550.00.$5.00Current price is: $5.00.
Original price was: $999.00.$5.00Current price is: $5.00.
Forex Trading
Original price was: $999.00.$15.00Current price is: $15.00.
Original price was: $4,995.00.$15.00Current price is: $15.00.
Original price was: $649.00.$20.00Current price is: $20.00.
Original price was: $997.00.$13.00Current price is: $13.00.
Original price was: $997.00.$8.00Current price is: $8.00.
Forex Trading
Original price was: $499.00.$15.00Current price is: $15.00.
Original price was: $1,849.00.$15.00Current price is: $15.00.
Forex Trading
Original price was: $2,997.00.$23.00Current price is: $23.00.
Original price was: $895.00.$15.00Current price is: $15.00.
Forex Trading
Original price was: $2,995.00.$31.00Current price is: $31.00.
Forex Trading
Original price was: $2,000.00.$23.00Current price is: $23.00.
Original price was: $1,800.00.$54.00Current price is: $54.00.
Forex Trading
Original price was: $125.00.$17.00Current price is: $17.00.
Original price was: $700.00.$39.00Current price is: $39.00.
Forex Trading
Original price was: $397.00.$31.00Current price is: $31.00.
Original price was: $695.00.$41.00Current price is: $41.00.

Reviews
There are no reviews yet.