-
×
 The TFDW Bundle – Tradingfanatic
1 × $15.00
The TFDW Bundle – Tradingfanatic
1 × $15.00 -
×
 Proven Swing Trading Strat & Multiple Time Frame Analysis - Robert Krausz & Thom Hartle
1 × $6.00
Proven Swing Trading Strat & Multiple Time Frame Analysis - Robert Krausz & Thom Hartle
1 × $6.00 -
×
 Butterfly's Guide to Weekly Returns with Don Kaufman
1 × $6.00
Butterfly's Guide to Weekly Returns with Don Kaufman
1 × $6.00 -
×
 Trading Floor Training
1 × $6.00
Trading Floor Training
1 × $6.00 -
×
 Alternative Assets and Strategic Allocation with John Abbink
1 × $6.00
Alternative Assets and Strategic Allocation with John Abbink
1 × $6.00 -
×
 Forty Cents for Financial Freedom with Darlene Nelson
1 × $6.00
Forty Cents for Financial Freedom with Darlene Nelson
1 × $6.00 -
×
 Flow Indicator Software Perfect for Futures Ninjatrader
1 × $23.00
Flow Indicator Software Perfect for Futures Ninjatrader
1 × $23.00 -
×
 The Indices Orderflow Masterclass with The Forex Scalpers
1 × $23.00
The Indices Orderflow Masterclass with The Forex Scalpers
1 × $23.00 -
×
 Fast Track Course with Tradelikerocket
1 × $233.00
Fast Track Course with Tradelikerocket
1 × $233.00 -
×
 Applied Quantitative Methods for Trading and Investment with Christian Dunis, Jason Laws & Patrick Na¿m
1 × $6.00
Applied Quantitative Methods for Trading and Investment with Christian Dunis, Jason Laws & Patrick Na¿m
1 × $6.00 -
×
 HEDGED STRATEGY SERIES IN VOLATILE MARKETS – HEDGED CREDIT SPREADS - Dan Sheridan
1 × $6.00
HEDGED STRATEGY SERIES IN VOLATILE MARKETS – HEDGED CREDIT SPREADS - Dan Sheridan
1 × $6.00 -
×
 Opening Range Breakout Indicator for ThinkorSwim
1 × $6.00
Opening Range Breakout Indicator for ThinkorSwim
1 × $6.00 -
×
 Options Income Generating Blueprint
1 × $31.00
Options Income Generating Blueprint
1 × $31.00 -
×
 A Conservative Plan to Make $3K Monthly on $25K with Dan Sheridan – Sheridan Options Mentoring
1 × $23.00
A Conservative Plan to Make $3K Monthly on $25K with Dan Sheridan – Sheridan Options Mentoring
1 × $23.00 -
×
 T3 Live - The Simple Art of Trading
1 × $31.00
T3 Live - The Simple Art of Trading
1 × $31.00 -
×
 Learn To Profit From The Forex Market with FX Hustle
1 × $6.00
Learn To Profit From The Forex Market with FX Hustle
1 × $6.00 -
×
 Options Trading with Nick & Gareth - Nick Santiago & Gareth Soloway - InTheMoneyStocks
1 × $31.00
Options Trading with Nick & Gareth - Nick Santiago & Gareth Soloway - InTheMoneyStocks
1 × $31.00 -
×
 Rockwell Day Trading - Starter Package
1 × $6.00
Rockwell Day Trading - Starter Package
1 × $6.00 -
×
 Increase Your Net Worth In 2 Hours A Week with Jerremy Newsome - Real Life Trading
1 × $17.00
Increase Your Net Worth In 2 Hours A Week with Jerremy Newsome - Real Life Trading
1 × $17.00 -
×
 Volatility Position Risk Management with Cynthia Kase
1 × $6.00
Volatility Position Risk Management with Cynthia Kase
1 × $6.00 -
×
 Trading Short TermSame Day Trades Sep 2023 with Dan Sheridan & Mark Fenton - Sheridan Options Mentoring
1 × $31.00
Trading Short TermSame Day Trades Sep 2023 with Dan Sheridan & Mark Fenton - Sheridan Options Mentoring
1 × $31.00 -
×
 Investment Madness with John Nofsinger
1 × $6.00
Investment Madness with John Nofsinger
1 × $6.00 -
×
 How to Pick Hot Reverse Merger Penny Stocks with John Lux
1 × $5.00
How to Pick Hot Reverse Merger Penny Stocks with John Lux
1 × $5.00 -
×
 Road to consistent profits (Dec 2022) with Jarrod Goodwin - Trading Halls of Knowledge
1 × $31.00
Road to consistent profits (Dec 2022) with Jarrod Goodwin - Trading Halls of Knowledge
1 × $31.00 -
×
 News Profiteer System Manual & Members Area Videos with Henry Liu
1 × $6.00
News Profiteer System Manual & Members Area Videos with Henry Liu
1 × $6.00 -
×
 One Shot One Kill Trading with John Netto
1 × $6.00
One Shot One Kill Trading with John Netto
1 × $6.00 -
×
 The Option Trader Handbook. Strategies and Trade Adjustments with George Jabbour
1 × $6.00
The Option Trader Handbook. Strategies and Trade Adjustments with George Jabbour
1 × $6.00 -
×
 Active Investing courses notes with Alan Hull
1 × $6.00
Active Investing courses notes with Alan Hull
1 × $6.00 -
×
 5 Technical Signals You Should Not Trade Without (4 CDs) with Toni Hansen
1 × $6.00
5 Technical Signals You Should Not Trade Without (4 CDs) with Toni Hansen
1 × $6.00 -
×
 FOREX TRADING: Beginner's Course To Becoming A Top Trader with Karen Foo
1 × $6.00
FOREX TRADING: Beginner's Course To Becoming A Top Trader with Karen Foo
1 × $6.00 -
×
 Stable Adaptive Control for Nonlinear Systems with Jeffrey Spooner
1 × $6.00
Stable Adaptive Control for Nonlinear Systems with Jeffrey Spooner
1 × $6.00 -
×
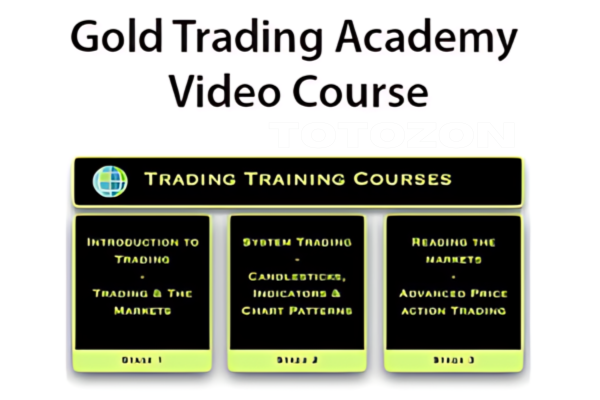 Gold Trading Academy Video Course
1 × $23.00
Gold Trading Academy Video Course
1 × $23.00 -
×
 Day Trading Smart Right From the Start: Trading Essentials for Maximum Results - David Nassar & John Boyer
1 × $6.00
Day Trading Smart Right From the Start: Trading Essentials for Maximum Results - David Nassar & John Boyer
1 × $6.00 -
×
 Day One Trader with John Sussex
1 × $6.00
Day One Trader with John Sussex
1 × $6.00 -
×
 Month 01 to 08 2018
1 × $62.00
Month 01 to 08 2018
1 × $62.00 -
×
 The Python for Traders Masterclass with Mr James
1 × $10.00
The Python for Traders Masterclass with Mr James
1 × $10.00 -
×
 Euro Error with Jean-Jacques Rosa
1 × $6.00
Euro Error with Jean-Jacques Rosa
1 × $6.00 -
×
 Investing Under Fire with Alan R.Ackerman
1 × $6.00
Investing Under Fire with Alan R.Ackerman
1 × $6.00 -
×
 How to Trade Forex & Cryptocurrency with Bitraged
1 × $5.00
How to Trade Forex & Cryptocurrency with Bitraged
1 × $5.00 -
×
 Vertex Investing Course
1 × $6.00
Vertex Investing Course
1 × $6.00 -
×
 Mastering Risk Modeling with Excel by Alastair Day
1 × $6.00
Mastering Risk Modeling with Excel by Alastair Day
1 × $6.00 -
×
 White Phoenix’s The Smart (Money) Approach to Trading with Jayson Casper
1 × $39.00
White Phoenix’s The Smart (Money) Approach to Trading with Jayson Casper
1 × $39.00 -
×
 How to Trade Diagonal Triangles. Superior Risk Reward Trade Setups
1 × $6.00
How to Trade Diagonal Triangles. Superior Risk Reward Trade Setups
1 × $6.00 -
×
 TRADING NFX Course with Andrew NFX
1 × $5.00
TRADING NFX Course with Andrew NFX
1 × $5.00 -
×
 Introduction to Macro Investing with Mike Singleton
1 × $31.00
Introduction to Macro Investing with Mike Singleton
1 × $31.00 -
×
 TenfoldFX Academy Course with Kenneth John
1 × $17.00
TenfoldFX Academy Course with Kenneth John
1 × $17.00 -
×
 Shawn Sharma Mentorship Program
1 × $34.00
Shawn Sharma Mentorship Program
1 × $34.00 -
×
 Fisher Investments on Telecom with Dan Sinton, Andrew S.Teufel
1 × $6.00
Fisher Investments on Telecom with Dan Sinton, Andrew S.Teufel
1 × $6.00 -
×
 W. D Gann 's Square Of 9 Applied To Modern Markets with Sean Avidar - Hexatrade350
1 × $23.00
W. D Gann 's Square Of 9 Applied To Modern Markets with Sean Avidar - Hexatrade350
1 × $23.00 -
×
 The City Traders Course with Andrew Lockwood
1 × $10.00
The City Traders Course with Andrew Lockwood
1 × $10.00 -
×
 Master Trader - Advander Management Strategies
1 × $39.00
Master Trader - Advander Management Strategies
1 × $39.00 -
×
 Annual Forecast Reports - Forecast 2023 with Larry Williams
1 × $8.00
Annual Forecast Reports - Forecast 2023 with Larry Williams
1 × $8.00 -
×
 How to Manage a $25,000 Portfolio with Dan Sheridan - Sheridan Options Mentoring
1 × $6.00
How to Manage a $25,000 Portfolio with Dan Sheridan - Sheridan Options Mentoring
1 × $6.00 -
×
 Four Dimensional Stock Market Structures & Cycles with Bradley Cowan
1 × $6.00
Four Dimensional Stock Market Structures & Cycles with Bradley Cowan
1 × $6.00 -
×
 Essential Stock Picking Strategies with Daniel Strachman
1 × $6.00
Essential Stock Picking Strategies with Daniel Strachman
1 × $6.00 -
×
 Order flow self-study training program with iMFtracker
1 × $10.00
Order flow self-study training program with iMFtracker
1 × $10.00
 with Arthur A.Hill")
Introduction to Candlestick (Article) with Arthur A.Hill
$6.00
File Size: Coming soon!
Delivery Time: 1–12 hours
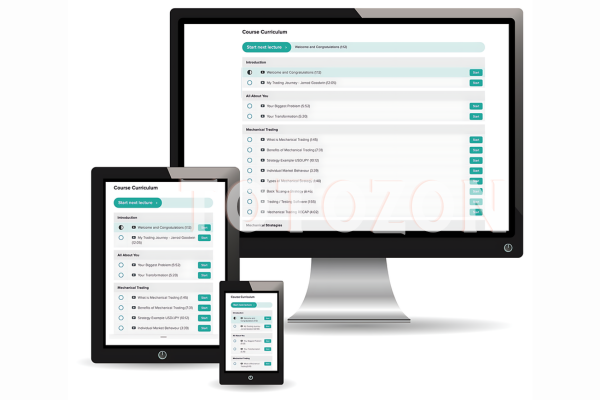
Media Type: Online Course
Content Proof: Watch Here!
You may check content proof of “Introduction to Candlestick (Article) with Arthur A.Hill” below:
 with Arthur A.Hill")
Introduction to Candlestick (Article) with Arthur A. Hill
Candlestick charting is an essential tool for traders and investors, providing a visual representation of price movements. Arthur A. Hill, a renowned expert in technical analysis, offers a comprehensive introduction to candlestick charts, making them accessible to beginners and valuable for experienced traders. Let’s explore the basics of candlestick charting and how it can enhance your trading strategy.
What is a Candlestick Chart?
A candlestick chart is a type of financial chart used to describe price movements of a security, derivative, or currency.
Components of a Candlestick
- Body: The thick part of the candlestick, showing the opening and closing prices.
- Wicks/Shadows: The thin lines above and below the body, indicating the highest and lowest prices during the period.
- Color: Traditionally, a green or white body indicates a closing price higher than the opening price, while a red or black body indicates a closing price lower than the opening price.
History of Candlestick Charting
Candlestick charting originated in Japan over 300 years ago, developed by rice traders to track market prices and daily supply and demand.
Evolution of Candlestick Charts
Over the centuries, candlestick charting has evolved and gained popularity worldwide, becoming a staple in technical analysis.
Introduction to Western Markets
Candlestick charts were introduced to the Western financial markets in the late 20th century and quickly became popular among traders.
Advantages of Candlestick Charts
Candlestick charts offer several advantages over traditional bar charts and line charts.
Visual Clarity
Candlestick charts provide a clear and concise representation of price movements, making it easier to interpret market trends.
Immediate Insight
The color-coded bodies and wicks offer immediate insight into market sentiment and price direction.
Pattern Recognition
Candlestick charts are excellent for identifying patterns that can predict future price movements.
Common Candlestick Patterns
- Doji: Indicates indecision in the market.
- Hammer: Suggests a potential reversal from a downtrend.
- Engulfing: A strong signal of a potential trend reversal.
Basic Candlestick Patterns
Understanding basic candlestick patterns is crucial for any trader looking to use this charting method effectively.
Bullish Patterns
Bullish patterns indicate potential upward price movements.
Hammer and Inverted Hammer
- Hammer: A candlestick with a small body and a long lower wick, indicating potential reversal from a downtrend.
- Inverted Hammer: Similar to the hammer but with a long upper wick, suggesting a potential bullish reversal.
Bearish Patterns
Bearish patterns suggest potential downward price movements.
Shooting Star and Hanging Man
- Shooting Star: A candlestick with a small body and a long upper wick, indicating a potential reversal from an uptrend.
- Hanging Man: Similar to the hammer but occurs after an uptrend, signaling a potential bearish reversal.
Advanced Candlestick Patterns
For more experienced traders, advanced candlestick patterns provide deeper insights into market trends.
Engulfing Patterns
Engulfing patterns occur when a smaller candlestick is followed by a larger candlestick that completely engulfs the smaller one.
Bullish Engulfing
A bullish engulfing pattern occurs at the bottom of a downtrend and signals a potential upward reversal.
Bearish Engulfing
A bearish engulfing pattern appears at the top of an uptrend and suggests a potential downward reversal.
Morning Star and Evening Star
These patterns are three-candlestick formations that indicate strong trend reversals.
Morning Star
The morning star pattern consists of a bearish candle, a small indecisive candle, and a bullish candle, indicating a bullish reversal.
Evening Star
The evening star pattern includes a bullish candle, a small indecisive candle, and a bearish candle, suggesting a bearish reversal.
Incorporating Candlestick Charts into Your Trading Strategy
Candlestick charts are versatile and can be integrated into various trading strategies.
Combining with Other Indicators
Enhance the effectiveness of candlestick charts by combining them with other technical indicators.
Popular Indicators to Combine
- Moving Averages: Confirm trends and potential reversals.
- Relative Strength Index (RSI): Identify overbought or oversold conditions.
- Bollinger Bands: Measure market volatility and potential breakouts.
Setting Up Your Trading Platform
Most trading platforms offer candlestick charting options. Ensure you customize your charts to suit your trading style.
Customization Tips
- Time Frames: Choose appropriate time frames for your trading strategy.
- Color Schemes: Use distinct colors for bullish and bearish candles.
- Indicators: Add complementary indicators to your charts.
Common Mistakes to Avoid
Even with a robust understanding of candlestick charts, traders can make mistakes that affect their performance.
Over-reliance on Patterns
Relying solely on candlestick patterns without considering other factors can lead to false signals.
Diversify Analysis
Always use candlestick patterns in conjunction with other forms of analysis and market indicators.
Ignoring Market Context
Candlestick patterns can be misleading if not considered within the broader market context.
Comprehensive Analysis
Incorporate fundamental analysis and overall market trends to validate candlestick signals.
Conclusion
Candlestick charting, as introduced by Arthur A. Hill, offers a powerful tool for traders to understand and predict market movements. By mastering basic and advanced patterns, combining them with other technical indicators, and avoiding common pitfalls, traders can enhance their market analysis and trading performance. Whether you’re new to trading or an experienced trader, candlestick charts provide valuable insights that can guide your investment decisions.
Frequently Asked Questions:
- What is a candlestick chart?
A candlestick chart is a type of financial chart used to represent price movements over a specific period, showing the opening, closing, high, and low prices. - Why are candlestick charts popular among traders?
They provide visual clarity and help in identifying patterns that can predict future price movements. - What are some basic candlestick patterns?
Basic patterns include the hammer, inverted hammer, shooting star, and hanging man, which indicate potential market reversals. - Can candlestick charts be used with other technical indicators?
Yes, combining candlestick charts with indicators like moving averages, RSI, and Bollinger Bands enhances their effectiveness. - How can I avoid common mistakes when using candlestick charts?
Avoid over-relying on patterns and always consider the broader market context and other forms of analysis.
Be the first to review “Introduction to Candlestick (Article) with Arthur A.Hill”
You must be logged in to post a review.
Related products

Original price was: $997.00.$13.00Current price is: $13.00.

Original price was: $1,849.00.$15.00Current price is: $15.00.

Forex Trading
Original price was: $125.00.$17.00Current price is: $17.00.

Forex Trading
Original price was: $850.00.$23.00Current price is: $23.00.

Forex Trading
Quantamentals – The Next Great Forefront Of Trading and Investing with Trading Markets
Original price was: $1,495.00.$8.00Current price is: $8.00.
Forex Trading
Original price was: $1,898.00.$10.00Current price is: $10.00.

Forex Trading
Original price was: $550.00.$5.00Current price is: $5.00.

Original price was: $4,995.00.$15.00Current price is: $15.00.

Original price was: $310.00.$23.00Current price is: $23.00.

Original price was: $997.00.$8.00Current price is: $8.00.

Original price was: $999.00.$5.00Current price is: $5.00.
Original price was: $450.00.$23.00Current price is: $23.00.

Original price was: $1,200.00.$23.00Current price is: $23.00.
Forex Trading
Original price was: $397.00.$31.00Current price is: $31.00.

Original price was: $1,800.00.$54.00Current price is: $54.00.
Original price was: $700.00.$39.00Current price is: $39.00.

Forex Trading
Original price was: $697.00.$5.00Current price is: $5.00.

Forex Trading
Original price was: $499.00.$15.00Current price is: $15.00.

Forex Trading
Original price was: $2,995.00.$31.00Current price is: $31.00.

Original price was: $895.00.$15.00Current price is: $15.00.

Reviews
There are no reviews yet.