-
×
 Super Conference 2020 - Premier Coaching Package with Vince Vora
1 × $109.00
Super Conference 2020 - Premier Coaching Package with Vince Vora
1 × $109.00 -
×
 Opening Bell Income Strategy with Todd Mitchell
1 × $54.00
Opening Bell Income Strategy with Todd Mitchell
1 × $54.00 -
×
 TOP Gamma Bundle with TopTrade Tools
1 × $69.00
TOP Gamma Bundle with TopTrade Tools
1 × $69.00 -
×
 Artificial Neural Networks Technology with Dave Anderson, George McNeill
1 × $6.00
Artificial Neural Networks Technology with Dave Anderson, George McNeill
1 × $6.00 -
×
 Using Options to Buy Stocks: Build Wealth with Little Risk and No Capital - Dennis Eisen
1 × $4.00
Using Options to Buy Stocks: Build Wealth with Little Risk and No Capital - Dennis Eisen
1 × $4.00 -
×
 Candlestick Charting Explained with Greg Morris
1 × $8.00
Candlestick Charting Explained with Greg Morris
1 × $8.00 -
×
 Exploiting Volatility: Mastering Equity and Index Options with David Lerman
1 × $6.00
Exploiting Volatility: Mastering Equity and Index Options with David Lerman
1 × $6.00 -
×
 Workshop Earnings Powerplay with Base Camp Trading
1 × $17.00
Workshop Earnings Powerplay with Base Camp Trading
1 × $17.00 -
×
 Daytraders Bulletin – Recurrent Structures for Profit with Charles Holt
1 × $6.00
Daytraders Bulletin – Recurrent Structures for Profit with Charles Holt
1 × $6.00 -
×
 Investment Blunders with John Nofsinger
1 × $6.00
Investment Blunders with John Nofsinger
1 × $6.00 -
×
 Trading Using Ocean Theory with Pat Raffolovich
1 × $4.00
Trading Using Ocean Theory with Pat Raffolovich
1 × $4.00 -
×
 Use the News with Maria Bartiromo
1 × $6.00
Use the News with Maria Bartiromo
1 × $6.00 -
×
 90 Days To Trade MasterClass with Jerremy Newsome & Matt Delong - Real Life Trading
1 × $104.00
90 Days To Trade MasterClass with Jerremy Newsome & Matt Delong - Real Life Trading
1 × $104.00 -
×
 Naked Put Selling Acquiring Blue Chip Stocks and Creating Cash Flow with Lee Lowell
1 × $6.00
Naked Put Selling Acquiring Blue Chip Stocks and Creating Cash Flow with Lee Lowell
1 × $6.00 -
×
 AstroFibonacci 7.3722 magisociety
1 × $6.00
AstroFibonacci 7.3722 magisociety
1 × $6.00 -
×
 Bullseye Trading Course with Ralph Garcia
1 × $39.00
Bullseye Trading Course with Ralph Garcia
1 × $39.00 -
×
 Channel Analysis. The Key to Improved Timing of Trades with Brian J.Millard
1 × $6.00
Channel Analysis. The Key to Improved Timing of Trades with Brian J.Millard
1 × $6.00 -
×
 Trading Without Gambling with Marcel Link
1 × $6.00
Trading Without Gambling with Marcel Link
1 × $6.00 -
×
 Price Action and Orderflow Course with Young Tilopa
1 × $17.00
Price Action and Orderflow Course with Young Tilopa
1 × $17.00 -
×
 Be Smart, Act Fast, Get Rich with Charles Payne
1 × $6.00
Be Smart, Act Fast, Get Rich with Charles Payne
1 × $6.00 -
×
 Pattern Trader Pro with ForexStore
1 × $6.00
Pattern Trader Pro with ForexStore
1 × $6.00 -
×
 Rockwell Trading - Money Management - 2 DVDs
1 × $6.00
Rockwell Trading - Money Management - 2 DVDs
1 × $6.00 -
×
 Amibroker CBT Intensive Course with Matt Radtke
1 × $31.00
Amibroker CBT Intensive Course with Matt Radtke
1 × $31.00 -
×
 The TradingKey - Mastering Elliott Wave by Rob Roy 2010 + Complete Workbooks with HUBB Financial
1 × $6.00
The TradingKey - Mastering Elliott Wave by Rob Roy 2010 + Complete Workbooks with HUBB Financial
1 × $6.00 -
×
 Advanced Price Action Course with Chris Capre
1 × $7.00
Advanced Price Action Course with Chris Capre
1 × $7.00 -
×
 SQX Mentorship with Tip Toe Hippo
1 × $23.00
SQX Mentorship with Tip Toe Hippo
1 × $23.00 -
×
 How to Make the Stock Market Make Money For You with Ted Warren
1 × $6.00
How to Make the Stock Market Make Money For You with Ted Warren
1 × $6.00 -
×
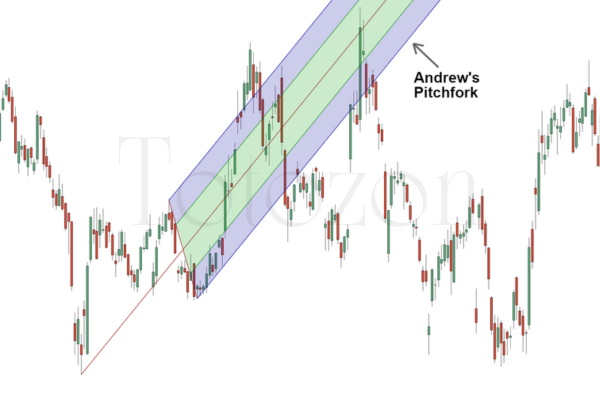 Andrews Pitchfork Basic
1 × $6.00
Andrews Pitchfork Basic
1 × $6.00 -
×
 The Orderflows Trade Opportunities Encyclopedia with Michael Valtos
1 × $8.00
The Orderflows Trade Opportunities Encyclopedia with Michael Valtos
1 × $8.00 -
×
 ChartEngineers Course
1 × $5.00
ChartEngineers Course
1 × $5.00 -
×
 The Orderflow Masterclass with PrimeTrading
1 × $17.00
The Orderflow Masterclass with PrimeTrading
1 × $17.00 -
×
 The Indices Orderflow Masterclass with The Forex Scalpers
1 × $23.00
The Indices Orderflow Masterclass with The Forex Scalpers
1 × $23.00 -
×
 Dynamic Trader 6 Dynamic Trader Real Time and End Of Day
1 × $6.00
Dynamic Trader 6 Dynamic Trader Real Time and End Of Day
1 × $6.00 -
×
 CFA Level 1 – PassMaster 2004 CD with Stalla
1 × $6.00
CFA Level 1 – PassMaster 2004 CD with Stalla
1 × $6.00 -
×
 AI For Traders with Trading Markets
1 × $31.00
AI For Traders with Trading Markets
1 × $31.00 -
×
 Timing Solution Terra Incognita Edition Build 24 (timingsolution.com)
1 × $6.00
Timing Solution Terra Incognita Edition Build 24 (timingsolution.com)
1 × $6.00 -
×
 Smart Money Trading Course with Prosperity Academy
1 × $5.00
Smart Money Trading Course with Prosperity Academy
1 × $5.00 -
×
 ValueSpace. Winning the Battle for Market Leadership with Banwari Mittal, Jagdish N.Sheth
1 × $6.00
ValueSpace. Winning the Battle for Market Leadership with Banwari Mittal, Jagdish N.Sheth
1 × $6.00 -
×
 Classic Trading Tactics Theory and Practice with Linda Raschke
1 × $13.00
Classic Trading Tactics Theory and Practice with Linda Raschke
1 × $13.00 -
×
 Consistently Profitable Trader with Pollinate Trading
1 × $13.00
Consistently Profitable Trader with Pollinate Trading
1 × $13.00 -
×
 The Investor Accelerator Premium Membership
1 × $34.00
The Investor Accelerator Premium Membership
1 × $34.00 -
×
 Trading with the Gods Fibonacci Series with Alan Oliver
1 × $6.00
Trading with the Gods Fibonacci Series with Alan Oliver
1 × $6.00 -
×
 The New Goldrush Of 2021 with Keith Dougherty
1 × $46.00
The New Goldrush Of 2021 with Keith Dougherty
1 × $46.00 -
×
 Profit Power Seminar
1 × $23.00
Profit Power Seminar
1 × $23.00 -
×
 eASCTrend Traning CD. Hybrid Trading Method with Ablesys
1 × $6.00
eASCTrend Traning CD. Hybrid Trading Method with Ablesys
1 × $6.00 -
×
 Advanced Fibonacci Course with Major League Trading
1 × $23.00
Advanced Fibonacci Course with Major League Trading
1 × $23.00 -
×
 Options Trading & Ultimate MasterClass With Tyrone Abela - FX Evolution
1 × $54.00
Options Trading & Ultimate MasterClass With Tyrone Abela - FX Evolution
1 × $54.00 -
×
 Equity Research and Valuation Techniques with Kemp Dolliver
1 × $6.00
Equity Research and Valuation Techniques with Kemp Dolliver
1 × $6.00 -
×
 Ultimate Options with Andy Tanner & Corey Halliday - The Cashflow Academy
1 × $139.00
Ultimate Options with Andy Tanner & Corey Halliday - The Cashflow Academy
1 × $139.00 -
×
 The New Science of Asset Allocation with Thomas Schneeweis
1 × $6.00
The New Science of Asset Allocation with Thomas Schneeweis
1 × $6.00 -
×
 F.A.M.E. Home Study Course with Doug Sutton
1 × $6.00
F.A.M.E. Home Study Course with Doug Sutton
1 × $6.00 -
×
 Hawkeye Indicators for eSignal + Manual (janarps.com)
1 × $6.00
Hawkeye Indicators for eSignal + Manual (janarps.com)
1 × $6.00 -
×
 Original Curriculum with Home Options Trading Course
1 × $6.00
Original Curriculum with Home Options Trading Course
1 × $6.00 -
×
 How I Trade Major First-Hour Reversals For Rapid Gains with Kevin Haggerty
1 × $6.00
How I Trade Major First-Hour Reversals For Rapid Gains with Kevin Haggerty
1 × $6.00 -
×
 The Best of the Professional Traders Journal. Market Timing with Larry Connors
1 × $6.00
The Best of the Professional Traders Journal. Market Timing with Larry Connors
1 × $6.00 -
×
 Pine Script Mastery Course with Matthew Slabosz
1 × $5.00
Pine Script Mastery Course with Matthew Slabosz
1 × $5.00 -
×
 FX At One Glance - Ichimoku Advanced Japanese Techniques
1 × $15.00
FX At One Glance - Ichimoku Advanced Japanese Techniques
1 × $15.00 -
×
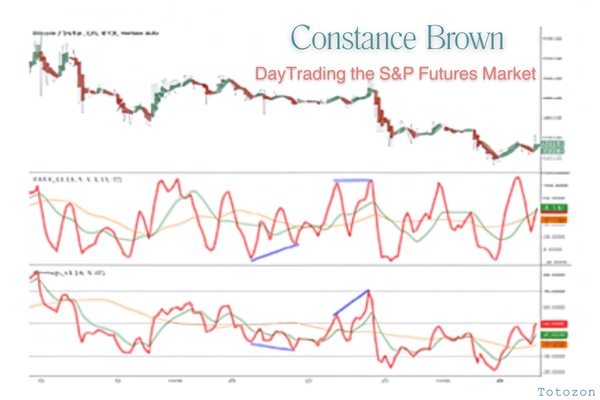 DayTrading the S&P Futures Market with Constance Brown
1 × $6.00
DayTrading the S&P Futures Market with Constance Brown
1 × $6.00 -
×
 Forex & Fibonacci Day Trading Seminar - $695
1 × $6.00
Forex & Fibonacci Day Trading Seminar - $695
1 × $6.00 -
×
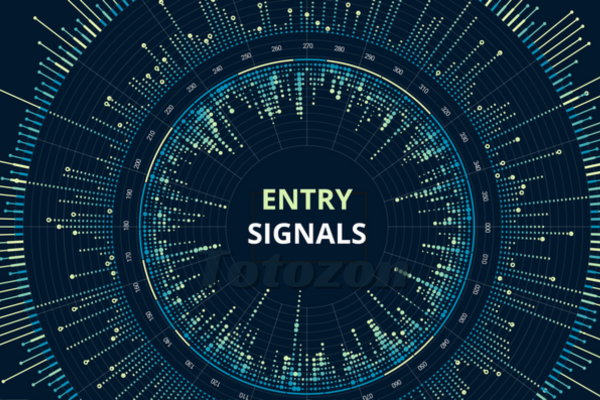 Analysis Of Entry Signals (Technicals) with Joe Marwood
1 × $15.00
Analysis Of Entry Signals (Technicals) with Joe Marwood
1 × $15.00 -
×
 Staying Out of Trouble Trading Currency with Channels - Barbara Rockefeller
1 × $6.00
Staying Out of Trouble Trading Currency with Channels - Barbara Rockefeller
1 × $6.00 -
×
 Mindover Markets Enhanced: The Intensive Series 2 with Jim Dalton
1 × $20.00
Mindover Markets Enhanced: The Intensive Series 2 with Jim Dalton
1 × $20.00 -
×
 Capital On Demand Masterclass with Attorney & Nate Dodson
1 × $311.00
Capital On Demand Masterclass with Attorney & Nate Dodson
1 × $311.00 -
×
 Introduction to Probability with Charles M.Grinstead, J.Laurie Snell
1 × $6.00
Introduction to Probability with Charles M.Grinstead, J.Laurie Snell
1 × $6.00 -
×
 The Logical Trader: Applying a Method to the Madness with Mark Fisher
1 × $6.00
The Logical Trader: Applying a Method to the Madness with Mark Fisher
1 × $6.00 -
×
 Advance Courses for Members
1 × $15.00
Advance Courses for Members
1 × $15.00 -
×
 Commodity Spreads: Techniques and Methods for Spreading Financial Futures, Grains, Meats & Other Commodities with Courtney Smith
1 × $6.00
Commodity Spreads: Techniques and Methods for Spreading Financial Futures, Grains, Meats & Other Commodities with Courtney Smith
1 × $6.00 -
×
 Quantamentals - The Next Great Forefront Of Trading and Investing with Trading Markets
1 × $8.00
Quantamentals - The Next Great Forefront Of Trading and Investing with Trading Markets
1 × $8.00 -
×
 Scalp Strategy and Flipping Small Accounts with Opes Trading Group
1 × $5.00
Scalp Strategy and Flipping Small Accounts with Opes Trading Group
1 × $5.00 -
×
 Pristine - Noble DraKoln – The Complete Liverpool Futures Seminar Series
1 × $6.00
Pristine - Noble DraKoln – The Complete Liverpool Futures Seminar Series
1 × $6.00 -
×
 The Afluent Desktop Currency Trader with Amin Sadak
1 × $6.00
The Afluent Desktop Currency Trader with Amin Sadak
1 × $6.00 -
×
 Live Online Masterclass with XSPY Trader
1 × $5.00
Live Online Masterclass with XSPY Trader
1 × $5.00 -
×
 Chaos. The New Map for Traders
1 × $15.00
Chaos. The New Map for Traders
1 × $15.00 -
×
 Simple Profit Trading System 2020
1 × $54.00
Simple Profit Trading System 2020
1 × $54.00 -
×
 VagaFX Academy Course with VAGAFX
1 × $41.00
VagaFX Academy Course with VAGAFX
1 × $41.00 -
×
 TenfoldFX Academy Course with Kenneth John
1 × $17.00
TenfoldFX Academy Course with Kenneth John
1 × $17.00 -
×
 W. D Gann 's Square Of 9 Applied To Modern Markets with Sean Avidar - Hexatrade350
1 × $23.00
W. D Gann 's Square Of 9 Applied To Modern Markets with Sean Avidar - Hexatrade350
1 × $23.00 -
×
 Ultimate Trading Course with Dodgy's Dungeon
1 × $8.00
Ultimate Trading Course with Dodgy's Dungeon
1 × $8.00 -
×
 The Superstock Investor with Charles LaLoggia
1 × $6.00
The Superstock Investor with Charles LaLoggia
1 × $6.00 -
×
 ETF Sector Plus Strategy (Course Only) with MarketGauge
1 × $62.00
ETF Sector Plus Strategy (Course Only) with MarketGauge
1 × $62.00 -
×
 Bond Market Course with The Macro Compass
1 × $15.00
Bond Market Course with The Macro Compass
1 × $15.00 -
×
 Scalp Trading Mini Course with Jayson Casper
1 × $23.00
Scalp Trading Mini Course with Jayson Casper
1 × $23.00 -
×
 James Dalton Mind Over Markets Expanded Intensive Series 2018
1 × $6.00
James Dalton Mind Over Markets Expanded Intensive Series 2018
1 × $6.00 -
×
 Option Buying Course
1 × $5.00
Option Buying Course
1 × $5.00 -
×
 ICT Trading Models with The Prop Trader
1 × $5.00
ICT Trading Models with The Prop Trader
1 × $5.00 -
×
 6 (The Proper BackGround)
1 × $6.00
6 (The Proper BackGround)
1 × $6.00 -
×
 FX Funding Mate Course
1 × $5.00
FX Funding Mate Course
1 × $5.00 -
×
 How to Use Gann Techniques to Implement a Trading System
1 × $6.00
How to Use Gann Techniques to Implement a Trading System
1 × $6.00 -
×
 Order flow self-study training program with iMFtracker
1 × $10.00
Order flow self-study training program with iMFtracker
1 × $10.00
 with Arthur A.Hill")
Introduction to Candlestick (Article) with Arthur A.Hill
$6.00
File Size: Coming soon!
Delivery Time: 1–12 hours
Media Type: Online Course
Content Proof: Watch Here!
You may check content proof of “Introduction to Candlestick (Article) with Arthur A.Hill” below:
 with Arthur A.Hill")
Introduction to Candlestick (Article) with Arthur A. Hill
Candlestick charting is an essential tool for traders and investors, providing a visual representation of price movements. Arthur A. Hill, a renowned expert in technical analysis, offers a comprehensive introduction to candlestick charts, making them accessible to beginners and valuable for experienced traders. Let’s explore the basics of candlestick charting and how it can enhance your trading strategy.
What is a Candlestick Chart?
A candlestick chart is a type of financial chart used to describe price movements of a security, derivative, or currency.
Components of a Candlestick
- Body: The thick part of the candlestick, showing the opening and closing prices.
- Wicks/Shadows: The thin lines above and below the body, indicating the highest and lowest prices during the period.
- Color: Traditionally, a green or white body indicates a closing price higher than the opening price, while a red or black body indicates a closing price lower than the opening price.
History of Candlestick Charting
Candlestick charting originated in Japan over 300 years ago, developed by rice traders to track market prices and daily supply and demand.
Evolution of Candlestick Charts
Over the centuries, candlestick charting has evolved and gained popularity worldwide, becoming a staple in technical analysis.
Introduction to Western Markets
Candlestick charts were introduced to the Western financial markets in the late 20th century and quickly became popular among traders.
Advantages of Candlestick Charts
Candlestick charts offer several advantages over traditional bar charts and line charts.
Visual Clarity
Candlestick charts provide a clear and concise representation of price movements, making it easier to interpret market trends.
Immediate Insight
The color-coded bodies and wicks offer immediate insight into market sentiment and price direction.
Pattern Recognition
Candlestick charts are excellent for identifying patterns that can predict future price movements.
Common Candlestick Patterns
- Doji: Indicates indecision in the market.
- Hammer: Suggests a potential reversal from a downtrend.
- Engulfing: A strong signal of a potential trend reversal.
Basic Candlestick Patterns
Understanding basic candlestick patterns is crucial for any trader looking to use this charting method effectively.
Bullish Patterns
Bullish patterns indicate potential upward price movements.
Hammer and Inverted Hammer
- Hammer: A candlestick with a small body and a long lower wick, indicating potential reversal from a downtrend.
- Inverted Hammer: Similar to the hammer but with a long upper wick, suggesting a potential bullish reversal.
Bearish Patterns
Bearish patterns suggest potential downward price movements.
Shooting Star and Hanging Man
- Shooting Star: A candlestick with a small body and a long upper wick, indicating a potential reversal from an uptrend.
- Hanging Man: Similar to the hammer but occurs after an uptrend, signaling a potential bearish reversal.
Advanced Candlestick Patterns
For more experienced traders, advanced candlestick patterns provide deeper insights into market trends.
Engulfing Patterns
Engulfing patterns occur when a smaller candlestick is followed by a larger candlestick that completely engulfs the smaller one.
Bullish Engulfing
A bullish engulfing pattern occurs at the bottom of a downtrend and signals a potential upward reversal.
Bearish Engulfing
A bearish engulfing pattern appears at the top of an uptrend and suggests a potential downward reversal.
Morning Star and Evening Star
These patterns are three-candlestick formations that indicate strong trend reversals.
Morning Star
The morning star pattern consists of a bearish candle, a small indecisive candle, and a bullish candle, indicating a bullish reversal.
Evening Star
The evening star pattern includes a bullish candle, a small indecisive candle, and a bearish candle, suggesting a bearish reversal.
Incorporating Candlestick Charts into Your Trading Strategy
Candlestick charts are versatile and can be integrated into various trading strategies.
Combining with Other Indicators
Enhance the effectiveness of candlestick charts by combining them with other technical indicators.
Popular Indicators to Combine
- Moving Averages: Confirm trends and potential reversals.
- Relative Strength Index (RSI): Identify overbought or oversold conditions.
- Bollinger Bands: Measure market volatility and potential breakouts.
Setting Up Your Trading Platform
Most trading platforms offer candlestick charting options. Ensure you customize your charts to suit your trading style.
Customization Tips
- Time Frames: Choose appropriate time frames for your trading strategy.
- Color Schemes: Use distinct colors for bullish and bearish candles.
- Indicators: Add complementary indicators to your charts.
Common Mistakes to Avoid
Even with a robust understanding of candlestick charts, traders can make mistakes that affect their performance.
Over-reliance on Patterns
Relying solely on candlestick patterns without considering other factors can lead to false signals.
Diversify Analysis
Always use candlestick patterns in conjunction with other forms of analysis and market indicators.
Ignoring Market Context
Candlestick patterns can be misleading if not considered within the broader market context.
Comprehensive Analysis
Incorporate fundamental analysis and overall market trends to validate candlestick signals.
Conclusion
Candlestick charting, as introduced by Arthur A. Hill, offers a powerful tool for traders to understand and predict market movements. By mastering basic and advanced patterns, combining them with other technical indicators, and avoiding common pitfalls, traders can enhance their market analysis and trading performance. Whether you’re new to trading or an experienced trader, candlestick charts provide valuable insights that can guide your investment decisions.
Frequently Asked Questions:
- What is a candlestick chart?
A candlestick chart is a type of financial chart used to represent price movements over a specific period, showing the opening, closing, high, and low prices. - Why are candlestick charts popular among traders?
They provide visual clarity and help in identifying patterns that can predict future price movements. - What are some basic candlestick patterns?
Basic patterns include the hammer, inverted hammer, shooting star, and hanging man, which indicate potential market reversals. - Can candlestick charts be used with other technical indicators?
Yes, combining candlestick charts with indicators like moving averages, RSI, and Bollinger Bands enhances their effectiveness. - How can I avoid common mistakes when using candlestick charts?
Avoid over-relying on patterns and always consider the broader market context and other forms of analysis.
Be the first to review “Introduction to Candlestick (Article) with Arthur A.Hill”
You must be logged in to post a review.
Related products
Forex Trading
Original price was: $499.00.$15.00Current price is: $15.00.
Forex Trading
Original price was: $1,898.00.$10.00Current price is: $10.00.

Forex Trading
Original price was: $799.00.$15.00Current price is: $15.00.
Original price was: $999.00.$5.00Current price is: $5.00.

Forex Trading
Original price was: $2,000.00.$23.00Current price is: $23.00.
Original price was: $1,800.00.$54.00Current price is: $54.00.

Original price was: $799.00.$15.00Current price is: $15.00.

Forex Trading
The Complete Guide to Multiple Time Frame Analysis & Reading Price Action with Aiman Almansoori
Original price was: $1,399.00.$13.00Current price is: $13.00.

Forex Trading
Original price was: $850.00.$23.00Current price is: $23.00.

Forex Trading
Original price was: $1,098.00.$39.00Current price is: $39.00.
Forex Trading
Original price was: $2,995.00.$31.00Current price is: $31.00.

Original price was: $700.00.$39.00Current price is: $39.00.

Forex Trading
Original price was: $999.00.$15.00Current price is: $15.00.
Original price was: $299.00.$8.00Current price is: $8.00.

Original price was: $197.00.$5.00Current price is: $5.00.
Forex Trading
Original price was: $2,997.00.$23.00Current price is: $23.00.

Original price was: $2,120.00.$15.00Current price is: $15.00.

Original price was: $1,200.00.$23.00Current price is: $23.00.

Forex Trading
Original price was: $500.00.$5.00Current price is: $5.00.

Original price was: $4,995.00.$15.00Current price is: $15.00.

Reviews
There are no reviews yet.