-
×
 0 DTE Options Trading Workshop with Aeromir Corporation
1 × $15.00
0 DTE Options Trading Workshop with Aeromir Corporation
1 × $15.00 -
×
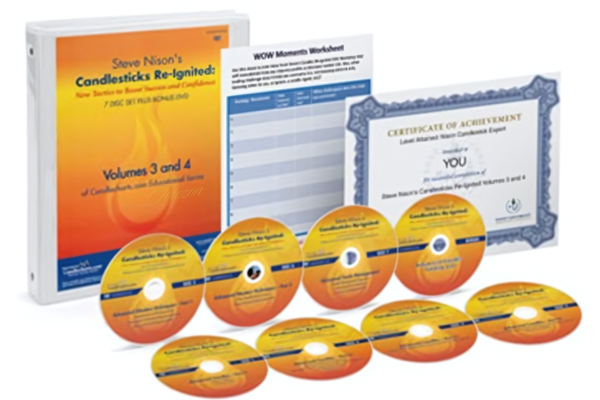 Candlesticks Re-Ignited Workshop
1 × $23.00
Candlesticks Re-Ignited Workshop
1 × $23.00 -
×
 Butterfly and Condor Workshop with Aeromir
1 × $15.00
Butterfly and Condor Workshop with Aeromir
1 × $15.00 -
×
 High Probability Trading Using Elliott Wave And Fibonacci Analysis withVic Patel - Forex Training Group
1 × $10.00
High Probability Trading Using Elliott Wave And Fibonacci Analysis withVic Patel - Forex Training Group
1 × $10.00 -
×
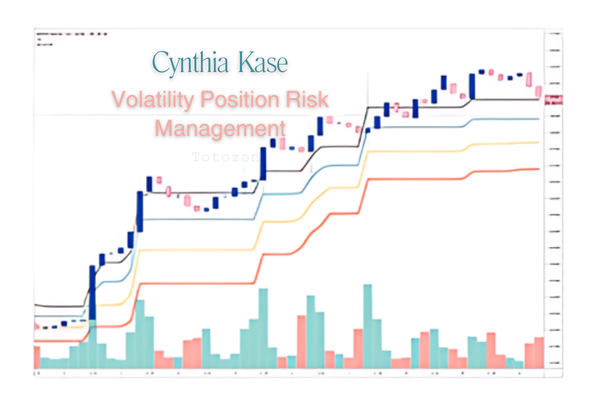 Volatility Position Risk Management with Cynthia Kase
1 × $6.00
Volatility Position Risk Management with Cynthia Kase
1 × $6.00 -
×
 Crystal Ball Pack PLUS bonus Live Trade By Pat Mitchell - Trick Trades
1 × $20.00
Crystal Ball Pack PLUS bonus Live Trade By Pat Mitchell - Trick Trades
1 × $20.00 -
×
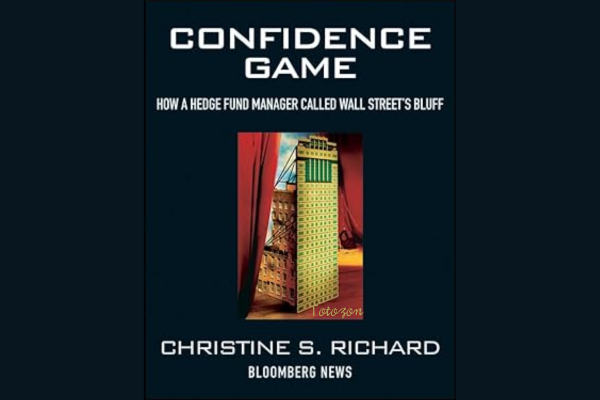 Confidence Game. How a Hadge Fund Manager Called Wall Street’s Bluff with Christine Richard
1 × $6.00
Confidence Game. How a Hadge Fund Manager Called Wall Street’s Bluff with Christine Richard
1 × $6.00 -
×
 Advanced Course with Jtrader
1 × $6.00
Advanced Course with Jtrader
1 × $6.00 -
×
 Candlestick Charts with Clive Lambert
1 × $6.00
Candlestick Charts with Clive Lambert
1 × $6.00 -
×
 Master Trader Technical Strategies with Greg Capra - Master Trader
1 × $5.00
Master Trader Technical Strategies with Greg Capra - Master Trader
1 × $5.00 -
×
 Stock Investing Strategies with Maria Crawford Scott, John Bajkowski
1 × $6.00
Stock Investing Strategies with Maria Crawford Scott, John Bajkowski
1 × $6.00 -
×
 White Phoenix’s The Smart (Money) Approach to Trading with Jayson Casper
1 × $39.00
White Phoenix’s The Smart (Money) Approach to Trading with Jayson Casper
1 × $39.00 -
×
 Five Trading Trends of 2005 with Dan Denning
1 × $6.00
Five Trading Trends of 2005 with Dan Denning
1 × $6.00 -
×
![ACD Method [Video (6 MP4s)] with Mark Fisher](https://www.totozon.com/wp-content/uploads/2024/05/ACD-Method-Video-6-MP4s-with-Mark-Fisher.jpg) ACD Method [Video (6 MP4s)] with Mark Fisher
1 × $6.00
ACD Method [Video (6 MP4s)] with Mark Fisher
1 × $6.00 -
×
 Activedaytrader - Elite Earnings Pusuit
1 × $54.00
Activedaytrader - Elite Earnings Pusuit
1 × $54.00 -
×
 Earnings Engine with Sami Abusaad - T3 Live
1 × $6.00
Earnings Engine with Sami Abusaad - T3 Live
1 × $6.00 -
×
 Trading with Oscillators. Pinpointing Market Extremes with Mark Etzkorn
1 × $6.00
Trading with Oscillators. Pinpointing Market Extremes with Mark Etzkorn
1 × $6.00 -
×
 Algo Trading Masterclass with Ali Casey - StatOasis
1 × $23.00
Algo Trading Masterclass with Ali Casey - StatOasis
1 × $23.00 -
×
 Ahead of the Curve with Joseph Ellis
1 × $6.00
Ahead of the Curve with Joseph Ellis
1 × $6.00 -
×
 Trading Short TermSame Day Trades Sep 2023 with Dan Sheridan & Mark Fenton - Sheridan Options Mentoring
1 × $31.00
Trading Short TermSame Day Trades Sep 2023 with Dan Sheridan & Mark Fenton - Sheridan Options Mentoring
1 × $31.00 -
×
 Candlestick and Pivot Point Trading Triggers with John Person
1 × $6.00
Candlestick and Pivot Point Trading Triggers with John Person
1 × $6.00 -
×
 Mastering Amibroker Formula Language
1 × $15.00
Mastering Amibroker Formula Language
1 × $15.00 -
×
 Forex Trading Advice & Intro to The Natural Flow
1 × $6.00
Forex Trading Advice & Intro to The Natural Flow
1 × $6.00 -
×
 Master Trader - Advander Management Strategies
1 × $39.00
Master Trader - Advander Management Strategies
1 × $39.00 -
×
 The Orderflow Masterclass with PrimeTrading
1 × $17.00
The Orderflow Masterclass with PrimeTrading
1 × $17.00 -
×
 The Best Option Trading Course with David Jaffee - Best Stock Strategy
1 × $15.00
The Best Option Trading Course with David Jaffee - Best Stock Strategy
1 × $15.00 -
×
 Trading for a Living with Alexander Elder
1 × $6.00
Trading for a Living with Alexander Elder
1 × $6.00 -
×
 The Prop Trading Code with Brannigan Barrett - Axia Futures
1 × $23.00
The Prop Trading Code with Brannigan Barrett - Axia Futures
1 × $23.00 -
×
 ICT Prodigy Trading Course – $650K in Payouts with Alex Solignani
1 × $15.00
ICT Prodigy Trading Course – $650K in Payouts with Alex Solignani
1 × $15.00 -
×
 Essentials in Quantitative Trading QT01 By HangukQuant's
1 × $23.00
Essentials in Quantitative Trading QT01 By HangukQuant's
1 × $23.00 -
×
 Swift Trader, Perfecting the Art of DayTrading with Charles Kim
1 × $6.00
Swift Trader, Perfecting the Art of DayTrading with Charles Kim
1 × $6.00 -
×
 Fundamentals Trading
1 × $6.00
Fundamentals Trading
1 × $6.00 -
×
 Setups of a Winning Trader with Gareth Soloway
1 × $521.00
Setups of a Winning Trader with Gareth Soloway
1 × $521.00 -
×
 Geomagnetic Storms & Stock Markets (Article) with Anna Krivelyova, C.Robotti
1 × $6.00
Geomagnetic Storms & Stock Markets (Article) with Anna Krivelyova, C.Robotti
1 × $6.00 -
×
 Advanced Stock Trading Course + Strategies
1 × $15.00
Advanced Stock Trading Course + Strategies
1 × $15.00 -
×
 The Greatest Trade Ever with Gregory Zuckerman
1 × $6.00
The Greatest Trade Ever with Gregory Zuckerman
1 × $6.00 -
×
 Simpler Options - Weekly Butterflies for Income
1 × $6.00
Simpler Options - Weekly Butterflies for Income
1 × $6.00 -
×
 Traders Winning Edge (Presentation) with Adrienne Laris Toghraie
1 × $6.00
Traders Winning Edge (Presentation) with Adrienne Laris Toghraie
1 × $6.00 -
×
 AI For Traders with Trading Markets
1 × $31.00
AI For Traders with Trading Markets
1 × $31.00 -
×
 ProfileTraders - Swing and Price Analysis (May 2014)
1 × $6.00
ProfileTraders - Swing and Price Analysis (May 2014)
1 × $6.00 -
×
 Investing In KLSE Stocks and Futures With Japanese Candlestick with Fred Tam
1 × $6.00
Investing In KLSE Stocks and Futures With Japanese Candlestick with Fred Tam
1 × $6.00 -
×
 Advanced Pattern Recognition with John Cameron
1 × $23.00
Advanced Pattern Recognition with John Cameron
1 × $23.00 -
×
 3-Day Day Trading Seminar Online CD with John Carter & Hubert Senters
1 × $6.00
3-Day Day Trading Seminar Online CD with John Carter & Hubert Senters
1 × $6.00 -
×
 Best of the Best: Collars with Amy Meissner & Scott Ruble
1 × $15.00
Best of the Best: Collars with Amy Meissner & Scott Ruble
1 × $15.00 -
×
 MQ Gravity Lines with Base Camp Trading
1 × $54.00
MQ Gravity Lines with Base Camp Trading
1 × $54.00 -
×
 Secrets of a Winning Trader with Gareth Soloway
1 × $871.00
Secrets of a Winning Trader with Gareth Soloway
1 × $871.00 -
×
 Options Trading with Nick & Gareth - Nick Santiago & Gareth Soloway - InTheMoneyStocks
1 × $31.00
Options Trading with Nick & Gareth - Nick Santiago & Gareth Soloway - InTheMoneyStocks
1 × $31.00 -
×
 How To Read The Market Professionally with TradeSmart
1 × $27.00
How To Read The Market Professionally with TradeSmart
1 × $27.00 -
×
 Peak Capital Trading Bootcamp with Andrew Aziz
1 × $5.00
Peak Capital Trading Bootcamp with Andrew Aziz
1 × $5.00 -
×
 Yarimi University Course
1 × $56.00
Yarimi University Course
1 × $56.00 -
×
 The Risk-Wise Investor: How to Better Understand and Manage Risk with Michael Carpenter
1 × $6.00
The Risk-Wise Investor: How to Better Understand and Manage Risk with Michael Carpenter
1 × $6.00 -
×
 Kaizen On-Demand By Candle Charts
1 × $6.00
Kaizen On-Demand By Candle Charts
1 × $6.00 -
×
 SQX Mentorship with Tip Toe Hippo
1 × $23.00
SQX Mentorship with Tip Toe Hippo
1 × $23.00 -
×
 Deep Dive Butterfly Trading Strategy Class with SJG Trades
1 × $41.00
Deep Dive Butterfly Trading Strategy Class with SJG Trades
1 × $41.00 -
×
 Options On Futures Class By Mark Fenton - Sheridan Options Mentoring
1 × $6.00
Options On Futures Class By Mark Fenton - Sheridan Options Mentoring
1 × $6.00 -
×
 Masterclass 2.0 with Dave Teaches
1 × $31.00
Masterclass 2.0 with Dave Teaches
1 × $31.00 -
×
 WondaFX Signature Strategy with WondaFX
1 × $5.00
WondaFX Signature Strategy with WondaFX
1 × $5.00 -
×
 Mastering the Geometry of Market Energy with Charles Drummond
1 × $6.00
Mastering the Geometry of Market Energy with Charles Drummond
1 × $6.00 -
×
 Master Moving Averages - Profit Multiplying Techniques with Nick Santiago - InTheMoneyStocks
1 × $54.00
Master Moving Averages - Profit Multiplying Techniques with Nick Santiago - InTheMoneyStocks
1 × $54.00 -
×
 Cotton Trading Manual with Terry Townsend
1 × $6.00
Cotton Trading Manual with Terry Townsend
1 × $6.00 -
×
 TradeCraft: Your Path to Peak Performance Trading By Adam Grimes
1 × $15.00
TradeCraft: Your Path to Peak Performance Trading By Adam Grimes
1 × $15.00 -
×
 Gillen Predicts with Jack Gillen
1 × $6.00
Gillen Predicts with Jack Gillen
1 × $6.00 -
×
 Indicator Companion for Metastock with Martin Pring
1 × $6.00
Indicator Companion for Metastock with Martin Pring
1 × $6.00 -
×
 ENG Renko Mastery with International Scalpers
1 × $10.00
ENG Renko Mastery with International Scalpers
1 × $10.00 -
×
 Master Trader with InvestingSimple
1 × $15.00
Master Trader with InvestingSimple
1 × $15.00 -
×
 The Trading Blueprint with Brad Goh - The Trading Geek
1 × $5.00
The Trading Blueprint with Brad Goh - The Trading Geek
1 × $5.00 -
×
 Candlesticks Explained with Martin Pring
1 × $6.00
Candlesticks Explained with Martin Pring
1 × $6.00 -
×
 The Indices Orderflow Masterclass with The Forex Scalpers
1 × $23.00
The Indices Orderflow Masterclass with The Forex Scalpers
1 × $23.00 -
×
 Advanced Strategies in Forex Trading with Don Schellenberg
1 × $6.00
Advanced Strategies in Forex Trading with Don Schellenberg
1 × $6.00 -
×
 Geometric Angles Applied To Modern Markets with Sean Avidar
1 × $39.00
Geometric Angles Applied To Modern Markets with Sean Avidar
1 × $39.00
 with Arthur A.Hill")
Introduction to Candlestick (Article) with Arthur A.Hill
$6.00
File Size: Coming soon!
Delivery Time: 1–12 hours
Media Type: Online Course
Content Proof: Watch Here!
You may check content proof of “Introduction to Candlestick (Article) with Arthur A.Hill” below:
 with Arthur A.Hill")
Introduction to Candlestick (Article) with Arthur A. Hill
Candlestick charting is an essential tool for traders and investors, providing a visual representation of price movements. Arthur A. Hill, a renowned expert in technical analysis, offers a comprehensive introduction to candlestick charts, making them accessible to beginners and valuable for experienced traders. Let’s explore the basics of candlestick charting and how it can enhance your trading strategy.
What is a Candlestick Chart?
A candlestick chart is a type of financial chart used to describe price movements of a security, derivative, or currency.
Components of a Candlestick
- Body: The thick part of the candlestick, showing the opening and closing prices.
- Wicks/Shadows: The thin lines above and below the body, indicating the highest and lowest prices during the period.
- Color: Traditionally, a green or white body indicates a closing price higher than the opening price, while a red or black body indicates a closing price lower than the opening price.
History of Candlestick Charting
Candlestick charting originated in Japan over 300 years ago, developed by rice traders to track market prices and daily supply and demand.
Evolution of Candlestick Charts
Over the centuries, candlestick charting has evolved and gained popularity worldwide, becoming a staple in technical analysis.
Introduction to Western Markets
Candlestick charts were introduced to the Western financial markets in the late 20th century and quickly became popular among traders.
Advantages of Candlestick Charts
Candlestick charts offer several advantages over traditional bar charts and line charts.
Visual Clarity
Candlestick charts provide a clear and concise representation of price movements, making it easier to interpret market trends.
Immediate Insight
The color-coded bodies and wicks offer immediate insight into market sentiment and price direction.
Pattern Recognition
Candlestick charts are excellent for identifying patterns that can predict future price movements.
Common Candlestick Patterns
- Doji: Indicates indecision in the market.
- Hammer: Suggests a potential reversal from a downtrend.
- Engulfing: A strong signal of a potential trend reversal.
Basic Candlestick Patterns
Understanding basic candlestick patterns is crucial for any trader looking to use this charting method effectively.
Bullish Patterns
Bullish patterns indicate potential upward price movements.
Hammer and Inverted Hammer
- Hammer: A candlestick with a small body and a long lower wick, indicating potential reversal from a downtrend.
- Inverted Hammer: Similar to the hammer but with a long upper wick, suggesting a potential bullish reversal.
Bearish Patterns
Bearish patterns suggest potential downward price movements.
Shooting Star and Hanging Man
- Shooting Star: A candlestick with a small body and a long upper wick, indicating a potential reversal from an uptrend.
- Hanging Man: Similar to the hammer but occurs after an uptrend, signaling a potential bearish reversal.
Advanced Candlestick Patterns
For more experienced traders, advanced candlestick patterns provide deeper insights into market trends.
Engulfing Patterns
Engulfing patterns occur when a smaller candlestick is followed by a larger candlestick that completely engulfs the smaller one.
Bullish Engulfing
A bullish engulfing pattern occurs at the bottom of a downtrend and signals a potential upward reversal.
Bearish Engulfing
A bearish engulfing pattern appears at the top of an uptrend and suggests a potential downward reversal.
Morning Star and Evening Star
These patterns are three-candlestick formations that indicate strong trend reversals.
Morning Star
The morning star pattern consists of a bearish candle, a small indecisive candle, and a bullish candle, indicating a bullish reversal.
Evening Star
The evening star pattern includes a bullish candle, a small indecisive candle, and a bearish candle, suggesting a bearish reversal.
Incorporating Candlestick Charts into Your Trading Strategy
Candlestick charts are versatile and can be integrated into various trading strategies.
Combining with Other Indicators
Enhance the effectiveness of candlestick charts by combining them with other technical indicators.
Popular Indicators to Combine
- Moving Averages: Confirm trends and potential reversals.
- Relative Strength Index (RSI): Identify overbought or oversold conditions.
- Bollinger Bands: Measure market volatility and potential breakouts.
Setting Up Your Trading Platform
Most trading platforms offer candlestick charting options. Ensure you customize your charts to suit your trading style.
Customization Tips
- Time Frames: Choose appropriate time frames for your trading strategy.
- Color Schemes: Use distinct colors for bullish and bearish candles.
- Indicators: Add complementary indicators to your charts.
Common Mistakes to Avoid
Even with a robust understanding of candlestick charts, traders can make mistakes that affect their performance.
Over-reliance on Patterns
Relying solely on candlestick patterns without considering other factors can lead to false signals.
Diversify Analysis
Always use candlestick patterns in conjunction with other forms of analysis and market indicators.
Ignoring Market Context
Candlestick patterns can be misleading if not considered within the broader market context.
Comprehensive Analysis
Incorporate fundamental analysis and overall market trends to validate candlestick signals.
Conclusion
Candlestick charting, as introduced by Arthur A. Hill, offers a powerful tool for traders to understand and predict market movements. By mastering basic and advanced patterns, combining them with other technical indicators, and avoiding common pitfalls, traders can enhance their market analysis and trading performance. Whether you’re new to trading or an experienced trader, candlestick charts provide valuable insights that can guide your investment decisions.
Frequently Asked Questions:
- What is a candlestick chart?
A candlestick chart is a type of financial chart used to represent price movements over a specific period, showing the opening, closing, high, and low prices. - Why are candlestick charts popular among traders?
They provide visual clarity and help in identifying patterns that can predict future price movements. - What are some basic candlestick patterns?
Basic patterns include the hammer, inverted hammer, shooting star, and hanging man, which indicate potential market reversals. - Can candlestick charts be used with other technical indicators?
Yes, combining candlestick charts with indicators like moving averages, RSI, and Bollinger Bands enhances their effectiveness. - How can I avoid common mistakes when using candlestick charts?
Avoid over-relying on patterns and always consider the broader market context and other forms of analysis.
Be the first to review “Introduction to Candlestick (Article) with Arthur A.Hill”
You must be logged in to post a review.
Related products
Original price was: $4,995.00.$15.00Current price is: $15.00.
Forex Trading
Original price was: $2,000.00.$23.00Current price is: $23.00.

Original price was: $999.00.$5.00Current price is: $5.00.
Forex Trading
Original price was: $397.00.$31.00Current price is: $31.00.
Original price was: $649.00.$20.00Current price is: $20.00.

Forex Trading
Original price was: $239.00.$8.00Current price is: $8.00.

Forex Trading
Original price was: $1,098.00.$39.00Current price is: $39.00.

Original price was: $1,800.00.$54.00Current price is: $54.00.

Original price was: $895.00.$15.00Current price is: $15.00.
Forex Trading
Original price was: $2,997.00.$23.00Current price is: $23.00.

Original price was: $997.00.$8.00Current price is: $8.00.

Original price was: $497.00.$31.00Current price is: $31.00.
Forex Trading
Original price was: $799.00.$15.00Current price is: $15.00.
Original price was: $450.00.$23.00Current price is: $23.00.
Original price was: $2,120.00.$15.00Current price is: $15.00.
Forex Trading
Original price was: $550.00.$5.00Current price is: $5.00.

Original price was: $139.00.$23.00Current price is: $23.00.
Original price was: $1,849.00.$15.00Current price is: $15.00.

Forex Trading
The Complete Guide to Multiple Time Frame Analysis & Reading Price Action with Aiman Almansoori
Original price was: $1,399.00.$13.00Current price is: $13.00.
Forex Trading
Original price was: $125.00.$17.00Current price is: $17.00.

Reviews
There are no reviews yet.