-
×
 Butterfly and Condor Workshop with Aeromir
1 × $15.00
Butterfly and Condor Workshop with Aeromir
1 × $15.00 -
×
 Power Cycle Trading - Boot Camp for Swing Trading
1 × $6.00
Power Cycle Trading - Boot Camp for Swing Trading
1 × $6.00 -
×
 The Best Option Trading Course with David Jaffee - Best Stock Strategy
1 × $15.00
The Best Option Trading Course with David Jaffee - Best Stock Strategy
1 × $15.00 -
×
 Advanced Iron Condor Course in 2021
1 × $6.00
Advanced Iron Condor Course in 2021
1 × $6.00 -
×
 CarterFX Membership with Duran Carter
1 × $23.00
CarterFX Membership with Duran Carter
1 × $23.00 -
×
 Active Investing courses notes with Alan Hull
1 × $6.00
Active Investing courses notes with Alan Hull
1 × $6.00 -
×
 Small and Mighty Association with Ryan Lee
1 × $6.00
Small and Mighty Association with Ryan Lee
1 × $6.00 -
×
 Charting Made Easy with John J.Murphy
1 × $6.00
Charting Made Easy with John J.Murphy
1 × $6.00 -
×
 Mind Over Markets
1 × $6.00
Mind Over Markets
1 × $6.00 -
×
 Power Income FUTURES Day Trading Course with Trade Out Loud
1 × $31.00
Power Income FUTURES Day Trading Course with Trade Out Loud
1 × $31.00 -
×
 Hedges on Hedge Funds: How to Successfully Analyze and Select an Investment with James Hedges
1 × $6.00
Hedges on Hedge Funds: How to Successfully Analyze and Select an Investment with James Hedges
1 × $6.00 -
×
 Advanced Swing Trading with John Crane
1 × $6.00
Advanced Swing Trading with John Crane
1 × $6.00 -
×
 Understanding Wall Street (4th Ed.) with Jeffrey Little
1 × $6.00
Understanding Wall Street (4th Ed.) with Jeffrey Little
1 × $6.00 -
×
 Advanced Spread Trading with Guy Bower - MasterClass Trader
1 × $15.00
Advanced Spread Trading with Guy Bower - MasterClass Trader
1 × $15.00 -
×
 TradingMind Course with Jack Bernstein
1 × $6.00
TradingMind Course with Jack Bernstein
1 × $6.00 -
×
 A-Z Course with InvestiTrade Academy
1 × $5.00
A-Z Course with InvestiTrade Academy
1 × $5.00 -
×
 Master Time Factor & Forecasting with Mathematical Rules
1 × $6.00
Master Time Factor & Forecasting with Mathematical Rules
1 × $6.00 -
×
 Advances in International Investments: Traditional and Alternative Approaches with Hung-Gay Fung, Xiaoqing Eleanor Xu & Jot Yau
1 × $6.00
Advances in International Investments: Traditional and Alternative Approaches with Hung-Gay Fung, Xiaoqing Eleanor Xu & Jot Yau
1 × $6.00 -
×
 The 10%ers with Trader Mike
1 × $5.00
The 10%ers with Trader Mike
1 × $5.00 -
×
 The Whale Trade Workshop Plus One Week of Live Trading with Doc Severson
1 × $6.00
The Whale Trade Workshop Plus One Week of Live Trading with Doc Severson
1 × $6.00 -
×
 Volatility and Timing with Jay Kaeppel – The Option Trader’s Guide to Probability
1 × $6.00
Volatility and Timing with Jay Kaeppel – The Option Trader’s Guide to Probability
1 × $6.00 -
×
 Arjoio’s MMT - Essential Package
1 × $5.00
Arjoio’s MMT - Essential Package
1 × $5.00 -
×
 Forex Profit Multiplier with Bill & Greg Poulos
1 × $6.00
Forex Profit Multiplier with Bill & Greg Poulos
1 × $6.00 -
×
 Build Your Own Trading System with John Hill
1 × $6.00
Build Your Own Trading System with John Hill
1 × $6.00 -
×
 Secrets to Succesful Forex Trading Course with Jose Soto
1 × $6.00
Secrets to Succesful Forex Trading Course with Jose Soto
1 × $6.00 -
×
 Making Sense of Price Action: Price Action Profits with Scott Foster
1 × $54.00
Making Sense of Price Action: Price Action Profits with Scott Foster
1 × $54.00 -
×
 The Orderflows Trade Opportunities Encyclopedia with Michael Valtos
1 × $8.00
The Orderflows Trade Opportunities Encyclopedia with Michael Valtos
1 × $8.00 -
×
 TradeCraft: Your Path to Peak Performance Trading By Adam Grimes
1 × $15.00
TradeCraft: Your Path to Peak Performance Trading By Adam Grimes
1 × $15.00 -
×
 Options Trading & Ultimate MasterClass With Tyrone Abela - FX Evolution
1 × $54.00
Options Trading & Ultimate MasterClass With Tyrone Abela - FX Evolution
1 × $54.00 -
×
 Predicting Market Trends with Alan S.Farley
1 × $6.00
Predicting Market Trends with Alan S.Farley
1 × $6.00 -
×
 The Dark Side Of Valuation with Aswath Damodaran
1 × $6.00
The Dark Side Of Valuation with Aswath Damodaran
1 × $6.00 -
×
 Day Trade Futures Online with Larry Williams
1 × $6.00
Day Trade Futures Online with Larry Williams
1 × $6.00 -
×
 The Complete Guide to Market Breadth Indicators: How to Analyze and Evaluate market Direction and Strength - Greg Morris
1 × $6.00
The Complete Guide to Market Breadth Indicators: How to Analyze and Evaluate market Direction and Strength - Greg Morris
1 × $6.00 -
×
 Formula to a Fortune with Steve Briese, Glen Ring
1 × $6.00
Formula to a Fortune with Steve Briese, Glen Ring
1 × $6.00 -
×
 Traders Workshop – Forex Full Course with Jason Stapleton
1 × $6.00
Traders Workshop – Forex Full Course with Jason Stapleton
1 × $6.00 -
×
 Neural Networks in Trading with Dr. Ernest P. Chan
1 × $31.00
Neural Networks in Trading with Dr. Ernest P. Chan
1 × $31.00 -
×
 Orderflows Gems 2-Private Sessions with Mike Valtos
1 × $20.00
Orderflows Gems 2-Private Sessions with Mike Valtos
1 × $20.00 -
×
 Market Structure Matters with Haim Bodek
1 × $62.00
Market Structure Matters with Haim Bodek
1 × $62.00 -
×
 Forex Retracement Theory with CopperChips
1 × $6.00
Forex Retracement Theory with CopperChips
1 × $6.00 -
×
 Candlesticks Re-Ignited Workshop
1 × $23.00
Candlesticks Re-Ignited Workshop
1 × $23.00 -
×
 Mastering Collar Trades Pro with Vince Vora - TradingWins
1 × $6.00
Mastering Collar Trades Pro with Vince Vora - TradingWins
1 × $6.00 -
×
 High Probability Option Trading - Seasonal Straddles
1 × $6.00
High Probability Option Trading - Seasonal Straddles
1 × $6.00 -
×
 F.A.M.E. Home Study Course with Doug Sutton
1 × $6.00
F.A.M.E. Home Study Course with Doug Sutton
1 × $6.00 -
×
 The Blockchain Bootcamp 2.0 with Gregory (Dapp University)
1 × $15.00
The Blockchain Bootcamp 2.0 with Gregory (Dapp University)
1 × $15.00 -
×
 Trading for a Living with Alexander Elder
1 × $6.00
Trading for a Living with Alexander Elder
1 × $6.00 -
×
 Pristine - Tom Willard – Creating The Ultimate Trading Psychology Using 3 Key Concepts
1 × $6.00
Pristine - Tom Willard – Creating The Ultimate Trading Psychology Using 3 Key Concepts
1 × $6.00 -
×
 Fundamentals 101: A Comprehensive Guide to Macroeconomic, Industry, and Financial Statement Analysis Class with Jeff Bierman
1 × $6.00
Fundamentals 101: A Comprehensive Guide to Macroeconomic, Industry, and Financial Statement Analysis Class with Jeff Bierman
1 × $6.00 -
×
 The Michanics of Futures Trading - Roy Habben
1 × $6.00
The Michanics of Futures Trading - Roy Habben
1 × $6.00 -
×
 Selected Articles by the Late by George Lindsay
1 × $6.00
Selected Articles by the Late by George Lindsay
1 × $6.00 -
×
 ShadowTrader Weighted S&P Advance Decline Line thinkScript with Peter Reznicek - ShadowTrader
1 × $23.00
ShadowTrader Weighted S&P Advance Decline Line thinkScript with Peter Reznicek - ShadowTrader
1 × $23.00 -
×
 Preparing for the Worst: Incorporating Downside Risk in Stock Market Investments with Hrishikesh Vinod & Derrick Reagle
1 × $6.00
Preparing for the Worst: Incorporating Downside Risk in Stock Market Investments with Hrishikesh Vinod & Derrick Reagle
1 × $6.00 -
×
 Hedge Funds for Dummies
1 × $6.00
Hedge Funds for Dummies
1 × $6.00 -
×
 Tradingmarkets - Introduction to AmiBroker Programming
1 × $15.00
Tradingmarkets - Introduction to AmiBroker Programming
1 × $15.00 -
×
 Algo Trading Masterclass with Ali Casey - StatOasis
1 × $23.00
Algo Trading Masterclass with Ali Casey - StatOasis
1 × $23.00 -
×
 Trading for a Bright Future with Martin Cole
1 × $6.00
Trading for a Bright Future with Martin Cole
1 × $6.00 -
×
 Fractal Energy Trading with Doc Severson
1 × $6.00
Fractal Energy Trading with Doc Severson
1 × $6.00 -
×
 Essentials in Quantitative Trading QT01 By HangukQuant's
1 × $23.00
Essentials in Quantitative Trading QT01 By HangukQuant's
1 × $23.00 -
×
 Ultimate Trading Course with Dodgy's Dungeon
1 × $8.00
Ultimate Trading Course with Dodgy's Dungeon
1 × $8.00 -
×
 Andy’s EMini Bar – 40 Min System with Joe Ross
1 × $6.00
Andy’s EMini Bar – 40 Min System with Joe Ross
1 × $6.00 -
×
 From Wall Street to the Great Wall with Jonathan Worrall
1 × $6.00
From Wall Street to the Great Wall with Jonathan Worrall
1 × $6.00 -
×
 RSI Basic with Andrew Cardwell
1 × $54.00
RSI Basic with Andrew Cardwell
1 × $54.00 -
×
 How I Made One Million Dollars with Larry Williams
1 × $6.00
How I Made One Million Dollars with Larry Williams
1 × $6.00 -
×
 Create Your Own Hedge Fund with Mark Wolfinger
1 × $6.00
Create Your Own Hedge Fund with Mark Wolfinger
1 × $6.00 -
×
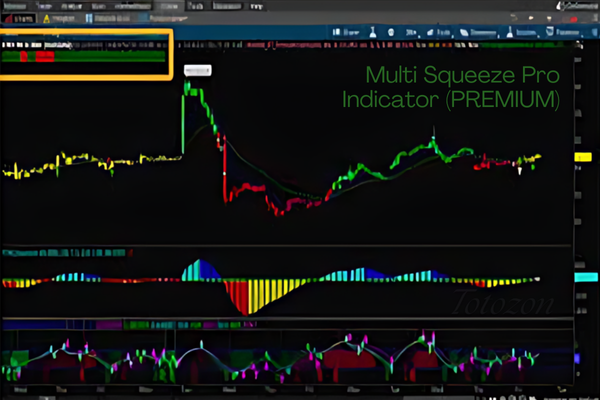 Multi Squeeze Pro Indicator (PREMIUM)
1 × $69.00
Multi Squeeze Pro Indicator (PREMIUM)
1 × $69.00 -
×
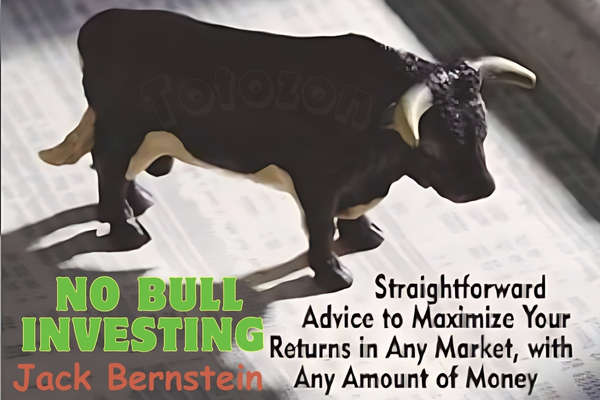 No Bull Investing with Jack Bernstein
1 × $6.00
No Bull Investing with Jack Bernstein
1 × $6.00 -
×
 Tandem Trader with Investors Underground
1 × $6.00
Tandem Trader with Investors Underground
1 × $6.00 -
×
 Private Access Pro Webinars 2021-2022 with Trader Lion
1 × $5.00
Private Access Pro Webinars 2021-2022 with Trader Lion
1 × $5.00 -
×
 Fierce 10 On Demand Coaching Program with High Performance Trading
1 × $5.00
Fierce 10 On Demand Coaching Program with High Performance Trading
1 × $5.00 -
×
 8 Year Presidential Election Pattern (Article) with Adam White
1 × $6.00
8 Year Presidential Election Pattern (Article) with Adam White
1 × $6.00 -
×
 WondaFX Signature Strategy with WondaFX
1 × $5.00
WondaFX Signature Strategy with WondaFX
1 × $5.00 -
×
 Path to Profits By Scott Redler - T3 Live
1 × $6.00
Path to Profits By Scott Redler - T3 Live
1 × $6.00 -
×
 Traders Seminars – 7 CD
1 × $31.00
Traders Seminars – 7 CD
1 × $31.00 -
×
 Chart Pattern Profits
1 × $6.00
Chart Pattern Profits
1 × $6.00 -
×
 Matrix Spread Options Trading Course with Base Camp Trading
1 × $31.00
Matrix Spread Options Trading Course with Base Camp Trading
1 × $31.00 -
×
 Outsmarting Wall Street (3rd Ed) with Daniel Alan Seiver
1 × $6.00
Outsmarting Wall Street (3rd Ed) with Daniel Alan Seiver
1 × $6.00 -
×
 TRADING NFX Course with Andrew NFX
1 × $5.00
TRADING NFX Course with Andrew NFX
1 × $5.00 -
×
 Options Wizardry from A to Z (Video 2.80 GB) with Don Fishback
1 × $6.00
Options Wizardry from A to Z (Video 2.80 GB) with Don Fishback
1 × $6.00 -
×
 Market Masters. How Traders Think Trade And Invest with Jake Bernstein
1 × $6.00
Market Masters. How Traders Think Trade And Invest with Jake Bernstein
1 × $6.00 -
×
 A Forex System For Catching Pips All Day Long with Forex Pip Fishing
1 × $4.00
A Forex System For Catching Pips All Day Long with Forex Pip Fishing
1 × $4.00 -
×
 The Trading Blueprint with Brad Goh - The Trading Geek
1 × $5.00
The Trading Blueprint with Brad Goh - The Trading Geek
1 × $5.00 -
×
 PRO COURSE Order Flow Strategy with Gova Trading Academy
1 × $5.00
PRO COURSE Order Flow Strategy with Gova Trading Academy
1 × $5.00 -
×
 The Prop Trading Code with Brannigan Barrett - Axia Futures
1 × $23.00
The Prop Trading Code with Brannigan Barrett - Axia Futures
1 × $23.00 -
×
 Geometry of Markets I with Bruce Gilmore
1 × $6.00
Geometry of Markets I with Bruce Gilmore
1 × $6.00 -
×
![Strike Zone Trading - Forex Course [81 Videos (MP4) + 96 Software files (EXEEX4MQ4CHRWNDTPL) + 17 DOCS (TXTCSVXLSXPDF) + Images (PNGJPGGIF)]](https://www.totozon.com/wp-content/uploads/2024/05/Strike-Zone-Trading-Forex-Course-81-Videos-MP4-96-Software-files-EXEEX4MQ4CHRWNDTPL-17-DOCS-TXTCSVXLSXPDF-Images-PNGJPGGIF.jpg) Strike Zone Trading - Forex Course [81 Videos (MP4) + 96 Software files (EXE/EX4/MQ4/CHR/WND/TPL) + 17 DOCS (TXT/CSV/XLSX/PDF) + Images (PNG/JPG/GIF)]
1 × $6.00
Strike Zone Trading - Forex Course [81 Videos (MP4) + 96 Software files (EXE/EX4/MQ4/CHR/WND/TPL) + 17 DOCS (TXT/CSV/XLSX/PDF) + Images (PNG/JPG/GIF)]
1 × $6.00 -
×
 Profit Power Seminar
1 × $23.00
Profit Power Seminar
1 × $23.00 -
×
 Elliott Wave Indicator Suite for ThinkorSwim
1 × $15.00
Elliott Wave Indicator Suite for ThinkorSwim
1 × $15.00 -
×
 Sovereign Man Confidential
1 × $6.00
Sovereign Man Confidential
1 × $6.00 -
×
 Naked Forex: High-Probability Techniques for Trading Without Indicators (2012) with Alex Nekritin & Walter Peters
1 × $6.00
Naked Forex: High-Probability Techniques for Trading Without Indicators (2012) with Alex Nekritin & Walter Peters
1 × $6.00 -
×
 Strategy Week: Using High Probability Options Strategies with Don Kaufman
1 × $6.00
Strategy Week: Using High Probability Options Strategies with Don Kaufman
1 × $6.00 -
×
 Mastering Risk Modeling with Excel by Alastair Day
1 × $6.00
Mastering Risk Modeling with Excel by Alastair Day
1 × $6.00 -
×
 Inside the Minds Leading Wall Street Investors with Aspatore Books
1 × $6.00
Inside the Minds Leading Wall Street Investors with Aspatore Books
1 × $6.00 -
×
 OFA - Intensive Boot Camp 5 Day Course
1 × $6.00
OFA - Intensive Boot Camp 5 Day Course
1 × $6.00 -
×
 The Litle Book of Bulletproof Investing
1 × $6.00
The Litle Book of Bulletproof Investing
1 × $6.00 -
×
 A Working Man's Forex Position Trading System 2010 with Alan Benefield
1 × $6.00
A Working Man's Forex Position Trading System 2010 with Alan Benefield
1 × $6.00 -
×
 ALGO™ Online Retail - Version 2.9
1 × $155.00
ALGO™ Online Retail - Version 2.9
1 × $155.00 -
×
 $20 – 52k 20 pips a day challange with Rafał Zuchowicz - TopMasterTrader
1 × $5.00
$20 – 52k 20 pips a day challange with Rafał Zuchowicz - TopMasterTrader
1 × $5.00 -
×
 CFA Pro Level 1 2004 CD - Scheweser
1 × $6.00
CFA Pro Level 1 2004 CD - Scheweser
1 × $6.00 -
×
 Five Trading Trends of 2005 with Dan Denning
1 × $6.00
Five Trading Trends of 2005 with Dan Denning
1 × $6.00 -
×
 Bear Trap Indicator with Markay Latimer
1 × $5.00
Bear Trap Indicator with Markay Latimer
1 × $5.00 -
×
 90 Days To Trade MasterClass with Jerremy Newsome & Matt Delong - Real Life Trading
1 × $104.00
90 Days To Trade MasterClass with Jerremy Newsome & Matt Delong - Real Life Trading
1 × $104.00 -
×
 Shawn Sharma Mentorship Program
1 × $34.00
Shawn Sharma Mentorship Program
1 × $34.00 -
×
 My General Counsel™
1 × $23.00
My General Counsel™
1 × $23.00 -
×
 How to Spot Trading Opportunities
1 × $6.00
How to Spot Trading Opportunities
1 × $6.00 -
×
 Module III - Peak Formation Trades with FX MindShift
1 × $6.00
Module III - Peak Formation Trades with FX MindShift
1 × $6.00 -
×
 Forex Secrets Exposed
1 × $15.00
Forex Secrets Exposed
1 × $15.00 -
×
 Futures Spread Trading Intro Course with Thetradingframework
1 × $6.00
Futures Spread Trading Intro Course with Thetradingframework
1 × $6.00 -
×
 Power FX Xtreme BuySell EA
1 × $23.00
Power FX Xtreme BuySell EA
1 × $23.00 -
×
 Forex Avenger Trading System with David Curran
1 × $6.00
Forex Avenger Trading System with David Curran
1 × $6.00 -
×
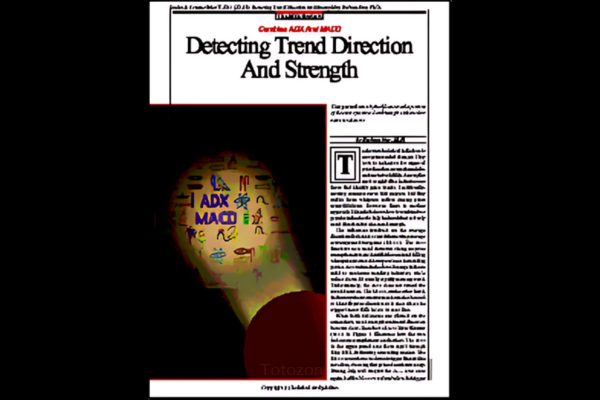 Detecting Trend Direction & Strength (Article) with Barbara Star
1 × $6.00
Detecting Trend Direction & Strength (Article) with Barbara Star
1 × $6.00 -
×
 Market Stalkers Level 1 - Swing trading school (2020)
1 × $8.00
Market Stalkers Level 1 - Swing trading school (2020)
1 × $8.00 -
×
 Profit.ly - Bitcoin Basics
1 × $6.00
Profit.ly - Bitcoin Basics
1 × $6.00 -
×
 Forecast 2024 Clarification with Larry Williams
1 × $15.00
Forecast 2024 Clarification with Larry Williams
1 × $15.00 -
×
 Introduction To Market Turning Points Caused - The Demand & Supply Of Big Banks Institution - Golden Bridge Trading
1 × $6.00
Introduction To Market Turning Points Caused - The Demand & Supply Of Big Banks Institution - Golden Bridge Trading
1 × $6.00 -
×
 Speculating with Futures and Traditional Commodities with Liverpool Group
1 × $6.00
Speculating with Futures and Traditional Commodities with Liverpool Group
1 × $6.00 -
×
 The 80% Solution S&P Systems with Bruce Babcock
1 × $6.00
The 80% Solution S&P Systems with Bruce Babcock
1 × $6.00 -
×
 Advanced Management Strategies - Home Study with Pristine Capital
1 × $27.00
Advanced Management Strategies - Home Study with Pristine Capital
1 × $27.00 -
×
 3 Short Selling Strategies - Trading Strategy Bundles – Quantified Strategies
1 × $39.00
3 Short Selling Strategies - Trading Strategy Bundles – Quantified Strategies
1 × $39.00 -
×
 Mastering Amibroker Formula Language
1 × $15.00
Mastering Amibroker Formula Language
1 × $15.00 -
×
 Chaos and order in the Capital Markets with Edgar E.Peters
1 × $6.00
Chaos and order in the Capital Markets with Edgar E.Peters
1 × $6.00 -
×
 Money Management Strategies for Serious Traders with David Stendahl
1 × $6.00
Money Management Strategies for Serious Traders with David Stendahl
1 × $6.00 -
×
 Simple Methods for Detecting Buying and Selling Points in Securities with James Liveright
1 × $6.00
Simple Methods for Detecting Buying and Selling Points in Securities with James Liveright
1 × $6.00 -
×
 Patterns of Speculation with Bertrand M.Roehner
1 × $6.00
Patterns of Speculation with Bertrand M.Roehner
1 × $6.00 -
×
 6 Live Sentiment Analysis Trading Bots using Python with The A.I. Whisperer
1 × $5.00
6 Live Sentiment Analysis Trading Bots using Python with The A.I. Whisperer
1 × $5.00 -
×
 5 Technical Signals You Should Not Trade Without (4 CDs) with Toni Hansen
1 × $6.00
5 Technical Signals You Should Not Trade Without (4 CDs) with Toni Hansen
1 × $6.00 -
×
 The Great Depression with David Burg
1 × $6.00
The Great Depression with David Burg
1 × $6.00 -
×
 Art & Science of Trend Trading Class with Jeff Bierman
1 × $6.00
Art & Science of Trend Trading Class with Jeff Bierman
1 × $6.00 -
×
 The Practical Handbook of Genetic Algorithms with Lance Chambers
1 × $6.00
The Practical Handbook of Genetic Algorithms with Lance Chambers
1 × $6.00 -
×
 Stock Traders Almanac 2008 with Jeffrey Hirsch & Yale Hirsch
1 × $6.00
Stock Traders Almanac 2008 with Jeffrey Hirsch & Yale Hirsch
1 × $6.00 -
×
 Evidence Based Technical Analysis with David Aronson
1 × $6.00
Evidence Based Technical Analysis with David Aronson
1 × $6.00 -
×
 Predators & Profits with Martin Howell & John Bogle
1 × $6.00
Predators & Profits with Martin Howell & John Bogle
1 × $6.00 -
×
 The Profit Magic of Stock Transaction Timing with J.M.Hurst
1 × $6.00
The Profit Magic of Stock Transaction Timing with J.M.Hurst
1 × $6.00 -
×
 Street-Smart Chart Reading – Volume 1 – The Rudiments with Donald G.Worden
1 × $6.00
Street-Smart Chart Reading – Volume 1 – The Rudiments with Donald G.Worden
1 × $6.00 -
×
![Trading The Elliott Wave Indicator (2003) [1 MP4] by Robert Prechter image](https://www.totozon.com/wp-content/uploads/2024/05/Trading-The-Elliott-Wave-Indicator-2003-1-MP4-by-Robert-Prechter-image.png) Trading The Elliott Wave Indicator (2003) [1 MP4] - Robert Prechter
1 × $6.00
Trading The Elliott Wave Indicator (2003) [1 MP4] - Robert Prechter
1 × $6.00 -
×
 Advent Forex Course with Cecil Robles
1 × $6.00
Advent Forex Course with Cecil Robles
1 × $6.00 -
×
 The Delphi Scalper 4 - Video + Metatrader Indicators with Jason Fielder
1 × $6.00
The Delphi Scalper 4 - Video + Metatrader Indicators with Jason Fielder
1 × $6.00 -
×
 Simpler Options - Insider’s Guide to Generating Income using Options Strategies Course (Oct 2014)
1 × $6.00
Simpler Options - Insider’s Guide to Generating Income using Options Strategies Course (Oct 2014)
1 × $6.00 -
×
 The Orderflow Masterclass with PrimeTrading
1 × $17.00
The Orderflow Masterclass with PrimeTrading
1 × $17.00
 with Arthur A.Hill")
Introduction to Candlestick (Article) with Arthur A.Hill
$6.00
File Size: Coming soon!
Delivery Time: 1–12 hours
Media Type: Online Course
Content Proof: Watch Here!
You may check content proof of “Introduction to Candlestick (Article) with Arthur A.Hill” below:
 with Arthur A.Hill")
Introduction to Candlestick (Article) with Arthur A. Hill
Candlestick charting is an essential tool for traders and investors, providing a visual representation of price movements. Arthur A. Hill, a renowned expert in technical analysis, offers a comprehensive introduction to candlestick charts, making them accessible to beginners and valuable for experienced traders. Let’s explore the basics of candlestick charting and how it can enhance your trading strategy.
What is a Candlestick Chart?
A candlestick chart is a type of financial chart used to describe price movements of a security, derivative, or currency.
Components of a Candlestick
- Body: The thick part of the candlestick, showing the opening and closing prices.
- Wicks/Shadows: The thin lines above and below the body, indicating the highest and lowest prices during the period.
- Color: Traditionally, a green or white body indicates a closing price higher than the opening price, while a red or black body indicates a closing price lower than the opening price.
History of Candlestick Charting
Candlestick charting originated in Japan over 300 years ago, developed by rice traders to track market prices and daily supply and demand.
Evolution of Candlestick Charts
Over the centuries, candlestick charting has evolved and gained popularity worldwide, becoming a staple in technical analysis.
Introduction to Western Markets
Candlestick charts were introduced to the Western financial markets in the late 20th century and quickly became popular among traders.
Advantages of Candlestick Charts
Candlestick charts offer several advantages over traditional bar charts and line charts.
Visual Clarity
Candlestick charts provide a clear and concise representation of price movements, making it easier to interpret market trends.
Immediate Insight
The color-coded bodies and wicks offer immediate insight into market sentiment and price direction.
Pattern Recognition
Candlestick charts are excellent for identifying patterns that can predict future price movements.
Common Candlestick Patterns
- Doji: Indicates indecision in the market.
- Hammer: Suggests a potential reversal from a downtrend.
- Engulfing: A strong signal of a potential trend reversal.
Basic Candlestick Patterns
Understanding basic candlestick patterns is crucial for any trader looking to use this charting method effectively.
Bullish Patterns
Bullish patterns indicate potential upward price movements.
Hammer and Inverted Hammer
- Hammer: A candlestick with a small body and a long lower wick, indicating potential reversal from a downtrend.
- Inverted Hammer: Similar to the hammer but with a long upper wick, suggesting a potential bullish reversal.
Bearish Patterns
Bearish patterns suggest potential downward price movements.
Shooting Star and Hanging Man
- Shooting Star: A candlestick with a small body and a long upper wick, indicating a potential reversal from an uptrend.
- Hanging Man: Similar to the hammer but occurs after an uptrend, signaling a potential bearish reversal.
Advanced Candlestick Patterns
For more experienced traders, advanced candlestick patterns provide deeper insights into market trends.
Engulfing Patterns
Engulfing patterns occur when a smaller candlestick is followed by a larger candlestick that completely engulfs the smaller one.
Bullish Engulfing
A bullish engulfing pattern occurs at the bottom of a downtrend and signals a potential upward reversal.
Bearish Engulfing
A bearish engulfing pattern appears at the top of an uptrend and suggests a potential downward reversal.
Morning Star and Evening Star
These patterns are three-candlestick formations that indicate strong trend reversals.
Morning Star
The morning star pattern consists of a bearish candle, a small indecisive candle, and a bullish candle, indicating a bullish reversal.
Evening Star
The evening star pattern includes a bullish candle, a small indecisive candle, and a bearish candle, suggesting a bearish reversal.
Incorporating Candlestick Charts into Your Trading Strategy
Candlestick charts are versatile and can be integrated into various trading strategies.
Combining with Other Indicators
Enhance the effectiveness of candlestick charts by combining them with other technical indicators.
Popular Indicators to Combine
- Moving Averages: Confirm trends and potential reversals.
- Relative Strength Index (RSI): Identify overbought or oversold conditions.
- Bollinger Bands: Measure market volatility and potential breakouts.
Setting Up Your Trading Platform
Most trading platforms offer candlestick charting options. Ensure you customize your charts to suit your trading style.
Customization Tips
- Time Frames: Choose appropriate time frames for your trading strategy.
- Color Schemes: Use distinct colors for bullish and bearish candles.
- Indicators: Add complementary indicators to your charts.
Common Mistakes to Avoid
Even with a robust understanding of candlestick charts, traders can make mistakes that affect their performance.
Over-reliance on Patterns
Relying solely on candlestick patterns without considering other factors can lead to false signals.
Diversify Analysis
Always use candlestick patterns in conjunction with other forms of analysis and market indicators.
Ignoring Market Context
Candlestick patterns can be misleading if not considered within the broader market context.
Comprehensive Analysis
Incorporate fundamental analysis and overall market trends to validate candlestick signals.
Conclusion
Candlestick charting, as introduced by Arthur A. Hill, offers a powerful tool for traders to understand and predict market movements. By mastering basic and advanced patterns, combining them with other technical indicators, and avoiding common pitfalls, traders can enhance their market analysis and trading performance. Whether you’re new to trading or an experienced trader, candlestick charts provide valuable insights that can guide your investment decisions.
Frequently Asked Questions:
- What is a candlestick chart?
A candlestick chart is a type of financial chart used to represent price movements over a specific period, showing the opening, closing, high, and low prices. - Why are candlestick charts popular among traders?
They provide visual clarity and help in identifying patterns that can predict future price movements. - What are some basic candlestick patterns?
Basic patterns include the hammer, inverted hammer, shooting star, and hanging man, which indicate potential market reversals. - Can candlestick charts be used with other technical indicators?
Yes, combining candlestick charts with indicators like moving averages, RSI, and Bollinger Bands enhances their effectiveness. - How can I avoid common mistakes when using candlestick charts?
Avoid over-relying on patterns and always consider the broader market context and other forms of analysis.
Be the first to review “Introduction to Candlestick (Article) with Arthur A.Hill”
You must be logged in to post a review.
Related products

Original price was: $450.00.$23.00Current price is: $23.00.
Original price was: $299.00.$8.00Current price is: $8.00.
Original price was: $197.00.$5.00Current price is: $5.00.

Original price was: $497.00.$11.00Current price is: $11.00.

Original price was: $310.00.$23.00Current price is: $23.00.
Original price was: $1,200.00.$23.00Current price is: $23.00.

Original price was: $2,120.00.$15.00Current price is: $15.00.
Forex Trading
Original price was: $550.00.$5.00Current price is: $5.00.
Forex Trading
Original price was: $2,000.00.$23.00Current price is: $23.00.
Original price was: $1,800.00.$54.00Current price is: $54.00.
Original price was: $1,849.00.$15.00Current price is: $15.00.
Original price was: $895.00.$15.00Current price is: $15.00.

Forex Trading
Original price was: $2,997.00.$23.00Current price is: $23.00.

Forex Trading
Original price was: $397.00.$31.00Current price is: $31.00.
Forex Trading
Original price was: $1,898.00.$10.00Current price is: $10.00.

Forex Trading
Original price was: $4,997.00.$27.00Current price is: $27.00.

Forex Trading
Original price was: $797.00.$10.00Current price is: $10.00.
Forex Trading
Original price was: $799.00.$15.00Current price is: $15.00.
Forex Trading
Original price was: $239.00.$8.00Current price is: $8.00.

Forex Trading
Quantamentals – The Next Great Forefront Of Trading and Investing with Trading Markets
Original price was: $1,495.00.$8.00Current price is: $8.00.

Reviews
There are no reviews yet.