-
×
 AI For Traders with Trading Markets
1 × $31.00
AI For Traders with Trading Markets
1 × $31.00 -
×
 Trading with Wave59 with Earik Beann
1 × $6.00
Trading with Wave59 with Earik Beann
1 × $6.00 -
×
 Secrets of the Trading Pros with Jack Bouroudjan & Terrence Duffy
1 × $6.00
Secrets of the Trading Pros with Jack Bouroudjan & Terrence Duffy
1 × $6.00 -
×
 The Amazing Common Sense Guide To Investment Success with John Thomchick
1 × $6.00
The Amazing Common Sense Guide To Investment Success with John Thomchick
1 × $6.00 -
×
 TraderSumo Academy Course
1 × $13.00
TraderSumo Academy Course
1 × $13.00 -
×
 Trading Trainer - 6 Percent Protocol
1 × $39.00
Trading Trainer - 6 Percent Protocol
1 × $39.00 -
×
 Options 101 - The Basics and Beyond Class A 5-Part Course with Don Kaufman
1 × $6.00
Options 101 - The Basics and Beyond Class A 5-Part Course with Don Kaufman
1 × $6.00 -
×
 A Conservative Plan to Make $3K Monthly on $25K with Dan Sheridan – Sheridan Options Mentoring
1 × $23.00
A Conservative Plan to Make $3K Monthly on $25K with Dan Sheridan – Sheridan Options Mentoring
1 × $23.00 -
×
 Cycle Hunter Support with Brian James Sklenka
1 × $6.00
Cycle Hunter Support with Brian James Sklenka
1 × $6.00 -
×
 TradeCraft: Your Path to Peak Performance Trading By Adam Grimes
1 × $15.00
TradeCraft: Your Path to Peak Performance Trading By Adam Grimes
1 × $15.00 -
×
 Covered Calls Income Generation for Your Stocks With Don Kaufman
1 × $6.00
Covered Calls Income Generation for Your Stocks With Don Kaufman
1 × $6.00 -
×
 Andy’s EMini Bar – 60 Min System
1 × $6.00
Andy’s EMini Bar – 60 Min System
1 × $6.00 -
×
 4 Strategies That Will Make You a Professional Day Trader with Jerremy Newsome
1 × $6.00
4 Strategies That Will Make You a Professional Day Trader with Jerremy Newsome
1 × $6.00 -
×
 Activedaytrader - Mastering Technicals
1 × $15.00
Activedaytrader - Mastering Technicals
1 × $15.00 -
×
 The Geography of Money with Benjamin J.Cohen
1 × $6.00
The Geography of Money with Benjamin J.Cohen
1 × $6.00 -
×
 Compound Stock Earnings Master Class 2009 Ft Worth Tx September 12 13 DVD set
1 × $6.00
Compound Stock Earnings Master Class 2009 Ft Worth Tx September 12 13 DVD set
1 × $6.00 -
×
 Quant Edge with T3 Live
1 × $6.00
Quant Edge with T3 Live
1 × $6.00 -
×
 Investor’s Guide to Charting By Alistair Blair
1 × $6.00
Investor’s Guide to Charting By Alistair Blair
1 × $6.00 -
×
 Wyckoff Unleashed Official Online Course (2018) with Wyckoffsmi
1 × $23.00
Wyckoff Unleashed Official Online Course (2018) with Wyckoffsmi
1 × $23.00 -
×
 Trade Options Like a DPM with The Admiral Webinar Series with Hamzei Analytics
1 × $6.00
Trade Options Like a DPM with The Admiral Webinar Series with Hamzei Analytics
1 × $6.00 -
×
 The London Close Trade Strategy with Shirley Hudson & Vic Noble
1 × $4.00
The London Close Trade Strategy with Shirley Hudson & Vic Noble
1 × $4.00 -
×
 Mastering Candlestick Charts II with Greg Capra
1 × $6.00
Mastering Candlestick Charts II with Greg Capra
1 × $6.00 -
×
 Bond Market Course with The Macro Compass
1 × $15.00
Bond Market Course with The Macro Compass
1 × $15.00 -
×
 Home Run Options Trading Course with Dave Aquino - Base Camp Trading
1 × $11.00
Home Run Options Trading Course with Dave Aquino - Base Camp Trading
1 × $11.00 -
×
 Forex Strategy Course with Angel Traders
1 × $6.00
Forex Strategy Course with Angel Traders
1 × $6.00 -
×
 Price Action and Orderflow Course with Young Tilopa
1 × $17.00
Price Action and Orderflow Course with Young Tilopa
1 × $17.00 -
×
 Money Management Strategies for Serious Traders with David Stendahl
1 × $6.00
Money Management Strategies for Serious Traders with David Stendahl
1 × $6.00 -
×
 Secrets of the Darvas Trading System
1 × $6.00
Secrets of the Darvas Trading System
1 × $6.00 -
×
 Forty Cents for Financial Freedom with Darlene Nelson
1 × $6.00
Forty Cents for Financial Freedom with Darlene Nelson
1 × $6.00 -
×
 The Naked Eye: Raw Data Analytics with Edgar Torres - Raw Data Analytics
1 × $8.00
The Naked Eye: Raw Data Analytics with Edgar Torres - Raw Data Analytics
1 × $8.00 -
×
 Traders World Past Issue Articles on CD with Magazine
1 × $6.00
Traders World Past Issue Articles on CD with Magazine
1 × $6.00 -
×
 How I Day Trade Course with Traderade
1 × $15.00
How I Day Trade Course with Traderade
1 × $15.00 -
×
 Trade the OEX with Arthur Darack
1 × $6.00
Trade the OEX with Arthur Darack
1 × $6.00 -
×
 Cheatcode Trend System with Dominique Woodson
1 × $15.00
Cheatcode Trend System with Dominique Woodson
1 × $15.00 -
×
 The Loyalty Effect with Frederick Reichheld
1 × $6.00
The Loyalty Effect with Frederick Reichheld
1 × $6.00 -
×
 How to Predict and Prepare for a Stock Market Crash with Damon Verial
1 × $6.00
How to Predict and Prepare for a Stock Market Crash with Damon Verial
1 × $6.00 -
×
 Essentials in Quantitative Trading QT01 By HangukQuant's
1 × $23.00
Essentials in Quantitative Trading QT01 By HangukQuant's
1 × $23.00 -
×
 The Practical Handbook of Genetic Algorithms with Lance Chambers
1 × $6.00
The Practical Handbook of Genetic Algorithms with Lance Chambers
1 × $6.00 -
×
 The Complete Guide to Multiple Time Frame Analysis & Reading Price Action with Aiman Almansoori
1 × $13.00
The Complete Guide to Multiple Time Frame Analysis & Reading Price Action with Aiman Almansoori
1 × $13.00 -
×
 Short-Term Trading with Precision Timing - Jack Bernstein
1 × $6.00
Short-Term Trading with Precision Timing - Jack Bernstein
1 × $6.00 -
×
 MTI - Basics UTP
1 × $6.00
MTI - Basics UTP
1 × $6.00 -
×
 Compass Trading System with Right Line Trading
1 × $39.00
Compass Trading System with Right Line Trading
1 × $39.00 -
×
 Day One Trader with John Sussex
1 × $6.00
Day One Trader with John Sussex
1 × $6.00 -
×
 ABCs of Trading and Tech Analysis (Online Investor Expo, Las Vegas 2000) with Tom Bierovic
1 × $6.00
ABCs of Trading and Tech Analysis (Online Investor Expo, Las Vegas 2000) with Tom Bierovic
1 × $6.00 -
×
 The Best Option Trading Course with David Jaffee - Best Stock Strategy
1 × $15.00
The Best Option Trading Course with David Jaffee - Best Stock Strategy
1 × $15.00 -
×
 W. D Gann 's Square Of 9 Applied To Modern Markets with Sean Avidar - Hexatrade350
1 × $23.00
W. D Gann 's Square Of 9 Applied To Modern Markets with Sean Avidar - Hexatrade350
1 × $23.00 -
×
 A Non-Random Walk Down Wall Street with Andrew W.Lo
1 × $6.00
A Non-Random Walk Down Wall Street with Andrew W.Lo
1 × $6.00 -
×
 Hawkeye Indicators for eSignal + Manual (janarps.com)
1 × $6.00
Hawkeye Indicators for eSignal + Manual (janarps.com)
1 × $6.00 -
×
 Algo Trading Masterclass with Ali Casey - StatOasis
1 × $23.00
Algo Trading Masterclass with Ali Casey - StatOasis
1 × $23.00 -
×
 WondaFX Signature Strategy with WondaFX
1 × $5.00
WondaFX Signature Strategy with WondaFX
1 × $5.00 -
×
 Strategy, Value and Risk - The Real Options Approach with Jamie Rogers
1 × $6.00
Strategy, Value and Risk - The Real Options Approach with Jamie Rogers
1 × $6.00 -
×
 Acclimation Course with Base Camp Trading
1 × $10.00
Acclimation Course with Base Camp Trading
1 × $10.00 -
×
 Forex Trading MasterClass with Torero Traders School
1 × $5.00
Forex Trading MasterClass with Torero Traders School
1 × $5.00 -
×
 The Michanics of Futures Trading - Roy Habben
1 × $6.00
The Michanics of Futures Trading - Roy Habben
1 × $6.00 -
×
 Capital Asset Investment with Anthony F.Herbst
1 × $6.00
Capital Asset Investment with Anthony F.Herbst
1 × $6.00 -
×
 60 Seconds Sure Shot Strategy with Albert E
1 × $6.00
60 Seconds Sure Shot Strategy with Albert E
1 × $6.00 -
×
 Advanced Options Concepts - Probability, Greeks, Simulation
1 × $6.00
Advanced Options Concepts - Probability, Greeks, Simulation
1 × $6.00 -
×
 Crystal Ball Pack PLUS bonus Live Trade By Pat Mitchell - Trick Trades
1 × $20.00
Crystal Ball Pack PLUS bonus Live Trade By Pat Mitchell - Trick Trades
1 × $20.00 -
×
 Forex Secrets Exposed
1 × $15.00
Forex Secrets Exposed
1 × $15.00 -
×
 Forecast 2024 Clarification with Larry Williams
1 × $15.00
Forecast 2024 Clarification with Larry Williams
1 × $15.00 -
×
 The Indices Orderflow Masterclass with The Forex Scalpers
1 × $23.00
The Indices Orderflow Masterclass with The Forex Scalpers
1 × $23.00 -
×
 Stock Trader`s Almanac 2012 with Jeffrey Hirsch & Yale Hirsch
1 × $6.00
Stock Trader`s Almanac 2012 with Jeffrey Hirsch & Yale Hirsch
1 × $6.00 -
×
 George Bayer Squarring the Circle for Excel
1 × $6.00
George Bayer Squarring the Circle for Excel
1 × $6.00 -
×
 The Trading Blueprint with Brad Goh - The Trading Geek
1 × $5.00
The Trading Blueprint with Brad Goh - The Trading Geek
1 × $5.00 -
×
 3 Day Live Trading Webinar (Jan 2010)
1 × $6.00
3 Day Live Trading Webinar (Jan 2010)
1 × $6.00 -
×
 A Convicted Stock Manipulators Guide to Investing with Marino Specogna
1 × $6.00
A Convicted Stock Manipulators Guide to Investing with Marino Specogna
1 × $6.00 -
×
 Ezaih Academy 2024 Mentorship with Ezaih
1 × $54.00
Ezaih Academy 2024 Mentorship with Ezaih
1 × $54.00 -
×
 Forecasting Financial Markets (2nd Ed.)
1 × $6.00
Forecasting Financial Markets (2nd Ed.)
1 × $6.00 -
×
 TradingMind Course with Jack Bernstein
1 × $6.00
TradingMind Course with Jack Bernstein
1 × $6.00 -
×
 The Beginners Guide to Commodities Investing with Brian & Gayle Rice
1 × $6.00
The Beginners Guide to Commodities Investing with Brian & Gayle Rice
1 × $6.00 -
×
 Butterfly and Condor Workshop with Aeromir
1 × $15.00
Butterfly and Condor Workshop with Aeromir
1 × $15.00 -
×
 Smart Money Trading Course with Prosperity Academy
1 × $5.00
Smart Money Trading Course with Prosperity Academy
1 × $5.00 -
×
 The Insider's Guide to 52 Homes in 52 Weeks: Acquire Your Real Estate Fortune Today with Dolf De Roos
1 × $6.00
The Insider's Guide to 52 Homes in 52 Weeks: Acquire Your Real Estate Fortune Today with Dolf De Roos
1 × $6.00 -
×
 Futures Trading Secrets Home Study with Bill McCready
1 × $6.00
Futures Trading Secrets Home Study with Bill McCready
1 × $6.00 -
×
 The Handbook of Pairs Trading with Douglas Ehrman
1 × $6.00
The Handbook of Pairs Trading with Douglas Ehrman
1 × $6.00 -
×
 Basic Options Course Cash Flow. Diversification. Flexibility with Michael Drew
1 × $6.00
Basic Options Course Cash Flow. Diversification. Flexibility with Michael Drew
1 × $6.00 -
×
 Harmonic Vibrations with Larry Pesavento
1 × $6.00
Harmonic Vibrations with Larry Pesavento
1 × $6.00 -
×
 How I use Technical Analysis & Orderflow with Adam Webb - Traderskew
1 × $54.00
How I use Technical Analysis & Orderflow with Adam Webb - Traderskew
1 × $54.00 -
×
 FMG Online Course with FMG Traders
1 × $6.00
FMG Online Course with FMG Traders
1 × $6.00 -
×
 European Members - March 2023 with Stockbee
1 × $5.00
European Members - March 2023 with Stockbee
1 × $5.00 -
×
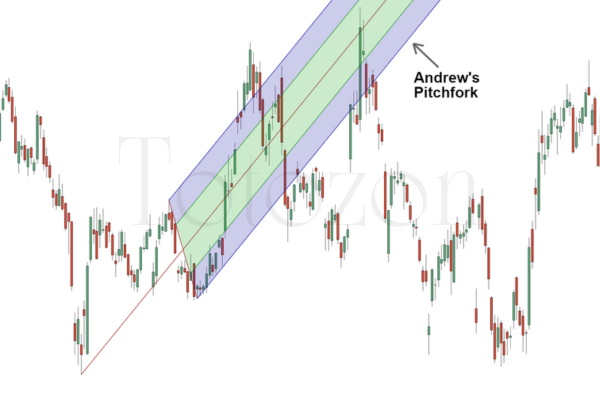 Andrews Pitchfork Basic
1 × $6.00
Andrews Pitchfork Basic
1 × $6.00 -
×
 The Complete XAUUSD GOLD Forex Scalping System On Real Trading Account with Forex Lia
1 × $5.00
The Complete XAUUSD GOLD Forex Scalping System On Real Trading Account with Forex Lia
1 × $5.00 -
×
 Sun Tzu and the Art of War for Traders with Dean Lundell
1 × $6.00
Sun Tzu and the Art of War for Traders with Dean Lundell
1 × $6.00 -
×
 Simpler Traders - Ultimate Guide to Debit Spreads (PREMIUM)
1 × $39.00
Simpler Traders - Ultimate Guide to Debit Spreads (PREMIUM)
1 × $39.00 -
×
 PRO COURSE Order Flow Strategy with Gova Trading Academy
1 × $5.00
PRO COURSE Order Flow Strategy with Gova Trading Academy
1 × $5.00 -
×
 The Orderflow Masterclass with PrimeTrading
1 × $17.00
The Orderflow Masterclass with PrimeTrading
1 × $17.00
 with Arthur A.Hill")
Introduction to Candlestick (Article) with Arthur A.Hill
$6.00
File Size: Coming soon!
Delivery Time: 1–12 hours
Media Type: Online Course
Content Proof: Watch Here!
You may check content proof of “Introduction to Candlestick (Article) with Arthur A.Hill” below:
 with Arthur A.Hill")
Introduction to Candlestick (Article) with Arthur A. Hill
Candlestick charting is an essential tool for traders and investors, providing a visual representation of price movements. Arthur A. Hill, a renowned expert in technical analysis, offers a comprehensive introduction to candlestick charts, making them accessible to beginners and valuable for experienced traders. Let’s explore the basics of candlestick charting and how it can enhance your trading strategy.
What is a Candlestick Chart?
A candlestick chart is a type of financial chart used to describe price movements of a security, derivative, or currency.
Components of a Candlestick
- Body: The thick part of the candlestick, showing the opening and closing prices.
- Wicks/Shadows: The thin lines above and below the body, indicating the highest and lowest prices during the period.
- Color: Traditionally, a green or white body indicates a closing price higher than the opening price, while a red or black body indicates a closing price lower than the opening price.
History of Candlestick Charting
Candlestick charting originated in Japan over 300 years ago, developed by rice traders to track market prices and daily supply and demand.
Evolution of Candlestick Charts
Over the centuries, candlestick charting has evolved and gained popularity worldwide, becoming a staple in technical analysis.
Introduction to Western Markets
Candlestick charts were introduced to the Western financial markets in the late 20th century and quickly became popular among traders.
Advantages of Candlestick Charts
Candlestick charts offer several advantages over traditional bar charts and line charts.
Visual Clarity
Candlestick charts provide a clear and concise representation of price movements, making it easier to interpret market trends.
Immediate Insight
The color-coded bodies and wicks offer immediate insight into market sentiment and price direction.
Pattern Recognition
Candlestick charts are excellent for identifying patterns that can predict future price movements.
Common Candlestick Patterns
- Doji: Indicates indecision in the market.
- Hammer: Suggests a potential reversal from a downtrend.
- Engulfing: A strong signal of a potential trend reversal.
Basic Candlestick Patterns
Understanding basic candlestick patterns is crucial for any trader looking to use this charting method effectively.
Bullish Patterns
Bullish patterns indicate potential upward price movements.
Hammer and Inverted Hammer
- Hammer: A candlestick with a small body and a long lower wick, indicating potential reversal from a downtrend.
- Inverted Hammer: Similar to the hammer but with a long upper wick, suggesting a potential bullish reversal.
Bearish Patterns
Bearish patterns suggest potential downward price movements.
Shooting Star and Hanging Man
- Shooting Star: A candlestick with a small body and a long upper wick, indicating a potential reversal from an uptrend.
- Hanging Man: Similar to the hammer but occurs after an uptrend, signaling a potential bearish reversal.
Advanced Candlestick Patterns
For more experienced traders, advanced candlestick patterns provide deeper insights into market trends.
Engulfing Patterns
Engulfing patterns occur when a smaller candlestick is followed by a larger candlestick that completely engulfs the smaller one.
Bullish Engulfing
A bullish engulfing pattern occurs at the bottom of a downtrend and signals a potential upward reversal.
Bearish Engulfing
A bearish engulfing pattern appears at the top of an uptrend and suggests a potential downward reversal.
Morning Star and Evening Star
These patterns are three-candlestick formations that indicate strong trend reversals.
Morning Star
The morning star pattern consists of a bearish candle, a small indecisive candle, and a bullish candle, indicating a bullish reversal.
Evening Star
The evening star pattern includes a bullish candle, a small indecisive candle, and a bearish candle, suggesting a bearish reversal.
Incorporating Candlestick Charts into Your Trading Strategy
Candlestick charts are versatile and can be integrated into various trading strategies.
Combining with Other Indicators
Enhance the effectiveness of candlestick charts by combining them with other technical indicators.
Popular Indicators to Combine
- Moving Averages: Confirm trends and potential reversals.
- Relative Strength Index (RSI): Identify overbought or oversold conditions.
- Bollinger Bands: Measure market volatility and potential breakouts.
Setting Up Your Trading Platform
Most trading platforms offer candlestick charting options. Ensure you customize your charts to suit your trading style.
Customization Tips
- Time Frames: Choose appropriate time frames for your trading strategy.
- Color Schemes: Use distinct colors for bullish and bearish candles.
- Indicators: Add complementary indicators to your charts.
Common Mistakes to Avoid
Even with a robust understanding of candlestick charts, traders can make mistakes that affect their performance.
Over-reliance on Patterns
Relying solely on candlestick patterns without considering other factors can lead to false signals.
Diversify Analysis
Always use candlestick patterns in conjunction with other forms of analysis and market indicators.
Ignoring Market Context
Candlestick patterns can be misleading if not considered within the broader market context.
Comprehensive Analysis
Incorporate fundamental analysis and overall market trends to validate candlestick signals.
Conclusion
Candlestick charting, as introduced by Arthur A. Hill, offers a powerful tool for traders to understand and predict market movements. By mastering basic and advanced patterns, combining them with other technical indicators, and avoiding common pitfalls, traders can enhance their market analysis and trading performance. Whether you’re new to trading or an experienced trader, candlestick charts provide valuable insights that can guide your investment decisions.
Frequently Asked Questions:
- What is a candlestick chart?
A candlestick chart is a type of financial chart used to represent price movements over a specific period, showing the opening, closing, high, and low prices. - Why are candlestick charts popular among traders?
They provide visual clarity and help in identifying patterns that can predict future price movements. - What are some basic candlestick patterns?
Basic patterns include the hammer, inverted hammer, shooting star, and hanging man, which indicate potential market reversals. - Can candlestick charts be used with other technical indicators?
Yes, combining candlestick charts with indicators like moving averages, RSI, and Bollinger Bands enhances their effectiveness. - How can I avoid common mistakes when using candlestick charts?
Avoid over-relying on patterns and always consider the broader market context and other forms of analysis.
Be the first to review “Introduction to Candlestick (Article) with Arthur A.Hill”
You must be logged in to post a review.
Related products
Forex Trading
Original price was: $2,000.00.$23.00Current price is: $23.00.

Forex Trading
Original price was: $797.00.$10.00Current price is: $10.00.

Original price was: $997.00.$13.00Current price is: $13.00.

Forex Trading
Original price was: $999.00.$15.00Current price is: $15.00.
Original price was: $1,849.00.$15.00Current price is: $15.00.

Original price was: $1,800.00.$54.00Current price is: $54.00.

Forex Trading
Original price was: $500.00.$5.00Current price is: $5.00.
Original price was: $4,995.00.$15.00Current price is: $15.00.

Original price was: $799.00.$15.00Current price is: $15.00.

Forex Trading
Original price was: $239.00.$8.00Current price is: $8.00.

Forex Trading
Original price was: $2,997.00.$23.00Current price is: $23.00.

Original price was: $999.00.$5.00Current price is: $5.00.
Forex Trading
Original price was: $799.00.$15.00Current price is: $15.00.

Original price was: $695.00.$41.00Current price is: $41.00.

Original price was: $299.00.$8.00Current price is: $8.00.
Forex Trading
Original price was: $550.00.$5.00Current price is: $5.00.

Original price was: $895.00.$15.00Current price is: $15.00.

Forex Trading
Original price was: $397.00.$31.00Current price is: $31.00.
Original price was: $649.00.$20.00Current price is: $20.00.

Original price was: $2,120.00.$15.00Current price is: $15.00.

Reviews
There are no reviews yet.