-
×
 CFA Pro Qbank 2007 & 2008 with Schweser
1 × $6.00
CFA Pro Qbank 2007 & 2008 with Schweser
1 × $6.00 -
×
 Newsbeat Bandits Program July 2019
1 × $23.00
Newsbeat Bandits Program July 2019
1 × $23.00 -
×
 Get 95% Win Rate With The Triple Candy Method - Eden
1 × $5.00
Get 95% Win Rate With The Triple Candy Method - Eden
1 × $5.00 -
×
 Technical Analysis with Alexander Elder Video Series
1 × $6.00
Technical Analysis with Alexander Elder Video Series
1 × $6.00 -
×
 The Complete Guide to Spread Trading
1 × $6.00
The Complete Guide to Spread Trading
1 × $6.00 -
×
 PFAZoneSuite [Trading Indicator] 2017
1 × $109.00
PFAZoneSuite [Trading Indicator] 2017
1 × $109.00 -
×
 Forex Made Easy: 6 Ways to Trade the Dollar with James Dicks
1 × $6.00
Forex Made Easy: 6 Ways to Trade the Dollar with James Dicks
1 × $6.00 -
×
 ICT – Inner Circle Trader 2020 Weekly Review
1 × $20.00
ICT – Inner Circle Trader 2020 Weekly Review
1 × $20.00 -
×
 Dan Dowd Trading
1 × $5.00
Dan Dowd Trading
1 × $5.00 -
×
 Forex Fury
1 × $23.00
Forex Fury
1 × $23.00 -
×
 Precision Timing Your Options Trades Using Fibonacci with Trading Analysis
1 × $15.00
Precision Timing Your Options Trades Using Fibonacci with Trading Analysis
1 × $15.00 -
×
 Fibonacci Mastery Course: Complete Guide to Trading with Fib By Todd Gordon
1 × $62.00
Fibonacci Mastery Course: Complete Guide to Trading with Fib By Todd Gordon
1 × $62.00 -
×
 LIVE TRADERS - TECHNICAL STOCK TRADING
1 × $23.00
LIVE TRADERS - TECHNICAL STOCK TRADING
1 × $23.00 -
×
 Exploring MetaStock Basic with Martin Pring
1 × $6.00
Exploring MetaStock Basic with Martin Pring
1 × $6.00 -
×
 High Rollers Mega Course Bundle - 13 Market Moves
1 × $39.00
High Rollers Mega Course Bundle - 13 Market Moves
1 × $39.00 -
×
 ProfileTraders - Swing and Price Analysis (May 2014)
1 × $6.00
ProfileTraders - Swing and Price Analysis (May 2014)
1 × $6.00 -
×
 Market Structure Matters with Haim Bodek
1 × $62.00
Market Structure Matters with Haim Bodek
1 × $62.00 -
×
 Measuring & Controlling Interest Rate & Credit Risk (2nd Ed.) with Frank Fabozzi, Steven Mann & Moorad Choudhry
1 × $6.00
Measuring & Controlling Interest Rate & Credit Risk (2nd Ed.) with Frank Fabozzi, Steven Mann & Moorad Choudhry
1 × $6.00 -
×
 Smart Money with Chart Engineers
1 × $7.00
Smart Money with Chart Engineers
1 × $7.00 -
×
 Forex Patterns and Probabilities: Trading Strategies for Trending and Range-Bound Markets with Ed Ponsi
1 × $6.00
Forex Patterns and Probabilities: Trading Strategies for Trending and Range-Bound Markets with Ed Ponsi
1 × $6.00 -
×
 How to Create & Manage a Mutal Fund or ETF with Melinda Gerber
1 × $6.00
How to Create & Manage a Mutal Fund or ETF with Melinda Gerber
1 × $6.00 -
×
 Guide to Winning with Automated Trading Systems with Jack Schwager
1 × $6.00
Guide to Winning with Automated Trading Systems with Jack Schwager
1 × $6.00 -
×
 Earnings Engine with Sami Abusaad - T3 Live
1 × $6.00
Earnings Engine with Sami Abusaad - T3 Live
1 × $6.00 -
×
 Forex Millionaire Course with Willis University
1 × $6.00
Forex Millionaire Course with Willis University
1 × $6.00 -
×
 How to Buy Stocks Before They Skyrocket
1 × $6.00
How to Buy Stocks Before They Skyrocket
1 × $6.00 -
×
 The Master Indicator 2023 with Lance Ippolito
1 × $101.00
The Master Indicator 2023 with Lance Ippolito
1 × $101.00 -
×
 How To Read The Trend (Recorded Session) with TradeSmart
1 × $31.00
How To Read The Trend (Recorded Session) with TradeSmart
1 × $31.00 -
×
 Rich in America: Secrets to Creating and Preserving Wealth with Jeffrey Maurer
1 × $6.00
Rich in America: Secrets to Creating and Preserving Wealth with Jeffrey Maurer
1 × $6.00 -
×
 Hedge Funds: Insights in Performance Measurement, Risk Analysis, and Portfolio Allocation (1st Edition) - Greg Gregoriou, Georges Hübner, Nicolas Papageorgiou & Fabrice Rouah
1 × $6.00
Hedge Funds: Insights in Performance Measurement, Risk Analysis, and Portfolio Allocation (1st Edition) - Greg Gregoriou, Georges Hübner, Nicolas Papageorgiou & Fabrice Rouah
1 × $6.00 -
×
 Create Your Own ETF Hedge Fund: A Do-It-Yourself ETF Strategy for Private Wealth Management with David Fry
1 × $6.00
Create Your Own ETF Hedge Fund: A Do-It-Yourself ETF Strategy for Private Wealth Management with David Fry
1 × $6.00 -
×
 Common Sense Commodities with David Duty
1 × $6.00
Common Sense Commodities with David Duty
1 × $6.00 -
×
 Street-Smart Chart Reading – Volume 2 – Digging Deeper with Donald G.Worden
1 × $6.00
Street-Smart Chart Reading – Volume 2 – Digging Deeper with Donald G.Worden
1 × $6.00 -
×
 Prasna Tantra. Horary Astrology with Bangalore Venkata Raman
1 × $6.00
Prasna Tantra. Horary Astrology with Bangalore Venkata Raman
1 × $6.00 -
×
 Master Class with Gerald Appel
1 × $6.00
Master Class with Gerald Appel
1 × $6.00 -
×
 Real Motion Trading with MarketGauge
1 × $62.00
Real Motion Trading with MarketGauge
1 × $62.00 -
×
 Gold Trading Academy Video Course
1 × $23.00
Gold Trading Academy Video Course
1 × $23.00 -
×
 Forecast for 2010 with Larry Williams
1 × $6.00
Forecast for 2010 with Larry Williams
1 × $6.00 -
×
 How to Spot Trading Opportunities
1 × $6.00
How to Spot Trading Opportunities
1 × $6.00 -
×
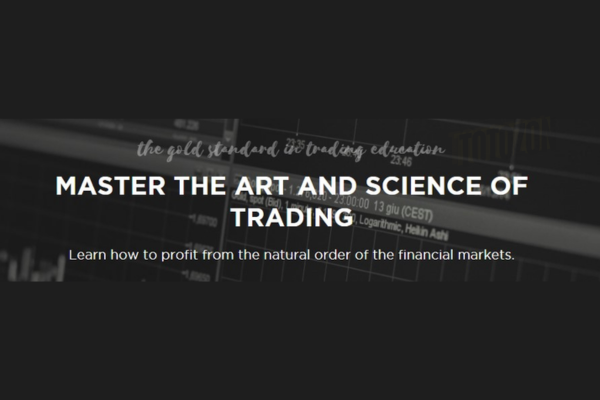 The Gold Standard in Trading Education with Six Figure Capital
1 × $5.00
The Gold Standard in Trading Education with Six Figure Capital
1 × $5.00 -
×
 Investing in Corporate Bonds and Credit Risk with Frank Hagenstein
1 × $6.00
Investing in Corporate Bonds and Credit Risk with Frank Hagenstein
1 × $6.00 -
×
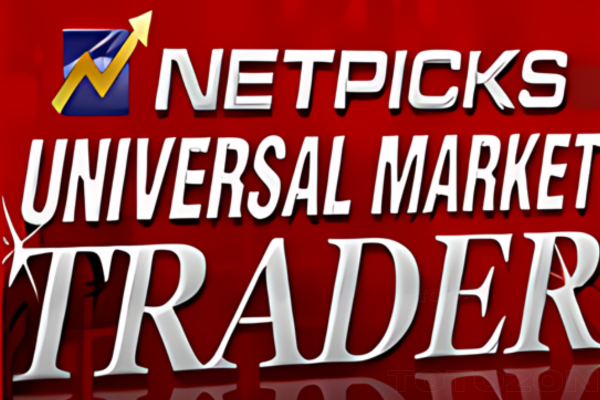 NetPicks - Universal Market Trader Course
1 × $6.00
NetPicks - Universal Market Trader Course
1 × $6.00 -
×
 Learn Investing & Trading with Danny Devan
1 × $23.00
Learn Investing & Trading with Danny Devan
1 × $23.00 -
×
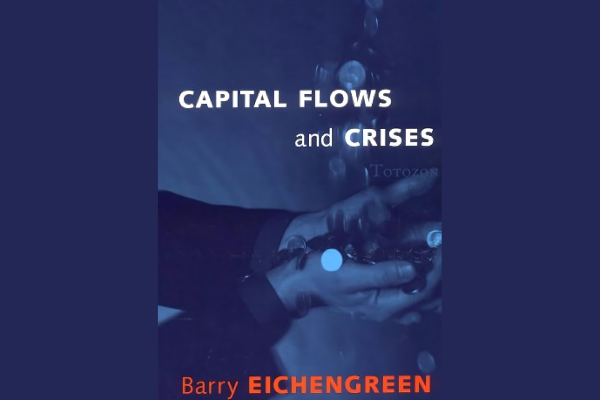 Capital Flows and Crises with Barry Eichengreen
1 × $6.00
Capital Flows and Crises with Barry Eichengreen
1 × $6.00 -
×
 The Offshore Money Book with Arnold Cornez
1 × $6.00
The Offshore Money Book with Arnold Cornez
1 × $6.00 -
×
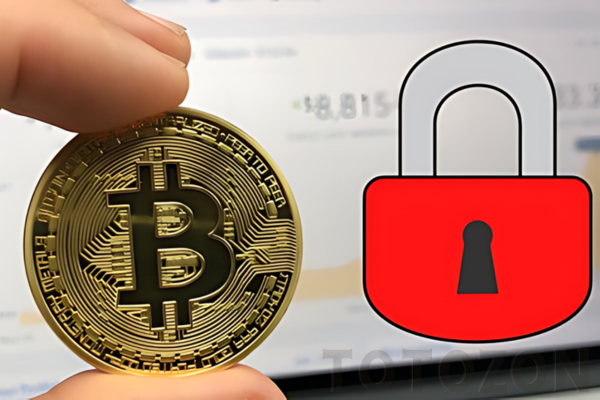 Crypto Trading Cyber Security for Bitcoin & Altcoin Holders with Zlatin Georgiev
1 × $5.00
Crypto Trading Cyber Security for Bitcoin & Altcoin Holders with Zlatin Georgiev
1 × $5.00 -
×
 The 2021 TraderLion Stock Trading Conference with Trader Lion
1 × $5.00
The 2021 TraderLion Stock Trading Conference with Trader Lion
1 × $5.00 -
×
 Renko Profits Accelerator
1 × $15.00
Renko Profits Accelerator
1 × $15.00 -
×
 Candlestick Trading for Maximum Profitsn with B.M.Davis
1 × $6.00
Candlestick Trading for Maximum Profitsn with B.M.Davis
1 × $6.00 -
×
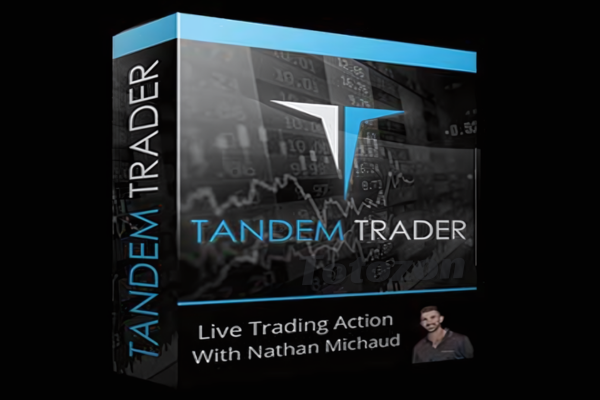 Investors Underground - Tandem Trader
1 × $5.00
Investors Underground - Tandem Trader
1 × $5.00 -
×
 Storehouse Tutorial Group Videos
1 × $23.00
Storehouse Tutorial Group Videos
1 × $23.00 -
×
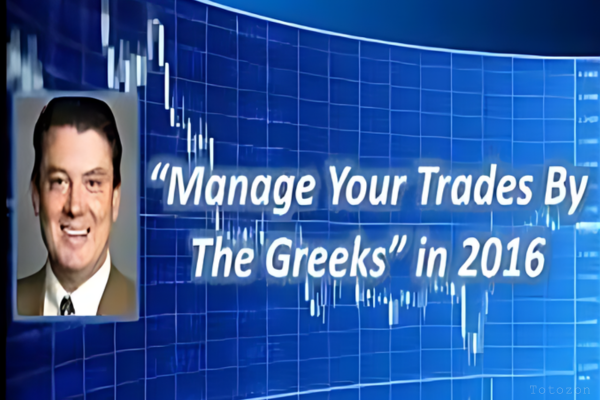 Managing By The Greeks (6 Classes) Sept 2010 [9 Videos(mp4) 11 docs(pdf)] by Dan Sheridan
1 × $6.00
Managing By The Greeks (6 Classes) Sept 2010 [9 Videos(mp4) 11 docs(pdf)] by Dan Sheridan
1 × $6.00 -
×
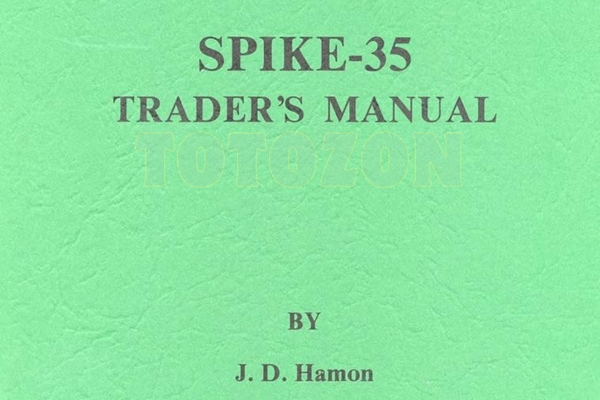 Spike 35 Traders Manual with J.D.Hamon
1 × $6.00
Spike 35 Traders Manual with J.D.Hamon
1 × $6.00 -
×
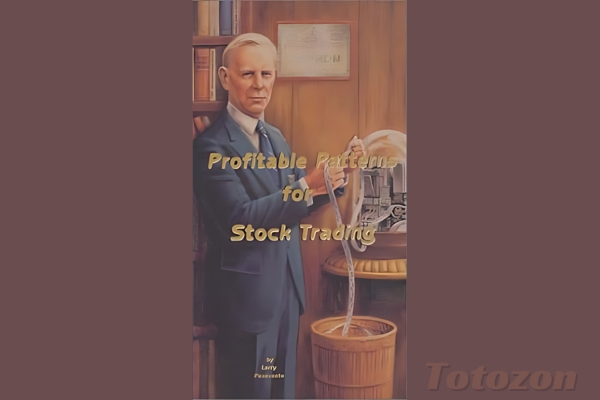 Profitable Patterns for Stock Trading with Larry Pesavento
1 × $6.00
Profitable Patterns for Stock Trading with Larry Pesavento
1 × $6.00 -
×
 Technical Analysis & Options Strategies with K.H.Shaleen
1 × $6.00
Technical Analysis & Options Strategies with K.H.Shaleen
1 × $6.00 -
×
![Strike Zone Trading - Forex Course [81 Videos (MP4) + 96 Software files (EXEEX4MQ4CHRWNDTPL) + 17 DOCS (TXTCSVXLSXPDF) + Images (PNGJPGGIF)]](https://www.totozon.com/wp-content/uploads/2024/05/Strike-Zone-Trading-Forex-Course-81-Videos-MP4-96-Software-files-EXEEX4MQ4CHRWNDTPL-17-DOCS-TXTCSVXLSXPDF-Images-PNGJPGGIF.jpg) Strike Zone Trading - Forex Course [81 Videos (MP4) + 96 Software files (EXE/EX4/MQ4/CHR/WND/TPL) + 17 DOCS (TXT/CSV/XLSX/PDF) + Images (PNG/JPG/GIF)]
1 × $6.00
Strike Zone Trading - Forex Course [81 Videos (MP4) + 96 Software files (EXE/EX4/MQ4/CHR/WND/TPL) + 17 DOCS (TXT/CSV/XLSX/PDF) + Images (PNG/JPG/GIF)]
1 × $6.00 -
×
 Reminiscences of a Stock Operator (75th Aniversary Ed.) with Edwin Lefevre
1 × $6.00
Reminiscences of a Stock Operator (75th Aniversary Ed.) with Edwin Lefevre
1 × $6.00 -
×
 FX GOAT 3.0 (ALL IN ONE) with FX GOAT FOREX TRADING ACADEMY
1 × $5.00
FX GOAT 3.0 (ALL IN ONE) with FX GOAT FOREX TRADING ACADEMY
1 × $5.00 -
×
 Jim Rickards Intelligence Triggers with Agora Financial
1 × $5.00
Jim Rickards Intelligence Triggers with Agora Financial
1 × $5.00 -
×
 Investment Blunders with John Nofsinger
1 × $6.00
Investment Blunders with John Nofsinger
1 × $6.00 -
×
 Risk Stop Loss and Position Size with Daryl Guppy
1 × $6.00
Risk Stop Loss and Position Size with Daryl Guppy
1 × $6.00 -
×
 Crash Course Special Edition Set with Chris Martenson
1 × $6.00
Crash Course Special Edition Set with Chris Martenson
1 × $6.00 -
×
 Risk Management Toolkit with Peter Bain
1 × $6.00
Risk Management Toolkit with Peter Bain
1 × $6.00 -
×
 The Oil Money (open code) (Nov 2013)
1 × $6.00
The Oil Money (open code) (Nov 2013)
1 × $6.00 -
×
 The Insider's Guide to Forex Trading with Kathy Lien
1 × $6.00
The Insider's Guide to Forex Trading with Kathy Lien
1 × $6.00 -
×
 System Building Masterclass
1 × $31.00
System Building Masterclass
1 × $31.00 -
×
 Investing Online with Benton E.Gup
1 × $6.00
Investing Online with Benton E.Gup
1 × $6.00 -
×
 Stock Selection Course with Dave Landry
1 × $6.00
Stock Selection Course with Dave Landry
1 × $6.00 -
×
 The New Technical Trader with Chande Kroll
1 × $6.00
The New Technical Trader with Chande Kroll
1 × $6.00 -
×
 Revolutionary Proven 3 Step with NFTs Cracked
1 × $6.00
Revolutionary Proven 3 Step with NFTs Cracked
1 × $6.00 -
×
 Predicting Market Trends with Alan S.Farley
1 × $6.00
Predicting Market Trends with Alan S.Farley
1 × $6.00 -
×
 Myths of the Free Market with Kenneth Friedman
1 × $6.00
Myths of the Free Market with Kenneth Friedman
1 × $6.00 -
×
 Sang Lucci Master Course 2021 with Sang Lucci
1 × $6.00
Sang Lucci Master Course 2021 with Sang Lucci
1 × $6.00 -
×
 ICT Prodigy Trading Course – $650K in Payouts with Alex Solignani
1 × $15.00
ICT Prodigy Trading Course – $650K in Payouts with Alex Solignani
1 × $15.00 -
×
 Ultimate Trading Course with Dodgy's Dungeon
1 × $8.00
Ultimate Trading Course with Dodgy's Dungeon
1 × $8.00 -
×
 TradeCraft: Your Path to Peak Performance Trading By Adam Grimes
1 × $15.00
TradeCraft: Your Path to Peak Performance Trading By Adam Grimes
1 × $15.00 -
×
 Coulda, woulda, shoulda with Charles Cottle
1 × $6.00
Coulda, woulda, shoulda with Charles Cottle
1 × $6.00 -
×
 SQX Mentorship with Tip Toe Hippo
1 × $23.00
SQX Mentorship with Tip Toe Hippo
1 × $23.00 -
×
 Algo Trading Masterclass with Ali Casey - StatOasis
1 × $23.00
Algo Trading Masterclass with Ali Casey - StatOasis
1 × $23.00 -
×
 Trading Short TermSame Day Trades Sep 2023 with Dan Sheridan & Mark Fenton - Sheridan Options Mentoring
1 × $31.00
Trading Short TermSame Day Trades Sep 2023 with Dan Sheridan & Mark Fenton - Sheridan Options Mentoring
1 × $31.00 -
×
 Deep Dive Butterfly Trading Strategy Class with SJG Trades
1 × $41.00
Deep Dive Butterfly Trading Strategy Class with SJG Trades
1 × $41.00 -
×
 Home Run Options Trading Course with Dave Aquino - Base Camp Trading
1 × $11.00
Home Run Options Trading Course with Dave Aquino - Base Camp Trading
1 × $11.00 -
×
 Emini Day Trading Boot Camp - Base Camp Trading
1 × $6.00
Emini Day Trading Boot Camp - Base Camp Trading
1 × $6.00 -
×
 The Orderflow Masterclass with PrimeTrading
1 × $17.00
The Orderflow Masterclass with PrimeTrading
1 × $17.00
 with Arthur A.Hill")
Introduction to Candlestick (Article) with Arthur A.Hill
$6.00
File Size: Coming soon!
Delivery Time: 1–12 hours
Media Type: Online Course
Content Proof: Watch Here!
You may check content proof of “Introduction to Candlestick (Article) with Arthur A.Hill” below:
 with Arthur A.Hill")
Introduction to Candlestick (Article) with Arthur A. Hill
Candlestick charting is an essential tool for traders and investors, providing a visual representation of price movements. Arthur A. Hill, a renowned expert in technical analysis, offers a comprehensive introduction to candlestick charts, making them accessible to beginners and valuable for experienced traders. Let’s explore the basics of candlestick charting and how it can enhance your trading strategy.
What is a Candlestick Chart?
A candlestick chart is a type of financial chart used to describe price movements of a security, derivative, or currency.
Components of a Candlestick
- Body: The thick part of the candlestick, showing the opening and closing prices.
- Wicks/Shadows: The thin lines above and below the body, indicating the highest and lowest prices during the period.
- Color: Traditionally, a green or white body indicates a closing price higher than the opening price, while a red or black body indicates a closing price lower than the opening price.
History of Candlestick Charting
Candlestick charting originated in Japan over 300 years ago, developed by rice traders to track market prices and daily supply and demand.
Evolution of Candlestick Charts
Over the centuries, candlestick charting has evolved and gained popularity worldwide, becoming a staple in technical analysis.
Introduction to Western Markets
Candlestick charts were introduced to the Western financial markets in the late 20th century and quickly became popular among traders.
Advantages of Candlestick Charts
Candlestick charts offer several advantages over traditional bar charts and line charts.
Visual Clarity
Candlestick charts provide a clear and concise representation of price movements, making it easier to interpret market trends.
Immediate Insight
The color-coded bodies and wicks offer immediate insight into market sentiment and price direction.
Pattern Recognition
Candlestick charts are excellent for identifying patterns that can predict future price movements.
Common Candlestick Patterns
- Doji: Indicates indecision in the market.
- Hammer: Suggests a potential reversal from a downtrend.
- Engulfing: A strong signal of a potential trend reversal.
Basic Candlestick Patterns
Understanding basic candlestick patterns is crucial for any trader looking to use this charting method effectively.
Bullish Patterns
Bullish patterns indicate potential upward price movements.
Hammer and Inverted Hammer
- Hammer: A candlestick with a small body and a long lower wick, indicating potential reversal from a downtrend.
- Inverted Hammer: Similar to the hammer but with a long upper wick, suggesting a potential bullish reversal.
Bearish Patterns
Bearish patterns suggest potential downward price movements.
Shooting Star and Hanging Man
- Shooting Star: A candlestick with a small body and a long upper wick, indicating a potential reversal from an uptrend.
- Hanging Man: Similar to the hammer but occurs after an uptrend, signaling a potential bearish reversal.
Advanced Candlestick Patterns
For more experienced traders, advanced candlestick patterns provide deeper insights into market trends.
Engulfing Patterns
Engulfing patterns occur when a smaller candlestick is followed by a larger candlestick that completely engulfs the smaller one.
Bullish Engulfing
A bullish engulfing pattern occurs at the bottom of a downtrend and signals a potential upward reversal.
Bearish Engulfing
A bearish engulfing pattern appears at the top of an uptrend and suggests a potential downward reversal.
Morning Star and Evening Star
These patterns are three-candlestick formations that indicate strong trend reversals.
Morning Star
The morning star pattern consists of a bearish candle, a small indecisive candle, and a bullish candle, indicating a bullish reversal.
Evening Star
The evening star pattern includes a bullish candle, a small indecisive candle, and a bearish candle, suggesting a bearish reversal.
Incorporating Candlestick Charts into Your Trading Strategy
Candlestick charts are versatile and can be integrated into various trading strategies.
Combining with Other Indicators
Enhance the effectiveness of candlestick charts by combining them with other technical indicators.
Popular Indicators to Combine
- Moving Averages: Confirm trends and potential reversals.
- Relative Strength Index (RSI): Identify overbought or oversold conditions.
- Bollinger Bands: Measure market volatility and potential breakouts.
Setting Up Your Trading Platform
Most trading platforms offer candlestick charting options. Ensure you customize your charts to suit your trading style.
Customization Tips
- Time Frames: Choose appropriate time frames for your trading strategy.
- Color Schemes: Use distinct colors for bullish and bearish candles.
- Indicators: Add complementary indicators to your charts.
Common Mistakes to Avoid
Even with a robust understanding of candlestick charts, traders can make mistakes that affect their performance.
Over-reliance on Patterns
Relying solely on candlestick patterns without considering other factors can lead to false signals.
Diversify Analysis
Always use candlestick patterns in conjunction with other forms of analysis and market indicators.
Ignoring Market Context
Candlestick patterns can be misleading if not considered within the broader market context.
Comprehensive Analysis
Incorporate fundamental analysis and overall market trends to validate candlestick signals.
Conclusion
Candlestick charting, as introduced by Arthur A. Hill, offers a powerful tool for traders to understand and predict market movements. By mastering basic and advanced patterns, combining them with other technical indicators, and avoiding common pitfalls, traders can enhance their market analysis and trading performance. Whether you’re new to trading or an experienced trader, candlestick charts provide valuable insights that can guide your investment decisions.
Frequently Asked Questions:
- What is a candlestick chart?
A candlestick chart is a type of financial chart used to represent price movements over a specific period, showing the opening, closing, high, and low prices. - Why are candlestick charts popular among traders?
They provide visual clarity and help in identifying patterns that can predict future price movements. - What are some basic candlestick patterns?
Basic patterns include the hammer, inverted hammer, shooting star, and hanging man, which indicate potential market reversals. - Can candlestick charts be used with other technical indicators?
Yes, combining candlestick charts with indicators like moving averages, RSI, and Bollinger Bands enhances their effectiveness. - How can I avoid common mistakes when using candlestick charts?
Avoid over-relying on patterns and always consider the broader market context and other forms of analysis.
Be the first to review “Introduction to Candlestick (Article) with Arthur A.Hill”
You must be logged in to post a review.
Related products
Forex Trading
Original price was: $125.00.$17.00Current price is: $17.00.

Original price was: $799.00.$15.00Current price is: $15.00.

Forex Trading
Original price was: $499.00.$15.00Current price is: $15.00.
Original price was: $695.00.$41.00Current price is: $41.00.

Original price was: $997.00.$8.00Current price is: $8.00.
Original price was: $2,120.00.$15.00Current price is: $15.00.

Forex Trading
Original price was: $697.00.$5.00Current price is: $5.00.

Original price was: $497.00.$31.00Current price is: $31.00.

Forex Trading
Original price was: $2,995.00.$31.00Current price is: $31.00.

Forex Trading
Original price was: $797.00.$10.00Current price is: $10.00.

Original price was: $1,200.00.$23.00Current price is: $23.00.
Forex Trading
Original price was: $2,997.00.$23.00Current price is: $23.00.

Forex Trading
Quantamentals – The Next Great Forefront Of Trading and Investing with Trading Markets
Original price was: $1,495.00.$8.00Current price is: $8.00.

Forex Trading
Original price was: $999.00.$15.00Current price is: $15.00.

Original price was: $649.00.$20.00Current price is: $20.00.

Original price was: $997.00.$13.00Current price is: $13.00.

Original price was: $450.00.$23.00Current price is: $23.00.

Original price was: $1,849.00.$15.00Current price is: $15.00.

Forex Trading
Original price was: $500.00.$5.00Current price is: $5.00.

Original price was: $999.00.$5.00Current price is: $5.00.

Reviews
There are no reviews yet.