-
×
 AI For Traders with Trading Markets
1 × $31.00
AI For Traders with Trading Markets
1 × $31.00 -
×
 WondaFX Signature Strategy with WondaFX
1 × $5.00
WondaFX Signature Strategy with WondaFX
1 × $5.00 -
×
 How To Read The Market Professionally with TradeSmart
1 × $27.00
How To Read The Market Professionally with TradeSmart
1 × $27.00 -
×
 Trade Like a Stock Market Wizard with Mark Minervini
1 × $6.00
Trade Like a Stock Market Wizard with Mark Minervini
1 × $6.00 -
×
 The Alvarez Factor
1 × $23.00
The Alvarez Factor
1 × $23.00 -
×
 Quantamentals - The Next Great Forefront Of Trading and Investing with Trading Markets
1 × $8.00
Quantamentals - The Next Great Forefront Of Trading and Investing with Trading Markets
1 × $8.00 -
×
 The Indices Orderflow Masterclass with The Forex Scalpers
1 × $23.00
The Indices Orderflow Masterclass with The Forex Scalpers
1 × $23.00 -
×
 The Naked Eye: Raw Data Analytics with Edgar Torres - Raw Data Analytics
1 × $8.00
The Naked Eye: Raw Data Analytics with Edgar Torres - Raw Data Analytics
1 × $8.00 -
×
 ICT Prodigy Trading Course – $650K in Payouts with Alex Solignani
1 × $15.00
ICT Prodigy Trading Course – $650K in Payouts with Alex Solignani
1 × $15.00 -
×
 Options Trading & Ultimate MasterClass With Tyrone Abela - FX Evolution
1 × $54.00
Options Trading & Ultimate MasterClass With Tyrone Abela - FX Evolution
1 × $54.00 -
×
 Essentials in Quantitative Trading QT01 By HangukQuant's
1 × $23.00
Essentials in Quantitative Trading QT01 By HangukQuant's
1 × $23.00 -
×
 Master The Art of Technical Analysis with Raul Gonzalez
1 × $31.00
Master The Art of Technical Analysis with Raul Gonzalez
1 × $31.00 -
×
 TradeCraft: Your Path to Peak Performance Trading By Adam Grimes
1 × $15.00
TradeCraft: Your Path to Peak Performance Trading By Adam Grimes
1 × $15.00 -
×
 Measuring & Controlling Interest Rate & Credit Risk (2nd Ed.) with Frank Fabozzi, Steven Mann & Moorad Choudhry
1 × $6.00
Measuring & Controlling Interest Rate & Credit Risk (2nd Ed.) with Frank Fabozzi, Steven Mann & Moorad Choudhry
1 × $6.00 -
×
 $20 – 52k 20 pips a day challange with Rafał Zuchowicz - TopMasterTrader
1 × $5.00
$20 – 52k 20 pips a day challange with Rafał Zuchowicz - TopMasterTrader
1 × $5.00 -
×
 The Connors Research Volatility Trading Strategy Summit
1 × $85.00
The Connors Research Volatility Trading Strategy Summit
1 × $85.00 -
×
 Extreme Events: Robust Portfolio Construction in the Presence of Fat Tails with Malcolm Kemp
1 × $6.00
Extreme Events: Robust Portfolio Construction in the Presence of Fat Tails with Malcolm Kemp
1 × $6.00 -
×
 Forecast 2024 Clarification with Larry Williams
1 × $15.00
Forecast 2024 Clarification with Larry Williams
1 × $15.00 -
×
 Deep Dive Butterfly Trading Strategy Class with SJG Trades
1 × $41.00
Deep Dive Butterfly Trading Strategy Class with SJG Trades
1 × $41.00 -
×
 Ultimate Trading Course with Dodgy's Dungeon
1 × $8.00
Ultimate Trading Course with Dodgy's Dungeon
1 × $8.00 -
×
 Order flow self-study training program with iMFtracker
1 × $10.00
Order flow self-study training program with iMFtracker
1 × $10.00 -
×
 The Orderflow Masterclass with PrimeTrading
1 × $17.00
The Orderflow Masterclass with PrimeTrading
1 × $17.00 -
×
 Home Run Options Trading Course with Dave Aquino - Base Camp Trading
1 × $11.00
Home Run Options Trading Course with Dave Aquino - Base Camp Trading
1 × $11.00 -
×
 The Trading Blueprint with Brad Goh - The Trading Geek
1 × $5.00
The Trading Blueprint with Brad Goh - The Trading Geek
1 × $5.00 -
×
 White Phoenix’s The Smart (Money) Approach to Trading with Jayson Casper
1 × $39.00
White Phoenix’s The Smart (Money) Approach to Trading with Jayson Casper
1 × $39.00 -
×
 Butterfly and Condor Workshop with Aeromir
1 × $15.00
Butterfly and Condor Workshop with Aeromir
1 × $15.00 -
×
 Brand new for 2017 - “Renko 2.0” with Nikos Mermigas & Jeff Wilde
1 × $23.00
Brand new for 2017 - “Renko 2.0” with Nikos Mermigas & Jeff Wilde
1 × $23.00 -
×
 TRADING NFX Course with Andrew NFX
1 × $5.00
TRADING NFX Course with Andrew NFX
1 × $5.00 -
×
 Compass Trading System with Right Line Trading
1 × $39.00
Compass Trading System with Right Line Trading
1 × $39.00 -
×
 Crypto Trading Academy with Cheeky Investor - Aussie Day Trader
1 × $13.00
Crypto Trading Academy with Cheeky Investor - Aussie Day Trader
1 × $13.00 -
×
 The Complete Guide to Multiple Time Frame Analysis & Reading Price Action with Aiman Almansoori
1 × $13.00
The Complete Guide to Multiple Time Frame Analysis & Reading Price Action with Aiman Almansoori
1 × $13.00 -
×
 The Orderflows Trade Opportunities Encyclopedia with Michael Valtos
1 × $8.00
The Orderflows Trade Opportunities Encyclopedia with Michael Valtos
1 × $8.00 -
×
 The Best Option Trading Course with David Jaffee - Best Stock Strategy
1 × $15.00
The Best Option Trading Course with David Jaffee - Best Stock Strategy
1 × $15.00 -
×
 Foundations of Stock & Options. Home Study Course
1 × $6.00
Foundations of Stock & Options. Home Study Course
1 × $6.00 -
×
 The Prop Trading Code with Brannigan Barrett - Axia Futures
1 × $23.00
The Prop Trading Code with Brannigan Barrett - Axia Futures
1 × $23.00 -
×
 Market Controller Course with Controller FX
1 × $5.00
Market Controller Course with Controller FX
1 × $5.00 -
×
 Advanced Spread Trading with Guy Bower - MasterClass Trader
1 × $15.00
Advanced Spread Trading with Guy Bower - MasterClass Trader
1 × $15.00 -
×
 Module II - Signature Trades with FX MindShift
1 × $6.00
Module II - Signature Trades with FX MindShift
1 × $6.00 -
×
 Stochastic Calculus with Alan Bain
1 × $6.00
Stochastic Calculus with Alan Bain
1 × $6.00 -
×
 Bond Market Course with The Macro Compass
1 × $15.00
Bond Market Course with The Macro Compass
1 × $15.00 -
×
 High Yield Investments I & II with Lance Spicer
1 × $6.00
High Yield Investments I & II with Lance Spicer
1 × $6.00 -
×
 Studies in Stock Speculation (Volume I & II) with H.J.Wolf
1 × $6.00
Studies in Stock Speculation (Volume I & II) with H.J.Wolf
1 × $6.00 -
×
 SI Indicator Course 2023 with Scott Pulcini
1 × $15.00
SI Indicator Course 2023 with Scott Pulcini
1 × $15.00 -
×
 Robotic trading interactive
1 × $31.00
Robotic trading interactive
1 × $31.00 -
×
 Swing Trading Systems Video Home Study, Presented with Ken Long - Van Tharp Institute
1 × $5.00
Swing Trading Systems Video Home Study, Presented with Ken Long - Van Tharp Institute
1 × $5.00 -
×
 Essentials Home Study Kit with J.L.Lord - Random Walk Trading
1 × $23.00
Essentials Home Study Kit with J.L.Lord - Random Walk Trading
1 × $23.00 -
×
 Trading Short TermSame Day Trades Sep 2023 with Dan Sheridan & Mark Fenton - Sheridan Options Mentoring
1 × $31.00
Trading Short TermSame Day Trades Sep 2023 with Dan Sheridan & Mark Fenton - Sheridan Options Mentoring
1 × $31.00 -
×
 SQX Mentorship with Tip Toe Hippo
1 × $23.00
SQX Mentorship with Tip Toe Hippo
1 × $23.00 -
×
 HunterFX Video Course with HunterFX
1 × $6.00
HunterFX Video Course with HunterFX
1 × $6.00 -
×
 Best of the Best: Collars with Amy Meissner & Scott Ruble
1 × $15.00
Best of the Best: Collars with Amy Meissner & Scott Ruble
1 × $15.00 -
×
 Matrix Spread Options Trading Course with Base Camp Trading
1 × $31.00
Matrix Spread Options Trading Course with Base Camp Trading
1 × $31.00 -
×
 Credit Spreads Deep Dive with Jay Bailey - Sheridan Options Mentoring
1 × $31.00
Credit Spreads Deep Dive with Jay Bailey - Sheridan Options Mentoring
1 × $31.00 -
×
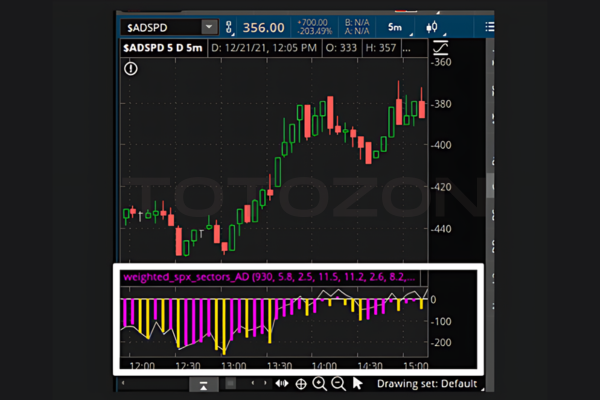 ShadowTrader Weighted S&P Advance Decline Line thinkScript with Peter Reznicek - ShadowTrader
1 × $23.00
ShadowTrader Weighted S&P Advance Decline Line thinkScript with Peter Reznicek - ShadowTrader
1 × $23.00 -
×
 W. D Gann 's Square Of 9 Applied To Modern Markets with Sean Avidar - Hexatrade350
1 × $23.00
W. D Gann 's Square Of 9 Applied To Modern Markets with Sean Avidar - Hexatrade350
1 × $23.00 -
×
 The Banker’s Edge Webinar & Extras
1 × $6.00
The Banker’s Edge Webinar & Extras
1 × $6.00 -
×
 Module IV - Day Trading to Short Term Swing Trades with FX MindShift
1 × $6.00
Module IV - Day Trading to Short Term Swing Trades with FX MindShift
1 × $6.00 -
×
 Algo Trading Masterclass with Ali Casey - StatOasis
1 × $23.00
Algo Trading Masterclass with Ali Casey - StatOasis
1 × $23.00 -
×
 Beginner to Intermediate Intensive Q and A with Rob Hoffman
1 × $6.00
Beginner to Intermediate Intensive Q and A with Rob Hoffman
1 × $6.00 -
×
 SE ELITE COURSE with SE TRADINGX
1 × $5.00
SE ELITE COURSE with SE TRADINGX
1 × $5.00 -
×
 Scalp Strategy and Flipping Small Accounts with Opes Trading Group
1 × $5.00
Scalp Strategy and Flipping Small Accounts with Opes Trading Group
1 × $5.00 -
×
 Futures 101: An Introduction to Futures Contracts Class with Don Kaufman
1 × $6.00
Futures 101: An Introduction to Futures Contracts Class with Don Kaufman
1 × $6.00 -
×
 MTI - Basics UTP
1 × $6.00
MTI - Basics UTP
1 × $6.00 -
×
 The A14 Weekly Option Strategy Workshop with Amy Meissner
1 × $23.00
The A14 Weekly Option Strategy Workshop with Amy Meissner
1 × $23.00 -
×
 Encyclopedia of Planetary Aspects for Short Term TradingPatrick Mikula – Encyclopedia of Planetary Aspects for Short Term Trading
1 × $4.00
Encyclopedia of Planetary Aspects for Short Term TradingPatrick Mikula – Encyclopedia of Planetary Aspects for Short Term Trading
1 × $4.00 -
×
 The Greatest Trade Ever with Gregory Zuckerman
1 × $6.00
The Greatest Trade Ever with Gregory Zuckerman
1 × $6.00 -
×
 Introduction to Technical Analysis with Jake Bernstein
1 × $6.00
Introduction to Technical Analysis with Jake Bernstein
1 × $6.00 -
×
 Bubbleology: The New Science of Stock Market Winners and Losers with Kevin Hassett
1 × $6.00
Bubbleology: The New Science of Stock Market Winners and Losers with Kevin Hassett
1 × $6.00 -
×
 FX GOAT 3.0 (ALL IN ONE) with FX GOAT FOREX TRADING ACADEMY
1 × $5.00
FX GOAT 3.0 (ALL IN ONE) with FX GOAT FOREX TRADING ACADEMY
1 × $5.00 -
×
 Making Sense of Price Action: Price Action Profits with Scott Foster
1 × $54.00
Making Sense of Price Action: Price Action Profits with Scott Foster
1 × $54.00 -
×
 Capital On Demand Masterclass with Attorney & Nate Dodson
1 × $311.00
Capital On Demand Masterclass with Attorney & Nate Dodson
1 × $311.00 -
×
 Rob’s 6 Day 21 Set-up Course with Rob Hoffman
1 × $85.00
Rob’s 6 Day 21 Set-up Course with Rob Hoffman
1 × $85.00 -
×
 Successful Stock Speculation (1922) with John James
1 × $6.00
Successful Stock Speculation (1922) with John James
1 × $6.00 -
×
 TenfoldFX Academy Course with Kenneth John
1 × $17.00
TenfoldFX Academy Course with Kenneth John
1 × $17.00 -
×
 RTM + Suppy and Demand with Nora Bystra
1 × $6.00
RTM + Suppy and Demand with Nora Bystra
1 × $6.00 -
×
 Candlestick Patterns to Master Forex Trading Price Action with Federico Sellitti
1 × $6.00
Candlestick Patterns to Master Forex Trading Price Action with Federico Sellitti
1 × $6.00 -
×
 Crystal Ball Pack PLUS bonus Live Trade By Pat Mitchell - Trick Trades
1 × $20.00
Crystal Ball Pack PLUS bonus Live Trade By Pat Mitchell - Trick Trades
1 × $20.00 -
×
 Forex Trading Strategies Modules 1-3 Complete Set with Blake Young - Shadow Trader
1 × $54.00
Forex Trading Strategies Modules 1-3 Complete Set with Blake Young - Shadow Trader
1 × $54.00 -
×
 AutoTrader-Fully Automated Trading System with Trading123
1 × $46.00
AutoTrader-Fully Automated Trading System with Trading123
1 × $46.00 -
×
 Spyglass LSS Day Trading Workshop
1 × $15.00
Spyglass LSS Day Trading Workshop
1 × $15.00 -
×
 DAY TRADE (LONG & SHORT) STRATEGIES PACKAGE - The Chartist
1 × $272.00
DAY TRADE (LONG & SHORT) STRATEGIES PACKAGE - The Chartist
1 × $272.00 -
×
 0 DTE Options Trading Workshop with Aeromir Corporation
1 × $15.00
0 DTE Options Trading Workshop with Aeromir Corporation
1 × $15.00 -
×
 The Future of Investing with Chris Skinner
1 × $6.00
The Future of Investing with Chris Skinner
1 × $6.00 -
×
 How To Create Your Own Trading Strategy with Simon Klein - Trade Smart
1 × $5.00
How To Create Your Own Trading Strategy with Simon Klein - Trade Smart
1 × $5.00 -
×
 Forty Cents for Financial Freedom with Darlene Nelson
1 × $6.00
Forty Cents for Financial Freedom with Darlene Nelson
1 × $6.00 -
×
 The Best of the Professional Traders Journal: Options Trading and Volatility Trading with Larry Connors
1 × $6.00
The Best of the Professional Traders Journal: Options Trading and Volatility Trading with Larry Connors
1 × $6.00 -
×
 Ichimokutrade - Ichimoku 101
1 × $15.00
Ichimokutrade - Ichimoku 101
1 × $15.00 -
×
 SNR Trader Course with Ariff T
1 × $6.00
SNR Trader Course with Ariff T
1 × $6.00 -
×
 Targeting Profitable Entry & Exit Points with Alan Farley
1 × $6.00
Targeting Profitable Entry & Exit Points with Alan Farley
1 × $6.00 -
×
 An Introduction to Option Trading Success with James Bittman
1 × $6.00
An Introduction to Option Trading Success with James Bittman
1 × $6.00 -
×
 Active Trader Program (Smarter Starter Pack + the Number One Trading Plan)
1 × $15.00
Active Trader Program (Smarter Starter Pack + the Number One Trading Plan)
1 × $15.00 -
×
 Key to Speculation on the New York Stock Exchange
1 × $6.00
Key to Speculation on the New York Stock Exchange
1 × $6.00 -
×
 High Probability Trading Using Elliott Wave And Fibonacci Analysis withVic Patel - Forex Training Group
1 × $10.00
High Probability Trading Using Elliott Wave And Fibonacci Analysis withVic Patel - Forex Training Group
1 × $10.00
 with Arthur A.Hill")
Introduction to Candlestick (Article) with Arthur A.Hill
$6.00
File Size: Coming soon!
Delivery Time: 1–12 hours
Media Type: Online Course
Content Proof: Watch Here!
You may check content proof of “Introduction to Candlestick (Article) with Arthur A.Hill” below:
 with Arthur A.Hill")
Introduction to Candlestick (Article) with Arthur A. Hill
Candlestick charting is an essential tool for traders and investors, providing a visual representation of price movements. Arthur A. Hill, a renowned expert in technical analysis, offers a comprehensive introduction to candlestick charts, making them accessible to beginners and valuable for experienced traders. Let’s explore the basics of candlestick charting and how it can enhance your trading strategy.
What is a Candlestick Chart?
A candlestick chart is a type of financial chart used to describe price movements of a security, derivative, or currency.
Components of a Candlestick
- Body: The thick part of the candlestick, showing the opening and closing prices.
- Wicks/Shadows: The thin lines above and below the body, indicating the highest and lowest prices during the period.
- Color: Traditionally, a green or white body indicates a closing price higher than the opening price, while a red or black body indicates a closing price lower than the opening price.
History of Candlestick Charting
Candlestick charting originated in Japan over 300 years ago, developed by rice traders to track market prices and daily supply and demand.
Evolution of Candlestick Charts
Over the centuries, candlestick charting has evolved and gained popularity worldwide, becoming a staple in technical analysis.
Introduction to Western Markets
Candlestick charts were introduced to the Western financial markets in the late 20th century and quickly became popular among traders.
Advantages of Candlestick Charts
Candlestick charts offer several advantages over traditional bar charts and line charts.
Visual Clarity
Candlestick charts provide a clear and concise representation of price movements, making it easier to interpret market trends.
Immediate Insight
The color-coded bodies and wicks offer immediate insight into market sentiment and price direction.
Pattern Recognition
Candlestick charts are excellent for identifying patterns that can predict future price movements.
Common Candlestick Patterns
- Doji: Indicates indecision in the market.
- Hammer: Suggests a potential reversal from a downtrend.
- Engulfing: A strong signal of a potential trend reversal.
Basic Candlestick Patterns
Understanding basic candlestick patterns is crucial for any trader looking to use this charting method effectively.
Bullish Patterns
Bullish patterns indicate potential upward price movements.
Hammer and Inverted Hammer
- Hammer: A candlestick with a small body and a long lower wick, indicating potential reversal from a downtrend.
- Inverted Hammer: Similar to the hammer but with a long upper wick, suggesting a potential bullish reversal.
Bearish Patterns
Bearish patterns suggest potential downward price movements.
Shooting Star and Hanging Man
- Shooting Star: A candlestick with a small body and a long upper wick, indicating a potential reversal from an uptrend.
- Hanging Man: Similar to the hammer but occurs after an uptrend, signaling a potential bearish reversal.
Advanced Candlestick Patterns
For more experienced traders, advanced candlestick patterns provide deeper insights into market trends.
Engulfing Patterns
Engulfing patterns occur when a smaller candlestick is followed by a larger candlestick that completely engulfs the smaller one.
Bullish Engulfing
A bullish engulfing pattern occurs at the bottom of a downtrend and signals a potential upward reversal.
Bearish Engulfing
A bearish engulfing pattern appears at the top of an uptrend and suggests a potential downward reversal.
Morning Star and Evening Star
These patterns are three-candlestick formations that indicate strong trend reversals.
Morning Star
The morning star pattern consists of a bearish candle, a small indecisive candle, and a bullish candle, indicating a bullish reversal.
Evening Star
The evening star pattern includes a bullish candle, a small indecisive candle, and a bearish candle, suggesting a bearish reversal.
Incorporating Candlestick Charts into Your Trading Strategy
Candlestick charts are versatile and can be integrated into various trading strategies.
Combining with Other Indicators
Enhance the effectiveness of candlestick charts by combining them with other technical indicators.
Popular Indicators to Combine
- Moving Averages: Confirm trends and potential reversals.
- Relative Strength Index (RSI): Identify overbought or oversold conditions.
- Bollinger Bands: Measure market volatility and potential breakouts.
Setting Up Your Trading Platform
Most trading platforms offer candlestick charting options. Ensure you customize your charts to suit your trading style.
Customization Tips
- Time Frames: Choose appropriate time frames for your trading strategy.
- Color Schemes: Use distinct colors for bullish and bearish candles.
- Indicators: Add complementary indicators to your charts.
Common Mistakes to Avoid
Even with a robust understanding of candlestick charts, traders can make mistakes that affect their performance.
Over-reliance on Patterns
Relying solely on candlestick patterns without considering other factors can lead to false signals.
Diversify Analysis
Always use candlestick patterns in conjunction with other forms of analysis and market indicators.
Ignoring Market Context
Candlestick patterns can be misleading if not considered within the broader market context.
Comprehensive Analysis
Incorporate fundamental analysis and overall market trends to validate candlestick signals.
Conclusion
Candlestick charting, as introduced by Arthur A. Hill, offers a powerful tool for traders to understand and predict market movements. By mastering basic and advanced patterns, combining them with other technical indicators, and avoiding common pitfalls, traders can enhance their market analysis and trading performance. Whether you’re new to trading or an experienced trader, candlestick charts provide valuable insights that can guide your investment decisions.
Frequently Asked Questions:
- What is a candlestick chart?
A candlestick chart is a type of financial chart used to represent price movements over a specific period, showing the opening, closing, high, and low prices. - Why are candlestick charts popular among traders?
They provide visual clarity and help in identifying patterns that can predict future price movements. - What are some basic candlestick patterns?
Basic patterns include the hammer, inverted hammer, shooting star, and hanging man, which indicate potential market reversals. - Can candlestick charts be used with other technical indicators?
Yes, combining candlestick charts with indicators like moving averages, RSI, and Bollinger Bands enhances their effectiveness. - How can I avoid common mistakes when using candlestick charts?
Avoid over-relying on patterns and always consider the broader market context and other forms of analysis.
Be the first to review “Introduction to Candlestick (Article) with Arthur A.Hill”
You must be logged in to post a review.
Related products
Forex Trading
Original price was: $397.00.$31.00Current price is: $31.00.
Forex Trading
Original price was: $499.00.$15.00Current price is: $15.00.
Original price was: $649.00.$20.00Current price is: $20.00.
Original price was: $997.00.$8.00Current price is: $8.00.
Forex Trading
Original price was: $550.00.$5.00Current price is: $5.00.
Forex Trading
Original price was: $2,995.00.$31.00Current price is: $31.00.
Forex Trading
Original price was: $2,997.00.$23.00Current price is: $23.00.
Forex Trading
Original price was: $797.00.$10.00Current price is: $10.00.
Forex Trading
Original price was: $697.00.$5.00Current price is: $5.00.
Forex Trading
Original price was: $799.00.$15.00Current price is: $15.00.
Original price was: $799.00.$15.00Current price is: $15.00.
Original price was: $895.00.$15.00Current price is: $15.00.
Forex Trading
Original price was: $1,098.00.$39.00Current price is: $39.00.
Forex Trading
Original price was: $999.00.$15.00Current price is: $15.00.
Forex Trading
Original price was: $239.00.$8.00Current price is: $8.00.
Forex Trading
Original price was: $500.00.$5.00Current price is: $5.00.
Original price was: $695.00.$41.00Current price is: $41.00.
Original price was: $139.00.$23.00Current price is: $23.00.
Forex Trading
Quantamentals – The Next Great Forefront Of Trading and Investing with Trading Markets
Original price was: $1,495.00.$8.00Current price is: $8.00.
Original price was: $700.00.$39.00Current price is: $39.00.

Reviews
There are no reviews yet.