-
×
 The Adventures of the Cycle Hunter. The Cyclist with Craig Bttlc
1 × $6.00
The Adventures of the Cycle Hunter. The Cyclist with Craig Bttlc
1 × $6.00 -
×
 Scalp Strategy and Flipping Small Accounts with Opes Trading Group
1 × $5.00
Scalp Strategy and Flipping Small Accounts with Opes Trading Group
1 × $5.00 -
×
 W. D Gann 's Square Of 9 Applied To Modern Markets with Sean Avidar - Hexatrade350
1 × $23.00
W. D Gann 's Square Of 9 Applied To Modern Markets with Sean Avidar - Hexatrade350
1 × $23.00 -
×
 Markets In Motion with Ned Davis
1 × $6.00
Markets In Motion with Ned Davis
1 × $6.00 -
×
 Dan Dowd Trading
1 × $5.00
Dan Dowd Trading
1 × $5.00 -
×
 Quantamentals - The Next Great Forefront Of Trading and Investing with Trading Markets
1 × $8.00
Quantamentals - The Next Great Forefront Of Trading and Investing with Trading Markets
1 × $8.00 -
×
 Secrets of a Winning Trader with Gareth Soloway
1 × $871.00
Secrets of a Winning Trader with Gareth Soloway
1 × $871.00 -
×
 The Complete Guide to Multiple Time Frame Analysis & Reading Price Action with Aiman Almansoori
1 × $13.00
The Complete Guide to Multiple Time Frame Analysis & Reading Price Action with Aiman Almansoori
1 × $13.00 -
×
 $20 – 52k 20 pips a day challange with Rafał Zuchowicz - TopMasterTrader
1 × $5.00
$20 – 52k 20 pips a day challange with Rafał Zuchowicz - TopMasterTrader
1 × $5.00 -
×
 Advanced Technical Strategies Home Study Course with T3 LIVE
1 × $31.00
Advanced Technical Strategies Home Study Course with T3 LIVE
1 × $31.00 -
×
 Quarterly Theory with Trader Daye
1 × $20.00
Quarterly Theory with Trader Daye
1 × $20.00 -
×
 The Great Depression with David Burg
1 × $6.00
The Great Depression with David Burg
1 × $6.00 -
×
 Futures Spreads Crash Course with Base Camp Trading
1 × $54.00
Futures Spreads Crash Course with Base Camp Trading
1 × $54.00 -
×
 Quantifiable Edges – Gold Subscription with Rob Hanna
1 × $54.00
Quantifiable Edges – Gold Subscription with Rob Hanna
1 × $54.00 -
×
 90 Days To Trade MasterClass with Jerremy Newsome & Matt Delong - Real Life Trading
1 × $104.00
90 Days To Trade MasterClass with Jerremy Newsome & Matt Delong - Real Life Trading
1 × $104.00 -
×
 Profit in the Futures Markets! with Jack Bernstein
1 × $6.00
Profit in the Futures Markets! with Jack Bernstein
1 × $6.00 -
×
 The Prop Trading Code with Brannigan Barrett - Axia Futures
1 × $23.00
The Prop Trading Code with Brannigan Barrett - Axia Futures
1 × $23.00 -
×
 How To Read The Market Professionally with TradeSmart
1 × $27.00
How To Read The Market Professionally with TradeSmart
1 × $27.00 -
×
 5 Steps to Investment Success with Tyler Bolhorn
1 × $6.00
5 Steps to Investment Success with Tyler Bolhorn
1 × $6.00 -
×
 The Art of the Trade: What I Learned (and Lost) Trading the Chicago Futures Markets - Jason Alan Jankovsky
1 × $6.00
The Art of the Trade: What I Learned (and Lost) Trading the Chicago Futures Markets - Jason Alan Jankovsky
1 × $6.00 -
×
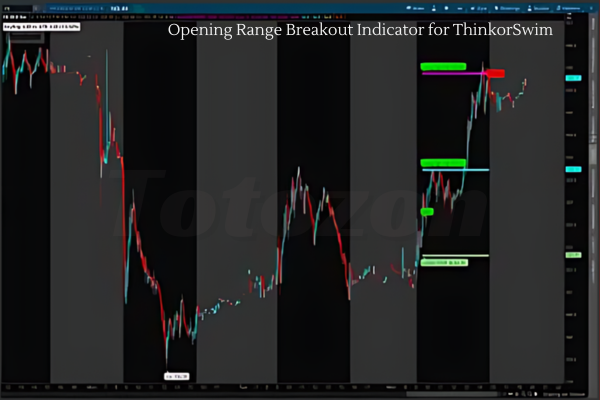 Opening Range Breakout Indicator for ThinkorSwim
1 × $6.00
Opening Range Breakout Indicator for ThinkorSwim
1 × $6.00 -
×
 CarterFX Membership with Duran Carter
1 × $23.00
CarterFX Membership with Duran Carter
1 × $23.00 -
×
 Fibonnacci Trader WorkShop (Video 2.38 GB) with Dennis Bolze, Thom Hartle
1 × $6.00
Fibonnacci Trader WorkShop (Video 2.38 GB) with Dennis Bolze, Thom Hartle
1 × $6.00 -
×
 All Access Online Trading Course with Steve Luke
1 × $6.00
All Access Online Trading Course with Steve Luke
1 × $6.00 -
×
 Day One Trader with John Sussex
1 × $6.00
Day One Trader with John Sussex
1 × $6.00 -
×
 Advanced Iron Condor Course in 2021
1 × $6.00
Advanced Iron Condor Course in 2021
1 × $6.00 -
×
 6 (The Proper BackGround)
1 × $6.00
6 (The Proper BackGround)
1 × $6.00 -
×
 Trading a Living Thing (Article) with David Bowden
1 × $6.00
Trading a Living Thing (Article) with David Bowden
1 × $6.00 -
×
 Advanced Trading Course with Edney Pinheiro
1 × $5.00
Advanced Trading Course with Edney Pinheiro
1 × $5.00 -
×
 The Day Trader: From the Pit to the PC with Lewis Borsellino
1 × $6.00
The Day Trader: From the Pit to the PC with Lewis Borsellino
1 × $6.00 -
×
 Best of the Best: Collars with Amy Meissner & Scott Ruble
1 × $15.00
Best of the Best: Collars with Amy Meissner & Scott Ruble
1 × $15.00 -
×
 Option Greeks Class with Don Kaufman
1 × $6.00
Option Greeks Class with Don Kaufman
1 × $6.00 -
×
 ICT Prodigy Trading Course – $650K in Payouts with Alex Solignani
1 × $15.00
ICT Prodigy Trading Course – $650K in Payouts with Alex Solignani
1 × $15.00 -
×
 ProfileTraders - Swing and Price Analysis (May 2014)
1 × $6.00
ProfileTraders - Swing and Price Analysis (May 2014)
1 × $6.00 -
×
 SQX Mentorship with Tip Toe Hippo
1 × $23.00
SQX Mentorship with Tip Toe Hippo
1 × $23.00 -
×
 The Deadly 7 Sins of Investing with Maury Fertig
1 × $6.00
The Deadly 7 Sins of Investing with Maury Fertig
1 × $6.00 -
×
 Home Run Options Trading Course with Dave Aquino - Base Camp Trading
1 × $11.00
Home Run Options Trading Course with Dave Aquino - Base Camp Trading
1 × $11.00 -
×
 Volatile Markets Made Easy: Trading Stocks and Options for Increased Profits with Guy Cohen
1 × $6.00
Volatile Markets Made Easy: Trading Stocks and Options for Increased Profits with Guy Cohen
1 × $6.00 -
×
 Weekly Diagonal Spreads for Consistent Income By Doc Severson
1 × $6.00
Weekly Diagonal Spreads for Consistent Income By Doc Severson
1 × $6.00 -
×
 Options Trading & Ultimate MasterClass With Tyrone Abela - FX Evolution
1 × $54.00
Options Trading & Ultimate MasterClass With Tyrone Abela - FX Evolution
1 × $54.00 -
×
 WondaFX Signature Strategy with WondaFX
1 × $5.00
WondaFX Signature Strategy with WondaFX
1 × $5.00 -
×
 Geometry of Markets I with Bruce Gilmore
1 × $6.00
Geometry of Markets I with Bruce Gilmore
1 × $6.00 -
×
 Trading Short TermSame Day Trades Sep 2023 with Dan Sheridan & Mark Fenton - Sheridan Options Mentoring
1 × $31.00
Trading Short TermSame Day Trades Sep 2023 with Dan Sheridan & Mark Fenton - Sheridan Options Mentoring
1 × $31.00 -
×
 Bond Market Course with The Macro Compass
1 × $15.00
Bond Market Course with The Macro Compass
1 × $15.00 -
×
 Get 95% Win Rate With The Triple Candy Method - Eden
1 × $5.00
Get 95% Win Rate With The Triple Candy Method - Eden
1 × $5.00 -
×
 Vom Einsteiger zum Mastertrader 2.0 with Mehrwert Garantier
1 × $109.00
Vom Einsteiger zum Mastertrader 2.0 with Mehrwert Garantier
1 × $109.00 -
×
 Quantitative Business Valuation with Jay Abrams
1 × $6.00
Quantitative Business Valuation with Jay Abrams
1 × $6.00 -
×
 Tharp Think Essentials Video Workshop with Van Tharp
1 × $5.00
Tharp Think Essentials Video Workshop with Van Tharp
1 × $5.00 -
×
 Profiletraders - MARKET PROFILE TACTICAL STRATEGIES FOR DAY TRADING
1 × $23.00
Profiletraders - MARKET PROFILE TACTICAL STRATEGIES FOR DAY TRADING
1 × $23.00 -
×
 The Best Option Trading Course with David Jaffee - Best Stock Strategy
1 × $15.00
The Best Option Trading Course with David Jaffee - Best Stock Strategy
1 × $15.00 -
×
 Trade What You See How To Profit from Pattern Recognition with Larry Pesavento & Leslie Jouflas
1 × $6.00
Trade What You See How To Profit from Pattern Recognition with Larry Pesavento & Leslie Jouflas
1 × $6.00 -
×
 Crystal Ball Pack PLUS bonus Live Trade By Pat Mitchell - Trick Trades
1 × $20.00
Crystal Ball Pack PLUS bonus Live Trade By Pat Mitchell - Trick Trades
1 × $20.00 -
×
 TradeCraft: Your Path to Peak Performance Trading By Adam Grimes
1 × $15.00
TradeCraft: Your Path to Peak Performance Trading By Adam Grimes
1 × $15.00 -
×
 The Loyalty Effect with Frederick Reichheld
1 × $6.00
The Loyalty Effect with Frederick Reichheld
1 × $6.00 -
×
 The Master Indicator 2023 with Lance Ippolito
1 × $101.00
The Master Indicator 2023 with Lance Ippolito
1 × $101.00 -
×
 Psychology of the Stock Market (1912) with G.C.Selden
1 × $6.00
Psychology of the Stock Market (1912) with G.C.Selden
1 × $6.00 -
×
 How I Trade Growth Stocks In Bull And Bear Markets
1 × $54.00
How I Trade Growth Stocks In Bull And Bear Markets
1 × $54.00 -
×
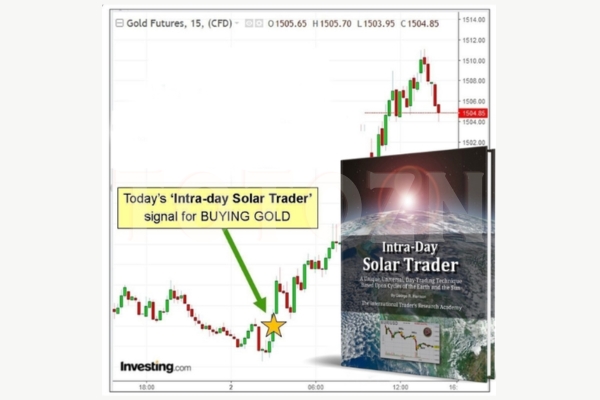 Intra-day Solar Trader with George Harrison
1 × $17.00
Intra-day Solar Trader with George Harrison
1 × $17.00 -
×
 Algo Trading Masterclass with Ali Casey - StatOasis
1 × $23.00
Algo Trading Masterclass with Ali Casey - StatOasis
1 × $23.00 -
×
 Money Management Strategies for Serious Traders with David Stendahl
1 × $6.00
Money Management Strategies for Serious Traders with David Stendahl
1 × $6.00 -
×
 Algo Trading Strategies 2017 with Autotrading Academy
1 × $6.00
Algo Trading Strategies 2017 with Autotrading Academy
1 × $6.00 -
×
 High Probability Trading Using Elliott Wave And Fibonacci Analysis withVic Patel - Forex Training Group
1 × $10.00
High Probability Trading Using Elliott Wave And Fibonacci Analysis withVic Patel - Forex Training Group
1 × $10.00 -
×
 Fundamentals of Futures & Options Markets (4th Ed.)
1 × $6.00
Fundamentals of Futures & Options Markets (4th Ed.)
1 × $6.00 -
×
 Full Members Area (Icludes 2006 Seminar & Webinars) with Tom Yeomans
1 × $6.00
Full Members Area (Icludes 2006 Seminar & Webinars) with Tom Yeomans
1 × $6.00 -
×
 Master Trader with InvestingSimple
1 × $15.00
Master Trader with InvestingSimple
1 × $15.00 -
×
 Quantum Stone Capital
1 × $15.00
Quantum Stone Capital
1 × $15.00 -
×
 Passages To Profitability: A Comprehensive Guide To Channel Trading with Professor Jeff Bierman, CMT
1 × $6.00
Passages To Profitability: A Comprehensive Guide To Channel Trading with Professor Jeff Bierman, CMT
1 × $6.00 -
×
 Essentials in Quantitative Trading QT01 By HangukQuant's
1 × $23.00
Essentials in Quantitative Trading QT01 By HangukQuant's
1 × $23.00 -
×
 Generative AI for Asset Managers Workshop Recording with Ernest Chan
1 × $55.00
Generative AI for Asset Managers Workshop Recording with Ernest Chan
1 × $55.00 -
×
 Cash In On Chaos with Hans Hannula
1 × $6.00
Cash In On Chaos with Hans Hannula
1 × $6.00 -
×
 Advanced Forex Patterns with Vic Noble & Darko Ali
1 × $39.00
Advanced Forex Patterns with Vic Noble & Darko Ali
1 × $39.00 -
×
 A Seminar On Ocean Theory Home Study Trading Course with Pat Raffalovich
1 × $6.00
A Seminar On Ocean Theory Home Study Trading Course with Pat Raffalovich
1 × $6.00 -
×
 Forecast, Filings, & News with Jtrader
1 × $6.00
Forecast, Filings, & News with Jtrader
1 × $6.00 -
×
 New Market Mavericks with Geoff Cutmore
1 × $6.00
New Market Mavericks with Geoff Cutmore
1 × $6.00 -
×
 Euro Trading Course with Bkforex
1 × $6.00
Euro Trading Course with Bkforex
1 × $6.00 -
×
 Emini Day Trading Boot Camp - Base Camp Trading
1 × $6.00
Emini Day Trading Boot Camp - Base Camp Trading
1 × $6.00 -
×
 Futures & Options from A to Z with Russell Wassendorf
1 × $6.00
Futures & Options from A to Z with Russell Wassendorf
1 × $6.00 -
×
 Crypto Trading Academy with Cheeky Investor - Aussie Day Trader
1 × $13.00
Crypto Trading Academy with Cheeky Investor - Aussie Day Trader
1 × $13.00 -
×
 Profit Before Work System with John Piper
1 × $6.00
Profit Before Work System with John Piper
1 × $6.00 -
×
 Nora Bystra Legacy International Complete Course
1 × $6.00
Nora Bystra Legacy International Complete Course
1 × $6.00 -
×
 Hedge Fund Market Wizards: How Winning Traders Win with Jack Schwager
1 × $6.00
Hedge Fund Market Wizards: How Winning Traders Win with Jack Schwager
1 × $6.00 -
×
 Advanced Trading Applications of Candlestick Charting with Gary S.Wagner & Bradley L.Matheny
1 × $6.00
Advanced Trading Applications of Candlestick Charting with Gary S.Wagner & Bradley L.Matheny
1 × $6.00 -
×
 Trading as a Business with Alexander Elder
1 × $6.00
Trading as a Business with Alexander Elder
1 × $6.00 -
×
 How Do You See Risk? A Guide to Evaluating & Applying Technical Volatility Indicators class with Jeff Bierman
1 × $6.00
How Do You See Risk? A Guide to Evaluating & Applying Technical Volatility Indicators class with Jeff Bierman
1 × $6.00 -
×
 TRADING NFX Course with Andrew NFX
1 × $5.00
TRADING NFX Course with Andrew NFX
1 × $5.00 -
×
 Traders Secret Success Package. Symmetry Wave Trading with Michael Gur Dillon
1 × $6.00
Traders Secret Success Package. Symmetry Wave Trading with Michael Gur Dillon
1 × $6.00 -
×
 Traders Winning Edge with Adrienne Laris Toghraie
1 × $6.00
Traders Winning Edge with Adrienne Laris Toghraie
1 × $6.00 -
×
 Path to Profits By Scott Redler - T3 Live
1 × $6.00
Path to Profits By Scott Redler - T3 Live
1 × $6.00 -
×
 Intro To Trading - 3 Module Bundle
1 × $23.00
Intro To Trading - 3 Module Bundle
1 × $23.00 -
×
 Deep Dive Butterfly Trading Strategy Class with SJG Trades
1 × $41.00
Deep Dive Butterfly Trading Strategy Class with SJG Trades
1 × $41.00 -
×
 The Dynamic Trading Master Course with Robert Miner
1 × $54.00
The Dynamic Trading Master Course with Robert Miner
1 × $54.00 -
×
 Alpha Quant Program with Lucas Inglese - Quantreo
1 × $15.00
Alpha Quant Program with Lucas Inglese - Quantreo
1 × $15.00 -
×
 White Phoenix’s The Smart (Money) Approach to Trading with Jayson Casper
1 × $39.00
White Phoenix’s The Smart (Money) Approach to Trading with Jayson Casper
1 × $39.00 -
×
 How I Turned 500 USD to 6 Figures in 2 months Trading Options with The Money Printers
1 × $8.00
How I Turned 500 USD to 6 Figures in 2 months Trading Options with The Money Printers
1 × $8.00 -
×
 The Orderflows Trade Opportunities Encyclopedia with Michael Valtos
1 × $8.00
The Orderflows Trade Opportunities Encyclopedia with Michael Valtos
1 × $8.00 -
×
 Order flow self-study training program with iMFtracker
1 × $10.00
Order flow self-study training program with iMFtracker
1 × $10.00 -
×
 The Indices Orderflow Masterclass with The Forex Scalpers
1 × $23.00
The Indices Orderflow Masterclass with The Forex Scalpers
1 × $23.00 -
×
 Trading Books with Michael Harris
1 × $6.00
Trading Books with Michael Harris
1 × $6.00 -
×
 4 Strategies That Will Make You a Professional Day Trader with Jerremy Newsome
1 × $6.00
4 Strategies That Will Make You a Professional Day Trader with Jerremy Newsome
1 × $6.00 -
×
 Profiting In Bull Or Bear Markets with George Dagnino
1 × $6.00
Profiting In Bull Or Bear Markets with George Dagnino
1 × $6.00 -
×
 The Orderflow Masterclass with PrimeTrading
1 × $17.00
The Orderflow Masterclass with PrimeTrading
1 × $17.00 -
×
 Swift Trader, Perfecting the Art of DayTrading with Charles Kim
1 × $6.00
Swift Trader, Perfecting the Art of DayTrading with Charles Kim
1 × $6.00 -
×
 TradeWithChris - TWC Forex Trading Course
1 × $6.00
TradeWithChris - TWC Forex Trading Course
1 × $6.00 -
×
 3_8’s to Wealth (Audio 84 MB+ WorkBooks) with Darlene Nelson
1 × $6.00
3_8’s to Wealth (Audio 84 MB+ WorkBooks) with Darlene Nelson
1 × $6.00 -
×
 Compass Trading System with Right Line Trading
1 × $39.00
Compass Trading System with Right Line Trading
1 × $39.00 -
×
 The A14 Weekly Option Strategy Workshop with Amy Meissner
1 × $23.00
The A14 Weekly Option Strategy Workshop with Amy Meissner
1 × $23.00
 with Arthur A.Hill")
Introduction to Candlestick (Article) with Arthur A.Hill
$6.00
File Size: Coming soon!
Delivery Time: 1–12 hours
Media Type: Online Course
Content Proof: Watch Here!
You may check content proof of “Introduction to Candlestick (Article) with Arthur A.Hill” below:
 with Arthur A.Hill")
Introduction to Candlestick (Article) with Arthur A. Hill
Candlestick charting is an essential tool for traders and investors, providing a visual representation of price movements. Arthur A. Hill, a renowned expert in technical analysis, offers a comprehensive introduction to candlestick charts, making them accessible to beginners and valuable for experienced traders. Let’s explore the basics of candlestick charting and how it can enhance your trading strategy.
What is a Candlestick Chart?
A candlestick chart is a type of financial chart used to describe price movements of a security, derivative, or currency.
Components of a Candlestick
- Body: The thick part of the candlestick, showing the opening and closing prices.
- Wicks/Shadows: The thin lines above and below the body, indicating the highest and lowest prices during the period.
- Color: Traditionally, a green or white body indicates a closing price higher than the opening price, while a red or black body indicates a closing price lower than the opening price.
History of Candlestick Charting
Candlestick charting originated in Japan over 300 years ago, developed by rice traders to track market prices and daily supply and demand.
Evolution of Candlestick Charts
Over the centuries, candlestick charting has evolved and gained popularity worldwide, becoming a staple in technical analysis.
Introduction to Western Markets
Candlestick charts were introduced to the Western financial markets in the late 20th century and quickly became popular among traders.
Advantages of Candlestick Charts
Candlestick charts offer several advantages over traditional bar charts and line charts.
Visual Clarity
Candlestick charts provide a clear and concise representation of price movements, making it easier to interpret market trends.
Immediate Insight
The color-coded bodies and wicks offer immediate insight into market sentiment and price direction.
Pattern Recognition
Candlestick charts are excellent for identifying patterns that can predict future price movements.
Common Candlestick Patterns
- Doji: Indicates indecision in the market.
- Hammer: Suggests a potential reversal from a downtrend.
- Engulfing: A strong signal of a potential trend reversal.
Basic Candlestick Patterns
Understanding basic candlestick patterns is crucial for any trader looking to use this charting method effectively.
Bullish Patterns
Bullish patterns indicate potential upward price movements.
Hammer and Inverted Hammer
- Hammer: A candlestick with a small body and a long lower wick, indicating potential reversal from a downtrend.
- Inverted Hammer: Similar to the hammer but with a long upper wick, suggesting a potential bullish reversal.
Bearish Patterns
Bearish patterns suggest potential downward price movements.
Shooting Star and Hanging Man
- Shooting Star: A candlestick with a small body and a long upper wick, indicating a potential reversal from an uptrend.
- Hanging Man: Similar to the hammer but occurs after an uptrend, signaling a potential bearish reversal.
Advanced Candlestick Patterns
For more experienced traders, advanced candlestick patterns provide deeper insights into market trends.
Engulfing Patterns
Engulfing patterns occur when a smaller candlestick is followed by a larger candlestick that completely engulfs the smaller one.
Bullish Engulfing
A bullish engulfing pattern occurs at the bottom of a downtrend and signals a potential upward reversal.
Bearish Engulfing
A bearish engulfing pattern appears at the top of an uptrend and suggests a potential downward reversal.
Morning Star and Evening Star
These patterns are three-candlestick formations that indicate strong trend reversals.
Morning Star
The morning star pattern consists of a bearish candle, a small indecisive candle, and a bullish candle, indicating a bullish reversal.
Evening Star
The evening star pattern includes a bullish candle, a small indecisive candle, and a bearish candle, suggesting a bearish reversal.
Incorporating Candlestick Charts into Your Trading Strategy
Candlestick charts are versatile and can be integrated into various trading strategies.
Combining with Other Indicators
Enhance the effectiveness of candlestick charts by combining them with other technical indicators.
Popular Indicators to Combine
- Moving Averages: Confirm trends and potential reversals.
- Relative Strength Index (RSI): Identify overbought or oversold conditions.
- Bollinger Bands: Measure market volatility and potential breakouts.
Setting Up Your Trading Platform
Most trading platforms offer candlestick charting options. Ensure you customize your charts to suit your trading style.
Customization Tips
- Time Frames: Choose appropriate time frames for your trading strategy.
- Color Schemes: Use distinct colors for bullish and bearish candles.
- Indicators: Add complementary indicators to your charts.
Common Mistakes to Avoid
Even with a robust understanding of candlestick charts, traders can make mistakes that affect their performance.
Over-reliance on Patterns
Relying solely on candlestick patterns without considering other factors can lead to false signals.
Diversify Analysis
Always use candlestick patterns in conjunction with other forms of analysis and market indicators.
Ignoring Market Context
Candlestick patterns can be misleading if not considered within the broader market context.
Comprehensive Analysis
Incorporate fundamental analysis and overall market trends to validate candlestick signals.
Conclusion
Candlestick charting, as introduced by Arthur A. Hill, offers a powerful tool for traders to understand and predict market movements. By mastering basic and advanced patterns, combining them with other technical indicators, and avoiding common pitfalls, traders can enhance their market analysis and trading performance. Whether you’re new to trading or an experienced trader, candlestick charts provide valuable insights that can guide your investment decisions.
Frequently Asked Questions:
- What is a candlestick chart?
A candlestick chart is a type of financial chart used to represent price movements over a specific period, showing the opening, closing, high, and low prices. - Why are candlestick charts popular among traders?
They provide visual clarity and help in identifying patterns that can predict future price movements. - What are some basic candlestick patterns?
Basic patterns include the hammer, inverted hammer, shooting star, and hanging man, which indicate potential market reversals. - Can candlestick charts be used with other technical indicators?
Yes, combining candlestick charts with indicators like moving averages, RSI, and Bollinger Bands enhances their effectiveness. - How can I avoid common mistakes when using candlestick charts?
Avoid over-relying on patterns and always consider the broader market context and other forms of analysis.
Be the first to review “Introduction to Candlestick (Article) with Arthur A.Hill”
You must be logged in to post a review.
Related products

Forex Trading
Original price was: $999.00.$15.00Current price is: $15.00.
Forex Trading
Original price was: $550.00.$5.00Current price is: $5.00.
Forex Trading
Original price was: $2,000.00.$23.00Current price is: $23.00.

Forex Trading
Original price was: $2,995.00.$31.00Current price is: $31.00.
Original price was: $139.00.$23.00Current price is: $23.00.
Forex Trading
The Complete Guide to Multiple Time Frame Analysis & Reading Price Action with Aiman Almansoori
Original price was: $1,399.00.$13.00Current price is: $13.00.
Forex Trading
Original price was: $500.00.$5.00Current price is: $5.00.

Forex Trading
Original price was: $249.00.$15.00Current price is: $15.00.
Original price was: $2,120.00.$15.00Current price is: $15.00.
Forex Trading
Original price was: $499.00.$15.00Current price is: $15.00.
Forex Trading
Original price was: $125.00.$17.00Current price is: $17.00.

Original price was: $497.00.$31.00Current price is: $31.00.
Original price was: $450.00.$23.00Current price is: $23.00.
Original price was: $1,800.00.$54.00Current price is: $54.00.

Forex Trading
Original price was: $239.00.$8.00Current price is: $8.00.
Original price was: $299.00.$8.00Current price is: $8.00.
Original price was: $1,849.00.$15.00Current price is: $15.00.
Forex Trading
Original price was: $4,997.00.$27.00Current price is: $27.00.

Original price was: $895.00.$15.00Current price is: $15.00.
Original price was: $1,200.00.$23.00Current price is: $23.00.

Reviews
There are no reviews yet.