-
×
 Design for Six Sigma with Subir Chowdhury
1 × $6.00
Design for Six Sigma with Subir Chowdhury
1 × $6.00 -
×
 Forex Candlestick System. High Profit Forex Trading with B.M.Davis
1 × $6.00
Forex Candlestick System. High Profit Forex Trading with B.M.Davis
1 × $6.00 -
×
 Increasing Vertical Spread Probabilities with Technical Analysis with Doc Severson
1 × $6.00
Increasing Vertical Spread Probabilities with Technical Analysis with Doc Severson
1 × $6.00 -
×
 The Management of Equity Investments with Dimitris Chorafas
1 × $6.00
The Management of Equity Investments with Dimitris Chorafas
1 × $6.00 -
×
 Futures Spreads Crash Course with Base Camp Trading
1 × $54.00
Futures Spreads Crash Course with Base Camp Trading
1 × $54.00 -
×
 Monthly Cash Flow Trading Options (Intermediate Option Trading Course) with Randy Perez
1 × $85.00
Monthly Cash Flow Trading Options (Intermediate Option Trading Course) with Randy Perez
1 × $85.00 -
×
 4D Bootcamp with Black Rabbit
1 × $10.00
4D Bootcamp with Black Rabbit
1 × $10.00 -
×
 All About Market Timing with Leslie N.Masonson
1 × $6.00
All About Market Timing with Leslie N.Masonson
1 × $6.00 -
×
 Charting the Major Forex Pairs: Focus on Major Currencies with James Bickford
1 × $6.00
Charting the Major Forex Pairs: Focus on Major Currencies with James Bickford
1 × $6.00 -
×
 Forecast 2024 Clarification with Larry Williams
1 × $15.00
Forecast 2024 Clarification with Larry Williams
1 × $15.00 -
×
 Futures & Options Course with Talkin Options
1 × $15.00
Futures & Options Course with Talkin Options
1 × $15.00 -
×
 Confidence Game. How a Hadge Fund Manager Called Wall Street’s Bluff with Christine Richard
1 × $6.00
Confidence Game. How a Hadge Fund Manager Called Wall Street’s Bluff with Christine Richard
1 × $6.00 -
×
 Adaptation in Sports Training (1995) with Atko Viru
1 × $23.00
Adaptation in Sports Training (1995) with Atko Viru
1 × $23.00 -
×
 PFA SD Model Trading System (Apr 2013)
1 × $31.00
PFA SD Model Trading System (Apr 2013)
1 × $31.00 -
×
 3 Steps To Supply/Demand + 3 Steps To Market Profile 10% Off Combined Price
1 × $23.00
3 Steps To Supply/Demand + 3 Steps To Market Profile 10% Off Combined Price
1 × $23.00 -
×
 Predicting Market Trends with Periodic Number Cycle
1 × $6.00
Predicting Market Trends with Periodic Number Cycle
1 × $6.00 -
×
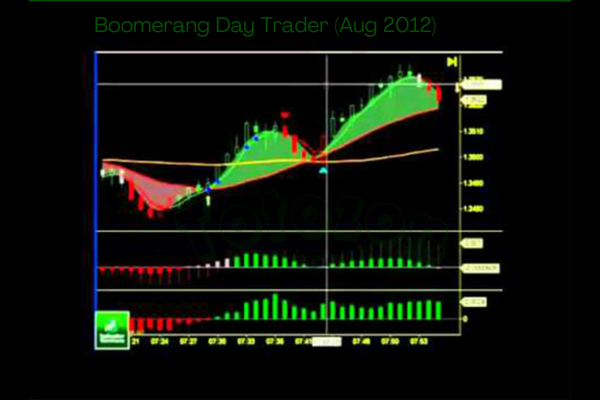 Boomerang Day Trader (Aug 2012)
1 × $54.00
Boomerang Day Trader (Aug 2012)
1 × $54.00 -
×
 Advanced AmiBroker Coding with Matt Radtke & Connors Research
1 × $23.00
Advanced AmiBroker Coding with Matt Radtke & Connors Research
1 × $23.00 -
×
 The Naked Eye: Raw Data Analytics with Edgar Torres - Raw Data Analytics
1 × $8.00
The Naked Eye: Raw Data Analytics with Edgar Torres - Raw Data Analytics
1 × $8.00 -
×
 Options Trading & Ultimate MasterClass With Tyrone Abela - FX Evolution
1 × $54.00
Options Trading & Ultimate MasterClass With Tyrone Abela - FX Evolution
1 × $54.00 -
×
 Advanced Trading Applications of Candlestick Charting with Gary S.Wagner & Bradley L.Matheny
1 × $6.00
Advanced Trading Applications of Candlestick Charting with Gary S.Wagner & Bradley L.Matheny
1 × $6.00 -
×
 W. D Gann 's Square Of 9 Applied To Modern Markets with Sean Avidar - Hexatrade350
1 × $23.00
W. D Gann 's Square Of 9 Applied To Modern Markets with Sean Avidar - Hexatrade350
1 × $23.00 -
×
 Hubert Senters’ Squeeze Play Strategy & Tradestation Code with Hubert Senters
1 × $6.00
Hubert Senters’ Squeeze Play Strategy & Tradestation Code with Hubert Senters
1 × $6.00 -
×
 Technical Timing Patterns
1 × $6.00
Technical Timing Patterns
1 × $6.00 -
×
 Master Moving Averages - Profit Multiplying Techniques with Nick Santiago - InTheMoneyStocks
1 × $54.00
Master Moving Averages - Profit Multiplying Techniques with Nick Santiago - InTheMoneyStocks
1 × $54.00 -
×
 Stock Patterns for DayTrading I & II with Barry Rudd
1 × $6.00
Stock Patterns for DayTrading I & II with Barry Rudd
1 × $6.00 -
×
 Investing Online for Dummies (5th Edition) with Kathleen Sindell
1 × $6.00
Investing Online for Dummies (5th Edition) with Kathleen Sindell
1 × $6.00 -
×
 Modern Darvas Trading
1 × $6.00
Modern Darvas Trading
1 × $6.00 -
×
 The Litle Book of Bulletproof Investing
1 × $6.00
The Litle Book of Bulletproof Investing
1 × $6.00 -
×
 Balance Trader – Market Profile Trading Course
1 × $23.00
Balance Trader – Market Profile Trading Course
1 × $23.00 -
×
 Rapid Cash & Success System
1 × $31.00
Rapid Cash & Success System
1 × $31.00 -
×
 WYCKOFF TRADING COURSE (WTC) PART I – ANALYSIS (Spring 2023) - Roman Bogomazov & Alessio Rutigliano
1 × $209.00
WYCKOFF TRADING COURSE (WTC) PART I – ANALYSIS (Spring 2023) - Roman Bogomazov & Alessio Rutigliano
1 × $209.00 -
×
 Options Academy Elevate with Simon Ree - Tao of Trading
1 × $109.00
Options Academy Elevate with Simon Ree - Tao of Trading
1 × $109.00 -
×
 The Logical Trader: Applying a Method to the Madness with Mark Fisher
1 × $6.00
The Logical Trader: Applying a Method to the Madness with Mark Fisher
1 × $6.00 -
×
 Option Greeks Class with Don Kaufman
1 × $6.00
Option Greeks Class with Don Kaufman
1 × $6.00 -
×
 The Prop Trading Code with Brannigan Barrett - Axia Futures
1 × $23.00
The Prop Trading Code with Brannigan Barrett - Axia Futures
1 × $23.00 -
×
 EasyLanguage Home Study Course PDF Book + CD
1 × $6.00
EasyLanguage Home Study Course PDF Book + CD
1 × $6.00 -
×
 The Ultimate Option Guide When & How to Use Which Strategy for The Best Results with Larry Gaines - Power Cycle Trading
1 × $39.00
The Ultimate Option Guide When & How to Use Which Strategy for The Best Results with Larry Gaines - Power Cycle Trading
1 × $39.00 -
×
 Supply and Demand Video Course with JamesFXS
1 × $13.00
Supply and Demand Video Course with JamesFXS
1 × $13.00 -
×
 Defending Options with Simpler Options
1 × $6.00
Defending Options with Simpler Options
1 × $6.00 -
×
 Heiken Ashi 101
1 × $15.00
Heiken Ashi 101
1 × $15.00 -
×
 Swing Trader Pro with Top Trade Tools
1 × $54.00
Swing Trader Pro with Top Trade Tools
1 × $54.00 -
×
 From Wall Street to the Great Wall with Jonathan Worrall
1 × $6.00
From Wall Street to the Great Wall with Jonathan Worrall
1 × $6.00 -
×
 Forty Cents for Financial Freedom with Darlene Nelson
1 × $6.00
Forty Cents for Financial Freedom with Darlene Nelson
1 × $6.00 -
×
 Math Trading Course 2023
1 × $34.00
Math Trading Course 2023
1 × $34.00 -
×
 Encyclopedia of Planetary Aspects for Short Term TradingPatrick Mikula – Encyclopedia of Planetary Aspects for Short Term Trading
1 × $4.00
Encyclopedia of Planetary Aspects for Short Term TradingPatrick Mikula – Encyclopedia of Planetary Aspects for Short Term Trading
1 × $4.00 -
×
 Complete Portfolio and Stock Comparison Spreadsheet with Joseph Hogue
1 × $6.00
Complete Portfolio and Stock Comparison Spreadsheet with Joseph Hogue
1 × $6.00 -
×
 Sami Abusaad Elite Mentorship
1 × $31.00
Sami Abusaad Elite Mentorship
1 × $31.00 -
×
 Mentfx Paid Mentoship (2021)
1 × $5.00
Mentfx Paid Mentoship (2021)
1 × $5.00 -
×
 ICT Mastery with Casper SMC
1 × $14.00
ICT Mastery with Casper SMC
1 × $14.00 -
×
 Forex Trading Strategies Modules 1-3 Complete Set with Blake Young - Shadow Trader
1 × $54.00
Forex Trading Strategies Modules 1-3 Complete Set with Blake Young - Shadow Trader
1 × $54.00 -
×
 Professional Trader Training Course (Complete)
1 × $23.00
Professional Trader Training Course (Complete)
1 × $23.00 -
×
 Capital Flows and Crises with Barry Eichengreen
1 × $6.00
Capital Flows and Crises with Barry Eichengreen
1 × $6.00 -
×
 Candle Charting Essentials & Beyond Volume 1 & 2 with Steve Nison - Candle Charts
1 × $15.00
Candle Charting Essentials & Beyond Volume 1 & 2 with Steve Nison - Candle Charts
1 × $15.00 -
×
 7 Things You MUST Know about Forex Candlesticks
1 × $4.00
7 Things You MUST Know about Forex Candlesticks
1 × $4.00 -
×
 How to Lose Money Profitably with Mark D.Cook
1 × $6.00
How to Lose Money Profitably with Mark D.Cook
1 × $6.00 -
×
 White Phoenix’s The Smart (Money) Approach to Trading with Jayson Casper
1 × $39.00
White Phoenix’s The Smart (Money) Approach to Trading with Jayson Casper
1 × $39.00 -
×
 Candlestick & Pivot Point Strategies with John L.Person
1 × $6.00
Candlestick & Pivot Point Strategies with John L.Person
1 × $6.00 -
×
 Learn To Fish Part III - How To Swing Trade for Consistent Gains with Daniel
1 × $15.00
Learn To Fish Part III - How To Swing Trade for Consistent Gains with Daniel
1 × $15.00 -
×
 CFA Level 2 - Sample Item Sets 2003
1 × $6.00
CFA Level 2 - Sample Item Sets 2003
1 × $6.00 -
×
 Create Your Own Hedge Fund with Mark Wolfinger
1 × $6.00
Create Your Own Hedge Fund with Mark Wolfinger
1 × $6.00 -
×
 PFAZoneSuite [Trading Indicator] 2017
1 × $109.00
PFAZoneSuite [Trading Indicator] 2017
1 × $109.00 -
×
 Daily Market Review 2009-2012 (Video 16 GB) with David Vallieres
1 × $6.00
Daily Market Review 2009-2012 (Video 16 GB) with David Vallieres
1 × $6.00 -
×
 Home Run Options Trading Course with Dave Aquino - Base Camp Trading
1 × $11.00
Home Run Options Trading Course with Dave Aquino - Base Camp Trading
1 × $11.00
 with Arthur A.Hill")
Introduction to Candlestick (Article) with Arthur A.Hill
$6.00
File Size: Coming soon!
Delivery Time: 1–12 hours
Media Type: Online Course
Content Proof: Watch Here!
You may check content proof of “Introduction to Candlestick (Article) with Arthur A.Hill” below:
 with Arthur A.Hill")
Introduction to Candlestick (Article) with Arthur A. Hill
Candlestick charting is an essential tool for traders and investors, providing a visual representation of price movements. Arthur A. Hill, a renowned expert in technical analysis, offers a comprehensive introduction to candlestick charts, making them accessible to beginners and valuable for experienced traders. Let’s explore the basics of candlestick charting and how it can enhance your trading strategy.
What is a Candlestick Chart?
A candlestick chart is a type of financial chart used to describe price movements of a security, derivative, or currency.
Components of a Candlestick
- Body: The thick part of the candlestick, showing the opening and closing prices.
- Wicks/Shadows: The thin lines above and below the body, indicating the highest and lowest prices during the period.
- Color: Traditionally, a green or white body indicates a closing price higher than the opening price, while a red or black body indicates a closing price lower than the opening price.
History of Candlestick Charting
Candlestick charting originated in Japan over 300 years ago, developed by rice traders to track market prices and daily supply and demand.
Evolution of Candlestick Charts
Over the centuries, candlestick charting has evolved and gained popularity worldwide, becoming a staple in technical analysis.
Introduction to Western Markets
Candlestick charts were introduced to the Western financial markets in the late 20th century and quickly became popular among traders.
Advantages of Candlestick Charts
Candlestick charts offer several advantages over traditional bar charts and line charts.
Visual Clarity
Candlestick charts provide a clear and concise representation of price movements, making it easier to interpret market trends.
Immediate Insight
The color-coded bodies and wicks offer immediate insight into market sentiment and price direction.
Pattern Recognition
Candlestick charts are excellent for identifying patterns that can predict future price movements.
Common Candlestick Patterns
- Doji: Indicates indecision in the market.
- Hammer: Suggests a potential reversal from a downtrend.
- Engulfing: A strong signal of a potential trend reversal.
Basic Candlestick Patterns
Understanding basic candlestick patterns is crucial for any trader looking to use this charting method effectively.
Bullish Patterns
Bullish patterns indicate potential upward price movements.
Hammer and Inverted Hammer
- Hammer: A candlestick with a small body and a long lower wick, indicating potential reversal from a downtrend.
- Inverted Hammer: Similar to the hammer but with a long upper wick, suggesting a potential bullish reversal.
Bearish Patterns
Bearish patterns suggest potential downward price movements.
Shooting Star and Hanging Man
- Shooting Star: A candlestick with a small body and a long upper wick, indicating a potential reversal from an uptrend.
- Hanging Man: Similar to the hammer but occurs after an uptrend, signaling a potential bearish reversal.
Advanced Candlestick Patterns
For more experienced traders, advanced candlestick patterns provide deeper insights into market trends.
Engulfing Patterns
Engulfing patterns occur when a smaller candlestick is followed by a larger candlestick that completely engulfs the smaller one.
Bullish Engulfing
A bullish engulfing pattern occurs at the bottom of a downtrend and signals a potential upward reversal.
Bearish Engulfing
A bearish engulfing pattern appears at the top of an uptrend and suggests a potential downward reversal.
Morning Star and Evening Star
These patterns are three-candlestick formations that indicate strong trend reversals.
Morning Star
The morning star pattern consists of a bearish candle, a small indecisive candle, and a bullish candle, indicating a bullish reversal.
Evening Star
The evening star pattern includes a bullish candle, a small indecisive candle, and a bearish candle, suggesting a bearish reversal.
Incorporating Candlestick Charts into Your Trading Strategy
Candlestick charts are versatile and can be integrated into various trading strategies.
Combining with Other Indicators
Enhance the effectiveness of candlestick charts by combining them with other technical indicators.
Popular Indicators to Combine
- Moving Averages: Confirm trends and potential reversals.
- Relative Strength Index (RSI): Identify overbought or oversold conditions.
- Bollinger Bands: Measure market volatility and potential breakouts.
Setting Up Your Trading Platform
Most trading platforms offer candlestick charting options. Ensure you customize your charts to suit your trading style.
Customization Tips
- Time Frames: Choose appropriate time frames for your trading strategy.
- Color Schemes: Use distinct colors for bullish and bearish candles.
- Indicators: Add complementary indicators to your charts.
Common Mistakes to Avoid
Even with a robust understanding of candlestick charts, traders can make mistakes that affect their performance.
Over-reliance on Patterns
Relying solely on candlestick patterns without considering other factors can lead to false signals.
Diversify Analysis
Always use candlestick patterns in conjunction with other forms of analysis and market indicators.
Ignoring Market Context
Candlestick patterns can be misleading if not considered within the broader market context.
Comprehensive Analysis
Incorporate fundamental analysis and overall market trends to validate candlestick signals.
Conclusion
Candlestick charting, as introduced by Arthur A. Hill, offers a powerful tool for traders to understand and predict market movements. By mastering basic and advanced patterns, combining them with other technical indicators, and avoiding common pitfalls, traders can enhance their market analysis and trading performance. Whether you’re new to trading or an experienced trader, candlestick charts provide valuable insights that can guide your investment decisions.
Frequently Asked Questions:
- What is a candlestick chart?
A candlestick chart is a type of financial chart used to represent price movements over a specific period, showing the opening, closing, high, and low prices. - Why are candlestick charts popular among traders?
They provide visual clarity and help in identifying patterns that can predict future price movements. - What are some basic candlestick patterns?
Basic patterns include the hammer, inverted hammer, shooting star, and hanging man, which indicate potential market reversals. - Can candlestick charts be used with other technical indicators?
Yes, combining candlestick charts with indicators like moving averages, RSI, and Bollinger Bands enhances their effectiveness. - How can I avoid common mistakes when using candlestick charts?
Avoid over-relying on patterns and always consider the broader market context and other forms of analysis.
Be the first to review “Introduction to Candlestick (Article) with Arthur A.Hill”
You must be logged in to post a review.
Related products

Original price was: $895.00.$15.00Current price is: $15.00.

Original price was: $649.00.$20.00Current price is: $20.00.

Original price was: $999.00.$5.00Current price is: $5.00.

Forex Trading
Original price was: $999.00.$15.00Current price is: $15.00.

Forex Trading
Original price was: $697.00.$5.00Current price is: $5.00.
Original price was: $139.00.$23.00Current price is: $23.00.

Forex Trading
Original price was: $2,997.00.$23.00Current price is: $23.00.

Original price was: $497.00.$31.00Current price is: $31.00.
Original price was: $497.00.$11.00Current price is: $11.00.

Forex Trading
Original price was: $550.00.$5.00Current price is: $5.00.

Forex Trading
Original price was: $1,098.00.$39.00Current price is: $39.00.

Forex Trading
Original price was: $125.00.$17.00Current price is: $17.00.

Original price was: $4,995.00.$15.00Current price is: $15.00.
Original price was: $1,800.00.$54.00Current price is: $54.00.

Forex Trading
Quantamentals – The Next Great Forefront Of Trading and Investing with Trading Markets
Original price was: $1,495.00.$8.00Current price is: $8.00.
Original price was: $1,200.00.$23.00Current price is: $23.00.

Forex Trading
Original price was: $397.00.$31.00Current price is: $31.00.

Original price was: $799.00.$15.00Current price is: $15.00.

Forex Trading
Original price was: $797.00.$10.00Current price is: $10.00.
Original price was: $997.00.$8.00Current price is: $8.00.

Reviews
There are no reviews yet.