-
×
 Pristine - Tom Willard – Creating The Ultimate Trading Psychology Using 3 Key Concepts
1 × $6.00
Pristine - Tom Willard – Creating The Ultimate Trading Psychology Using 3 Key Concepts
1 × $6.00 -
×
 Empirical Market Microstructure
1 × $6.00
Empirical Market Microstructure
1 × $6.00 -
×
 Pattern Cycles with Alan Farley
1 × $6.00
Pattern Cycles with Alan Farley
1 × $6.00 -
×
 Self-Mastery Course with Steven Cruz
1 × $62.00
Self-Mastery Course with Steven Cruz
1 × $62.00 -
×
 Big Profit Patterns Using Candlestick Signals & Gaps with Stephen W.Bigalow
1 × $6.00
Big Profit Patterns Using Candlestick Signals & Gaps with Stephen W.Bigalow
1 × $6.00 -
×
 Catching the Big Moves with Jack Bernstein
1 × $6.00
Catching the Big Moves with Jack Bernstein
1 × $6.00 -
×
 ICT Prodigy Trading Course – $650K in Payouts with Alex Solignani
1 × $15.00
ICT Prodigy Trading Course – $650K in Payouts with Alex Solignani
1 × $15.00 -
×
 Scientific Forex with Cristina Ciurea
1 × $6.00
Scientific Forex with Cristina Ciurea
1 × $6.00 -
×
 Trading with Wave59 with Earik Beann
1 × $6.00
Trading with Wave59 with Earik Beann
1 × $6.00 -
×
 Bond Trading Success
1 × $6.00
Bond Trading Success
1 × $6.00 -
×
 Essentials in Quantitative Trading QT01 By HangukQuant's
1 × $23.00
Essentials in Quantitative Trading QT01 By HangukQuant's
1 × $23.00 -
×
 30 Day Masterclass with Joe Elite Trader Hub ICT
1 × $6.00
30 Day Masterclass with Joe Elite Trader Hub ICT
1 × $6.00 -
×
 DAY TRADING COURSE 2018
1 × $6.00
DAY TRADING COURSE 2018
1 × $6.00 -
×
 Hubert Senters’ Squeeze Play Strategy & Tradestation Code with Hubert Senters
1 × $6.00
Hubert Senters’ Squeeze Play Strategy & Tradestation Code with Hubert Senters
1 × $6.00 -
×
 Advanced Trading Course with DovyFX
1 × $5.00
Advanced Trading Course with DovyFX
1 × $5.00 -
×
 Discover the MEM Simple Moving Average Formula with Mary Ellen McGonagle
1 × $15.00
Discover the MEM Simple Moving Average Formula with Mary Ellen McGonagle
1 × $15.00 -
×
 Exploring MetaStock Advanced with Martin Pring
1 × $6.00
Exploring MetaStock Advanced with Martin Pring
1 × $6.00 -
×
 3 Volatility Strategies with Quantified Strategies
1 × $23.00
3 Volatility Strategies with Quantified Strategies
1 × $23.00 -
×
 Elite Core Advance Course with Urban Forex
1 × $5.00
Elite Core Advance Course with Urban Forex
1 × $5.00 -
×
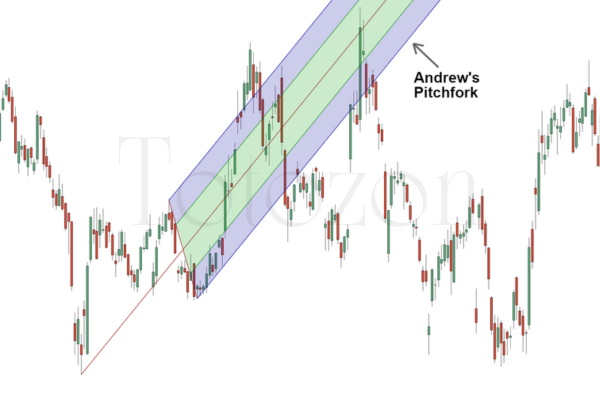 Andrews Pitchfork Basic
1 × $6.00
Andrews Pitchfork Basic
1 × $6.00 -
×
 Bird Watch in Lion Country 2010 Ed with Dirk Du Toit
1 × $6.00
Bird Watch in Lion Country 2010 Ed with Dirk Du Toit
1 × $6.00 -
×
 The Ticker Investment Digest Articles
1 × $6.00
The Ticker Investment Digest Articles
1 × $6.00 -
×
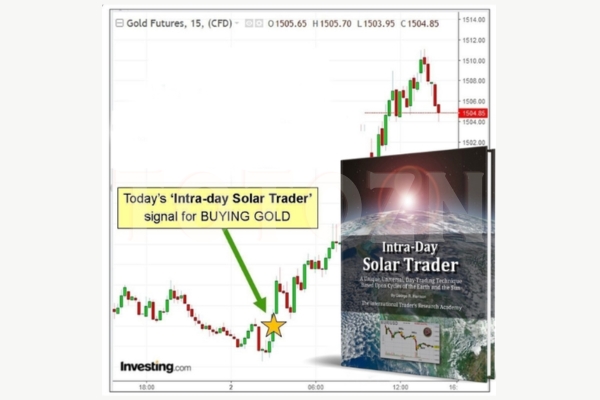 Intra-day Solar Trader with George Harrison
1 × $17.00
Intra-day Solar Trader with George Harrison
1 × $17.00 -
×
 Forex Trading Secrets. Trading Strategies for the Forex Market
1 × $6.00
Forex Trading Secrets. Trading Strategies for the Forex Market
1 × $6.00 -
×
 Deep Dive Butterfly Trading Strategy Class with SJG Trades
1 × $41.00
Deep Dive Butterfly Trading Strategy Class with SJG Trades
1 × $41.00 -
×
 Multi Asset Class Investment Strategy with Guy Fraser-Sampson
1 × $6.00
Multi Asset Class Investment Strategy with Guy Fraser-Sampson
1 × $6.00 -
×
 What Products to Watch and Why Class with Don Kaufman
1 × $6.00
What Products to Watch and Why Class with Don Kaufman
1 × $6.00 -
×
 Fractal Based Point Processes with Steven Bradley Lowen & Malvin Carl Teich
1 × $6.00
Fractal Based Point Processes with Steven Bradley Lowen & Malvin Carl Teich
1 × $6.00 -
×
 Forex Trading Using Fibonacci & Elliott Wave with Todd Gordon
1 × $6.00
Forex Trading Using Fibonacci & Elliott Wave with Todd Gordon
1 × $6.00 -
×
 The Geography of Money with Benjamin J.Cohen
1 × $6.00
The Geography of Money with Benjamin J.Cohen
1 × $6.00 -
×
 Active Trading Course Notes with Alan Hull
1 × $6.00
Active Trading Course Notes with Alan Hull
1 × $6.00 -
×
 Naked Trading Mastery
1 × $39.00
Naked Trading Mastery
1 × $39.00 -
×
 A Complete Guide to the Futures Markets: Fundamental Analysis, Technical Analysis, Trading, Spreads, and Options (1st Edition) - Jack Schwager
1 × $6.00
A Complete Guide to the Futures Markets: Fundamental Analysis, Technical Analysis, Trading, Spreads, and Options (1st Edition) - Jack Schwager
1 × $6.00 -
×
 Freedom Challenge Course with Steven Dux
1 × $5.00
Freedom Challenge Course with Steven Dux
1 × $5.00 -
×
 The Hindenburg Strategy with Todd Mitchell
1 × $23.00
The Hindenburg Strategy with Todd Mitchell
1 × $23.00 -
×
 How To Read The Market Professionally with TradeSmart
1 × $27.00
How To Read The Market Professionally with TradeSmart
1 × $27.00 -
×
 Pete Fader VSA Course
1 × $6.00
Pete Fader VSA Course
1 × $6.00 -
×
 The Prop Trading Code with Brannigan Barrett - Axia Futures
1 × $23.00
The Prop Trading Code with Brannigan Barrett - Axia Futures
1 × $23.00 -
×
 Traders Workshop – Forex Full Course with Jason Stapleton
1 × $6.00
Traders Workshop – Forex Full Course with Jason Stapleton
1 × $6.00 -
×
 Investment Fables with Aswath Damodaran
1 × $6.00
Investment Fables with Aswath Damodaran
1 × $6.00 -
×
 Fractal Markets SFX with Tyson Bieniek
1 × $5.00
Fractal Markets SFX with Tyson Bieniek
1 × $5.00 -
×
 Cotton Trading Manual with Terry Townsend
1 × $6.00
Cotton Trading Manual with Terry Townsend
1 × $6.00 -
×
 Secret Weapon to Trading Options on ETF's Class with Don Kaufman
1 × $6.00
Secret Weapon to Trading Options on ETF's Class with Don Kaufman
1 × $6.00 -
×
 Cyclic Analysis. A BreakThrough in Transaction Timing with Cyclitec Services
1 × $6.00
Cyclic Analysis. A BreakThrough in Transaction Timing with Cyclitec Services
1 × $6.00 -
×
 The Handbook of Pairs Trading with Douglas Ehrman
1 × $6.00
The Handbook of Pairs Trading with Douglas Ehrman
1 × $6.00 -
×
 Guide to Getting Short and Collecting Income with Don Kaufman
1 × $6.00
Guide to Getting Short and Collecting Income with Don Kaufman
1 × $6.00 -
×
 Financial Astrology Course with Brian James Sklenka
1 × $6.00
Financial Astrology Course with Brian James Sklenka
1 × $6.00 -
×
 The Orderflows Trade Opportunities Encyclopedia with Michael Valtos
1 × $8.00
The Orderflows Trade Opportunities Encyclopedia with Michael Valtos
1 × $8.00 -
×
 Naked Forex: High-Probability Techniques for Trading Without Indicators (2012) with Alex Nekritin & Walter Peters
1 × $6.00
Naked Forex: High-Probability Techniques for Trading Without Indicators (2012) with Alex Nekritin & Walter Peters
1 × $6.00 -
×
 Trading Short TermSame Day Trades Sep 2023 with Dan Sheridan & Mark Fenton - Sheridan Options Mentoring
1 × $31.00
Trading Short TermSame Day Trades Sep 2023 with Dan Sheridan & Mark Fenton - Sheridan Options Mentoring
1 × $31.00 -
×
 Contrarian Investment Strategies: The Next Generation with David Dreman
1 × $4.00
Contrarian Investment Strategies: The Next Generation with David Dreman
1 × $4.00 -
×
 Financial Freedom Mastery Course with Freedom Team Trading
1 × $31.00
Financial Freedom Mastery Course with Freedom Team Trading
1 × $31.00 -
×
 Bond Market Course with The Macro Compass
1 × $15.00
Bond Market Course with The Macro Compass
1 × $15.00 -
×
 How Big Money Trades A Key Aspect of Systems Thinking - Van Tharp and Chuck Whitman – Van Tharp
1 × $46.00
How Big Money Trades A Key Aspect of Systems Thinking - Van Tharp and Chuck Whitman – Van Tharp
1 × $46.00 -
×
 ActiveBeta Indexes. Capturing Systematic Sources of Active Equity Returns (HTML) with Andrew Lo
1 × $6.00
ActiveBeta Indexes. Capturing Systematic Sources of Active Equity Returns (HTML) with Andrew Lo
1 × $6.00 -
×
 KP Trading Room w/ Paladin and JadeCapFX
1 × $5.00
KP Trading Room w/ Paladin and JadeCapFX
1 × $5.00 -
×
 SQX Mentorship with Tip Toe Hippo
1 × $23.00
SQX Mentorship with Tip Toe Hippo
1 × $23.00 -
×
 Smart Money Trading Course with Prosperity Academy
1 × $5.00
Smart Money Trading Course with Prosperity Academy
1 × $5.00 -
×
 Sacredscience - Raphael – Book of Fate
1 × $6.00
Sacredscience - Raphael – Book of Fate
1 × $6.00 -
×
 How to Buy Stocks Before They Skyrocket
1 × $6.00
How to Buy Stocks Before They Skyrocket
1 × $6.00 -
×
 A Bull in China with Jim Rogers
1 × $6.00
A Bull in China with Jim Rogers
1 × $6.00 -
×
 Profiletraders - MARKET PROFILE TACTICAL STRATEGIES FOR DAY TRADING
1 × $23.00
Profiletraders - MARKET PROFILE TACTICAL STRATEGIES FOR DAY TRADING
1 × $23.00 -
×
 Simple Forex Profits with Rayy Bannzz
1 × $31.00
Simple Forex Profits with Rayy Bannzz
1 × $31.00 -
×
 FX GOAT 3.0 (ALL IN ONE) with FX GOAT FOREX TRADING ACADEMY
1 × $5.00
FX GOAT 3.0 (ALL IN ONE) with FX GOAT FOREX TRADING ACADEMY
1 × $5.00 -
×
 Defending Options with Simpler Options
1 × $6.00
Defending Options with Simpler Options
1 × $6.00 -
×
 Technical Analysis & Options Strategies with K.H.Shaleen
1 × $6.00
Technical Analysis & Options Strategies with K.H.Shaleen
1 × $6.00 -
×
 How To Invest Better
1 × $6.00
How To Invest Better
1 × $6.00 -
×
 CMT Association Entire Webinars
1 × $31.00
CMT Association Entire Webinars
1 × $31.00 -
×
 7 Day FX Mastery Course with Market Masters
1 × $6.00
7 Day FX Mastery Course with Market Masters
1 × $6.00 -
×
 Yield Farming MasterClass Course (2022) with Boss Financial
1 × $5.00
Yield Farming MasterClass Course (2022) with Boss Financial
1 × $5.00 -
×
 Seasonality. Systems, Strategies & Signals
1 × $6.00
Seasonality. Systems, Strategies & Signals
1 × $6.00 -
×
 Crystal Ball Pack PLUS bonus Live Trade By Pat Mitchell - Trick Trades
1 × $20.00
Crystal Ball Pack PLUS bonus Live Trade By Pat Mitchell - Trick Trades
1 × $20.00 -
×
 A Non-Random Walk Down Wall Street with Andrew W.Lo
1 × $6.00
A Non-Random Walk Down Wall Street with Andrew W.Lo
1 × $6.00 -
×
 Wheels of Gann. Top Secret Forecast Guide with Pat Reda
1 × $6.00
Wheels of Gann. Top Secret Forecast Guide with Pat Reda
1 × $6.00 -
×
 Options Master Class
1 × $54.00
Options Master Class
1 × $54.00 -
×
 Mastertrader – Mastering Swing Trading
1 × $31.00
Mastertrader – Mastering Swing Trading
1 × $31.00 -
×
 FX Funding Mate Course
1 × $5.00
FX Funding Mate Course
1 × $5.00 -
×
 Virtual Intensive Trader Training
1 × $31.00
Virtual Intensive Trader Training
1 × $31.00 -
×
 The Master Indicator 2023 with Lance Ippolito
1 × $101.00
The Master Indicator 2023 with Lance Ippolito
1 × $101.00 -
×
 How to Use Gann Techniques to Implement a Trading System
1 × $6.00
How to Use Gann Techniques to Implement a Trading System
1 × $6.00 -
×
 Stock Cycles with Michael Alexander
1 × $6.00
Stock Cycles with Michael Alexander
1 × $6.00 -
×
 $20 – 52k 20 pips a day challange with Rafał Zuchowicz - TopMasterTrader
1 × $5.00
$20 – 52k 20 pips a day challange with Rafał Zuchowicz - TopMasterTrader
1 × $5.00 -
×
 The Naked Eye: Raw Data Analytics with Edgar Torres - Raw Data Analytics
1 × $8.00
The Naked Eye: Raw Data Analytics with Edgar Torres - Raw Data Analytics
1 × $8.00 -
×
 Practical Elliott Wave Trading Strategies with Robert Miner
1 × $6.00
Practical Elliott Wave Trading Strategies with Robert Miner
1 × $6.00 -
×
 Pablo Order Flow Education with Pablo
1 × $6.00
Pablo Order Flow Education with Pablo
1 × $6.00 -
×
 Advanced Forex Trading Momentum vs Reversals with Indicators Webinar - Mark Whistler
1 × $6.00
Advanced Forex Trading Momentum vs Reversals with Indicators Webinar - Mark Whistler
1 × $6.00 -
×
 All About Dividend Investing with Don Schreiber & Gary Stroik
1 × $6.00
All About Dividend Investing with Don Schreiber & Gary Stroik
1 × $6.00 -
×
 TRADINGWITHRAYNER - PRICE ACTION TRADING INSTITUTE
1 × $23.00
TRADINGWITHRAYNER - PRICE ACTION TRADING INSTITUTE
1 × $23.00 -
×
 Snapbacks CD
1 × $6.00
Snapbacks CD
1 × $6.00 -
×
 Option, Futures and Other Derivates 9th Edition
1 × $6.00
Option, Futures and Other Derivates 9th Edition
1 × $6.00 -
×
 Harmonic Elliott Wave: The Case for Modification of R. N. Elliott's Impulsive Wave Structure with Ian Copsey
1 × $6.00
Harmonic Elliott Wave: The Case for Modification of R. N. Elliott's Impulsive Wave Structure with Ian Copsey
1 × $6.00 -
×
 AI For Traders with Trading Markets
1 × $31.00
AI For Traders with Trading Markets
1 × $31.00
 with Arthur A.Hill")
Introduction to Candlestick (Article) with Arthur A.Hill
$6.00
File Size: Coming soon!
Delivery Time: 1–12 hours
Media Type: Online Course
Content Proof: Watch Here!
You may check content proof of “Introduction to Candlestick (Article) with Arthur A.Hill” below:
 with Arthur A.Hill")
Introduction to Candlestick (Article) with Arthur A. Hill
Candlestick charting is an essential tool for traders and investors, providing a visual representation of price movements. Arthur A. Hill, a renowned expert in technical analysis, offers a comprehensive introduction to candlestick charts, making them accessible to beginners and valuable for experienced traders. Let’s explore the basics of candlestick charting and how it can enhance your trading strategy.
What is a Candlestick Chart?
A candlestick chart is a type of financial chart used to describe price movements of a security, derivative, or currency.
Components of a Candlestick
- Body: The thick part of the candlestick, showing the opening and closing prices.
- Wicks/Shadows: The thin lines above and below the body, indicating the highest and lowest prices during the period.
- Color: Traditionally, a green or white body indicates a closing price higher than the opening price, while a red or black body indicates a closing price lower than the opening price.
History of Candlestick Charting
Candlestick charting originated in Japan over 300 years ago, developed by rice traders to track market prices and daily supply and demand.
Evolution of Candlestick Charts
Over the centuries, candlestick charting has evolved and gained popularity worldwide, becoming a staple in technical analysis.
Introduction to Western Markets
Candlestick charts were introduced to the Western financial markets in the late 20th century and quickly became popular among traders.
Advantages of Candlestick Charts
Candlestick charts offer several advantages over traditional bar charts and line charts.
Visual Clarity
Candlestick charts provide a clear and concise representation of price movements, making it easier to interpret market trends.
Immediate Insight
The color-coded bodies and wicks offer immediate insight into market sentiment and price direction.
Pattern Recognition
Candlestick charts are excellent for identifying patterns that can predict future price movements.
Common Candlestick Patterns
- Doji: Indicates indecision in the market.
- Hammer: Suggests a potential reversal from a downtrend.
- Engulfing: A strong signal of a potential trend reversal.
Basic Candlestick Patterns
Understanding basic candlestick patterns is crucial for any trader looking to use this charting method effectively.
Bullish Patterns
Bullish patterns indicate potential upward price movements.
Hammer and Inverted Hammer
- Hammer: A candlestick with a small body and a long lower wick, indicating potential reversal from a downtrend.
- Inverted Hammer: Similar to the hammer but with a long upper wick, suggesting a potential bullish reversal.
Bearish Patterns
Bearish patterns suggest potential downward price movements.
Shooting Star and Hanging Man
- Shooting Star: A candlestick with a small body and a long upper wick, indicating a potential reversal from an uptrend.
- Hanging Man: Similar to the hammer but occurs after an uptrend, signaling a potential bearish reversal.
Advanced Candlestick Patterns
For more experienced traders, advanced candlestick patterns provide deeper insights into market trends.
Engulfing Patterns
Engulfing patterns occur when a smaller candlestick is followed by a larger candlestick that completely engulfs the smaller one.
Bullish Engulfing
A bullish engulfing pattern occurs at the bottom of a downtrend and signals a potential upward reversal.
Bearish Engulfing
A bearish engulfing pattern appears at the top of an uptrend and suggests a potential downward reversal.
Morning Star and Evening Star
These patterns are three-candlestick formations that indicate strong trend reversals.
Morning Star
The morning star pattern consists of a bearish candle, a small indecisive candle, and a bullish candle, indicating a bullish reversal.
Evening Star
The evening star pattern includes a bullish candle, a small indecisive candle, and a bearish candle, suggesting a bearish reversal.
Incorporating Candlestick Charts into Your Trading Strategy
Candlestick charts are versatile and can be integrated into various trading strategies.
Combining with Other Indicators
Enhance the effectiveness of candlestick charts by combining them with other technical indicators.
Popular Indicators to Combine
- Moving Averages: Confirm trends and potential reversals.
- Relative Strength Index (RSI): Identify overbought or oversold conditions.
- Bollinger Bands: Measure market volatility and potential breakouts.
Setting Up Your Trading Platform
Most trading platforms offer candlestick charting options. Ensure you customize your charts to suit your trading style.
Customization Tips
- Time Frames: Choose appropriate time frames for your trading strategy.
- Color Schemes: Use distinct colors for bullish and bearish candles.
- Indicators: Add complementary indicators to your charts.
Common Mistakes to Avoid
Even with a robust understanding of candlestick charts, traders can make mistakes that affect their performance.
Over-reliance on Patterns
Relying solely on candlestick patterns without considering other factors can lead to false signals.
Diversify Analysis
Always use candlestick patterns in conjunction with other forms of analysis and market indicators.
Ignoring Market Context
Candlestick patterns can be misleading if not considered within the broader market context.
Comprehensive Analysis
Incorporate fundamental analysis and overall market trends to validate candlestick signals.
Conclusion
Candlestick charting, as introduced by Arthur A. Hill, offers a powerful tool for traders to understand and predict market movements. By mastering basic and advanced patterns, combining them with other technical indicators, and avoiding common pitfalls, traders can enhance their market analysis and trading performance. Whether you’re new to trading or an experienced trader, candlestick charts provide valuable insights that can guide your investment decisions.
Frequently Asked Questions:
- What is a candlestick chart?
A candlestick chart is a type of financial chart used to represent price movements over a specific period, showing the opening, closing, high, and low prices. - Why are candlestick charts popular among traders?
They provide visual clarity and help in identifying patterns that can predict future price movements. - What are some basic candlestick patterns?
Basic patterns include the hammer, inverted hammer, shooting star, and hanging man, which indicate potential market reversals. - Can candlestick charts be used with other technical indicators?
Yes, combining candlestick charts with indicators like moving averages, RSI, and Bollinger Bands enhances their effectiveness. - How can I avoid common mistakes when using candlestick charts?
Avoid over-relying on patterns and always consider the broader market context and other forms of analysis.
Be the first to review “Introduction to Candlestick (Article) with Arthur A.Hill”
You must be logged in to post a review.
Related products

Forex Trading
Quantamentals – The Next Great Forefront Of Trading and Investing with Trading Markets
Original price was: $1,495.00.$8.00Current price is: $8.00.
Original price was: $649.00.$20.00Current price is: $20.00.

Forex Trading
Original price was: $125.00.$17.00Current price is: $17.00.
Original price was: $197.00.$5.00Current price is: $5.00.

Original price was: $997.00.$13.00Current price is: $13.00.
Forex Trading
Original price was: $1,898.00.$10.00Current price is: $10.00.
Forex Trading
Original price was: $2,997.00.$23.00Current price is: $23.00.
Forex Trading
Original price was: $2,995.00.$31.00Current price is: $31.00.

Forex Trading
The Complete Guide to Multiple Time Frame Analysis & Reading Price Action with Aiman Almansoori
Original price was: $1,399.00.$13.00Current price is: $13.00.

Original price was: $999.00.$5.00Current price is: $5.00.

Forex Trading
Original price was: $500.00.$5.00Current price is: $5.00.
Forex Trading
Original price was: $4,997.00.$27.00Current price is: $27.00.

Forex Trading
Original price was: $697.00.$5.00Current price is: $5.00.

Forex Trading
Original price was: $2,000.00.$23.00Current price is: $23.00.
Forex Trading
Original price was: $850.00.$23.00Current price is: $23.00.
Forex Trading
Original price was: $397.00.$31.00Current price is: $31.00.

Original price was: $1,800.00.$54.00Current price is: $54.00.

Original price was: $497.00.$31.00Current price is: $31.00.
Original price was: $299.00.$8.00Current price is: $8.00.

Original price was: $450.00.$23.00Current price is: $23.00.

Reviews
There are no reviews yet.