-
×
 Learn Investing & Trading with Danny Devan
1 × $23.00
Learn Investing & Trading with Danny Devan
1 × $23.00 -
×
 Mastering Candlestick Charts II with Greg Capra
1 × $6.00
Mastering Candlestick Charts II with Greg Capra
1 × $6.00 -
×
 Formula to a Fortune with Steve Briese, Glen Ring
1 × $6.00
Formula to a Fortune with Steve Briese, Glen Ring
1 × $6.00 -
×
 Options Trading & Ultimate MasterClass With Tyrone Abela - FX Evolution
1 × $54.00
Options Trading & Ultimate MasterClass With Tyrone Abela - FX Evolution
1 × $54.00 -
×
 Futures Spreads Crash Course with Base Camp Trading
1 × $54.00
Futures Spreads Crash Course with Base Camp Trading
1 × $54.00 -
×
 The Orderflow Masterclass with PrimeTrading
1 × $17.00
The Orderflow Masterclass with PrimeTrading
1 × $17.00 -
×
 Trading Short TermSame Day Trades Sep 2023 with Dan Sheridan & Mark Fenton - Sheridan Options Mentoring
1 × $31.00
Trading Short TermSame Day Trades Sep 2023 with Dan Sheridan & Mark Fenton - Sheridan Options Mentoring
1 × $31.00 -
×
 The Trading Blueprint with Brad Goh - The Trading Geek
1 × $5.00
The Trading Blueprint with Brad Goh - The Trading Geek
1 × $5.00 -
×
 Options Trading with Adam Grimes - MarketLife
1 × $5.00
Options Trading with Adam Grimes - MarketLife
1 × $5.00 -
×
 Naked Trading Part 1 with Base Camp Trading
1 × $6.00
Naked Trading Part 1 with Base Camp Trading
1 × $6.00 -
×
 Traders Positioning System with Lee Gettess
1 × $4.00
Traders Positioning System with Lee Gettess
1 × $4.00 -
×
 Algo Trading Strategies 2017 with Autotrading Academy
1 × $6.00
Algo Trading Strategies 2017 with Autotrading Academy
1 × $6.00 -
×
 Trade the OEX with Arthur Darack
1 × $6.00
Trade the OEX with Arthur Darack
1 × $6.00 -
×
 Futures & Options for Dummies with Joe Duarte
1 × $6.00
Futures & Options for Dummies with Joe Duarte
1 × $6.00 -
×
 Forecast, Filings, & News with Jtrader
1 × $6.00
Forecast, Filings, & News with Jtrader
1 × $6.00 -
×
 Acme
1 × $6.00
Acme
1 × $6.00 -
×
 Day Trading and Swing Trading Futures with Price Action by Humberto Malaspina
1 × $5.00
Day Trading and Swing Trading Futures with Price Action by Humberto Malaspina
1 × $5.00 -
×
 Metals Webinar
1 × $6.00
Metals Webinar
1 × $6.00 -
×
 Power Index Method for Profitable Futures Trading with Harold Goldberg
1 × $6.00
Power Index Method for Profitable Futures Trading with Harold Goldberg
1 × $6.00 -
×
 The Prop Trading Code with Brannigan Barrett - Axia Futures
1 × $23.00
The Prop Trading Code with Brannigan Barrett - Axia Futures
1 × $23.00 -
×
 A Momentum Based Approach to Swing Trading with Dave Landry
1 × $6.00
A Momentum Based Approach to Swing Trading with Dave Landry
1 × $6.00 -
×
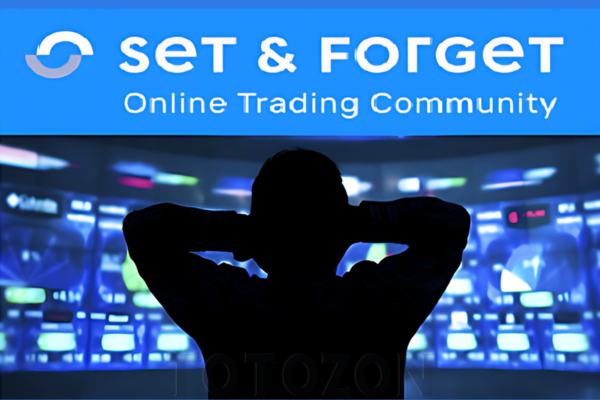 Online Trading Stocks - Cryptocurrencies & Forex with Set & Forget
1 × $5.00
Online Trading Stocks - Cryptocurrencies & Forex with Set & Forget
1 × $5.00 -
×
 A Conservative Plan to Make $3K Monthly on $25K with Dan Sheridan – Sheridan Options Mentoring
1 × $23.00
A Conservative Plan to Make $3K Monthly on $25K with Dan Sheridan – Sheridan Options Mentoring
1 × $23.00 -
×
 Advanced Course with Dimitri Wallace - Gold Minds Global
1 × $6.00
Advanced Course with Dimitri Wallace - Gold Minds Global
1 × $6.00 -
×
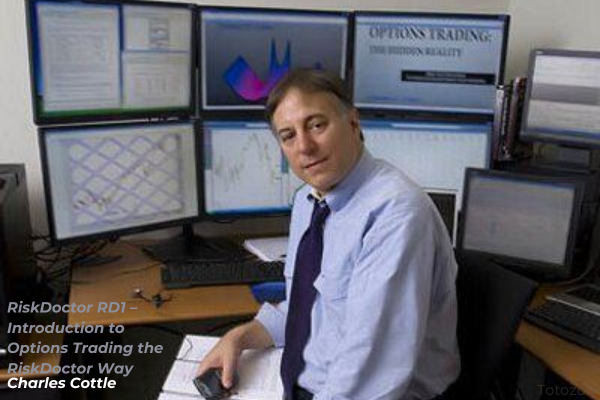 RiskDoctor RD1 – Introduction to Options Trading the RiskDoctor Way with Charles Cottle
1 × $6.00
RiskDoctor RD1 – Introduction to Options Trading the RiskDoctor Way with Charles Cottle
1 × $6.00 -
×
 Scalp Strategy and Flipping Small Accounts with Opes Trading Group
1 × $5.00
Scalp Strategy and Flipping Small Accounts with Opes Trading Group
1 × $5.00 -
×
 The Crypto Code with Joel Peterson - Adam Short
1 × $15.00
The Crypto Code with Joel Peterson - Adam Short
1 × $15.00 -
×
 Bond Market Course with The Macro Compass
1 × $15.00
Bond Market Course with The Macro Compass
1 × $15.00 -
×
 Pentagonal Time Cycle Theory
1 × $6.00
Pentagonal Time Cycle Theory
1 × $6.00 -
×
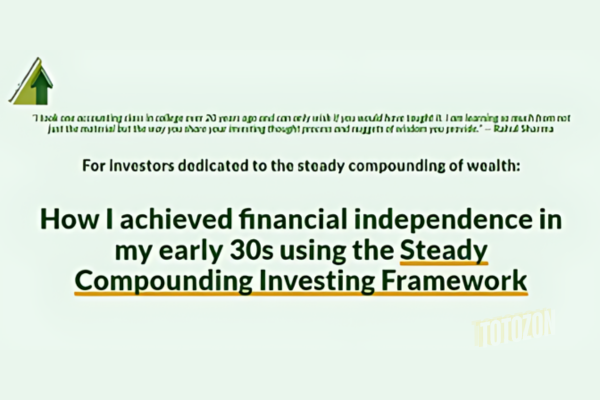 Steady Compounding Investing Academy Course with Steady Compounding
1 × $55.00
Steady Compounding Investing Academy Course with Steady Compounding
1 × $55.00 -
×
 The Deadly 7 Sins of Investing with Maury Fertig
1 × $6.00
The Deadly 7 Sins of Investing with Maury Fertig
1 × $6.00 -
×
 The Kiloby Inquiries Online with Scott Kiloby
1 × $39.00
The Kiloby Inquiries Online with Scott Kiloby
1 × $39.00 -
×
 SnD SMC Course
1 × $10.00
SnD SMC Course
1 × $10.00 -
×
 Forex for Profits with Todd Mitchell
1 × $85.00
Forex for Profits with Todd Mitchell
1 × $85.00 -
×
 Complete Course (Lectures 1-6) - Selling Options for Profits with Rodrigo Santano - Top Trader Academy
1 × $23.00
Complete Course (Lectures 1-6) - Selling Options for Profits with Rodrigo Santano - Top Trader Academy
1 × $23.00 -
×
 All About Bonds, Bond Mutual Funds & Bond ETFs (3rd Ed.) with Esme Faerber
1 × $6.00
All About Bonds, Bond Mutual Funds & Bond ETFs (3rd Ed.) with Esme Faerber
1 × $6.00 -
×
 Synthetic and Structured Assets: A Practical Guide to Investment and Risk with Erik Banks
1 × $6.00
Synthetic and Structured Assets: A Practical Guide to Investment and Risk with Erik Banks
1 × $6.00 -
×
 High Powered Investing with Amine Bouchentouf
1 × $6.00
High Powered Investing with Amine Bouchentouf
1 × $6.00 -
×
 Street-Smart Chart Reading – Volume 2 – Digging Deeper with Donald G.Worden
1 × $6.00
Street-Smart Chart Reading – Volume 2 – Digging Deeper with Donald G.Worden
1 × $6.00 -
×
 Financial Freedom Mastery Course with Freedom Team Trading
1 × $31.00
Financial Freedom Mastery Course with Freedom Team Trading
1 × $31.00 -
×
 TradingMind Course with Jack Bernstein
1 × $6.00
TradingMind Course with Jack Bernstein
1 × $6.00 -
×
 The Complete Options Trading Course (New 2019) with Wealthy Education
1 × $6.00
The Complete Options Trading Course (New 2019) with Wealthy Education
1 × $6.00 -
×
 How to Make Money in Deflationary Markets with Gary Shilling
1 × $6.00
How to Make Money in Deflationary Markets with Gary Shilling
1 × $6.00 -
×
 Deep Dive Butterfly Trading Strategy Class with SJG Trades
1 × $41.00
Deep Dive Butterfly Trading Strategy Class with SJG Trades
1 × $41.00 -
×
 Freedom Challenge Course with Steven Dux
1 × $5.00
Freedom Challenge Course with Steven Dux
1 × $5.00 -
×
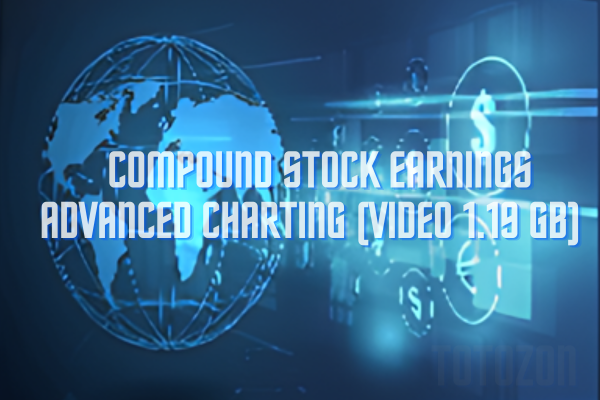 Compound Stock Earnings Advanced Charting (Video 1.19 GB)
1 × $15.00
Compound Stock Earnings Advanced Charting (Video 1.19 GB)
1 × $15.00 -
×
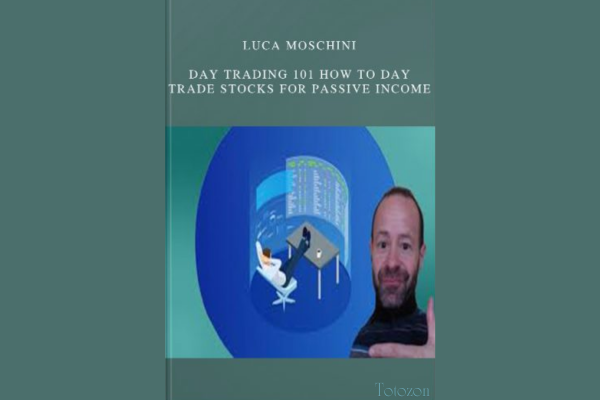 Day Trading 101 How To Day Trade Stocks for Passive Income
1 × $6.00
Day Trading 101 How To Day Trade Stocks for Passive Income
1 × $6.00 -
×
 Crystal Ball Pack PLUS bonus Live Trade By Pat Mitchell - Trick Trades
1 × $20.00
Crystal Ball Pack PLUS bonus Live Trade By Pat Mitchell - Trick Trades
1 × $20.00 -
×
 Fibonacci Mastery Course: Complete Guide to Trading with Fib By Todd Gordon
1 × $62.00
Fibonacci Mastery Course: Complete Guide to Trading with Fib By Todd Gordon
1 × $62.00 -
×
 I3T3 Complete Course with All Modules
1 × $10.00
I3T3 Complete Course with All Modules
1 × $10.00 -
×
 Increasing Vertical Spread Probabilities with Technical Analysis with Doc Severson
1 × $6.00
Increasing Vertical Spread Probabilities with Technical Analysis with Doc Severson
1 × $6.00 -
×
 EasyLanguage Home Study Course PDF Book + CD
1 × $6.00
EasyLanguage Home Study Course PDF Book + CD
1 × $6.00 -
×
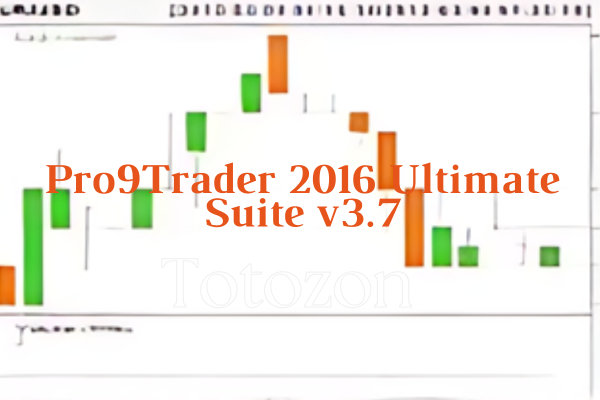 Pro9Trader 2016 Ultimate Suite v3.7
1 × $62.00
Pro9Trader 2016 Ultimate Suite v3.7
1 × $62.00 -
×
 5-Week Portfolio (No Bonus) - Criticaltrading
1 × $39.00
5-Week Portfolio (No Bonus) - Criticaltrading
1 × $39.00 -
×
 Algo Trading Masterclass with Ali Casey - StatOasis
1 × $23.00
Algo Trading Masterclass with Ali Casey - StatOasis
1 × $23.00 -
×
 Candlestick and Pivot Point Trading Triggers with John Person
1 × $6.00
Candlestick and Pivot Point Trading Triggers with John Person
1 × $6.00 -
×
 Private Access Pro Webinars 2021-2022 with Trader Lion
1 × $5.00
Private Access Pro Webinars 2021-2022 with Trader Lion
1 × $5.00 -
×
 W. D Gann 's Square Of 9 Applied To Modern Markets with Sean Avidar - Hexatrade350
1 × $23.00
W. D Gann 's Square Of 9 Applied To Modern Markets with Sean Avidar - Hexatrade350
1 × $23.00 -
×
 Fundamentals of the Securities Industry with William A.Rini
1 × $6.00
Fundamentals of the Securities Industry with William A.Rini
1 × $6.00 -
×
 Fibsdontlie - Fibs Don’t Lie Advanced Course
1 × $15.00
Fibsdontlie - Fibs Don’t Lie Advanced Course
1 × $15.00 -
×
 A Day In The Life Of A Forex Trader with Vic Noble & Shirley Hudson
1 × $23.00
A Day In The Life Of A Forex Trader with Vic Noble & Shirley Hudson
1 × $23.00 -
×
 Dynamic Gann Levels with Don Fisher
1 × $6.00
Dynamic Gann Levels with Don Fisher
1 × $6.00 -
×
 Practical Portfolio Performance Measurement and Attribution (2nd Ed.) with Carl Bacon
1 × $6.00
Practical Portfolio Performance Measurement and Attribution (2nd Ed.) with Carl Bacon
1 × $6.00 -
×
 Compass Trading System with Right Line Trading
1 × $39.00
Compass Trading System with Right Line Trading
1 × $39.00 -
×
 Sure Fire Forex Trading with Mark McRae
1 × $6.00
Sure Fire Forex Trading with Mark McRae
1 × $6.00 -
×
 The Instagram DM Automation Playbook with Natasha Takahashi
1 × $6.00
The Instagram DM Automation Playbook with Natasha Takahashi
1 × $6.00 -
×
 AI For Traders with Trading Markets
1 × $31.00
AI For Traders with Trading Markets
1 × $31.00 -
×
 How I Quit my Job & Turned 6k into Half Million Trading Commodities with Bob Buran
1 × $4.00
How I Quit my Job & Turned 6k into Half Million Trading Commodities with Bob Buran
1 × $4.00 -
×
 NQ Price Action Mastery with Trade Smart
1 × $15.00
NQ Price Action Mastery with Trade Smart
1 × $15.00 -
×
 Forex Robotron (Unlocked)
1 × $6.00
Forex Robotron (Unlocked)
1 × $6.00 -
×
 All Candlestick Patterns Tested And Ranked with Quantified Strategies
1 × $8.00
All Candlestick Patterns Tested And Ranked with Quantified Strategies
1 × $8.00 -
×
 Stock Market Strategies That Work with Jack Bernstein
1 × $6.00
Stock Market Strategies That Work with Jack Bernstein
1 × $6.00 -
×
 How to Avoid Tax on Your Stock Market Profits with Lee Hadnum
1 × $6.00
How to Avoid Tax on Your Stock Market Profits with Lee Hadnum
1 × $6.00 -
×
 Emini, Forex, Stock Course COMPLETE Series Recorded Seminar 2009 - 49 Modules in 3 DVDs (SpecialistTrading.com)
1 × $78.00
Emini, Forex, Stock Course COMPLETE Series Recorded Seminar 2009 - 49 Modules in 3 DVDs (SpecialistTrading.com)
1 × $78.00 -
×
 Sovereign Man Confidential
1 × $6.00
Sovereign Man Confidential
1 × $6.00 -
×
 Crash Profits Make Money When Stocks Sink and Soar with Martin D.Weiss
1 × $6.00
Crash Profits Make Money When Stocks Sink and Soar with Martin D.Weiss
1 × $6.00 -
×
 Wyckoff Unleashed Official Online Course (2018) with Wyckoffsmi
1 × $23.00
Wyckoff Unleashed Official Online Course (2018) with Wyckoffsmi
1 × $23.00 -
×
 Trading Books with Michael Harris
1 × $6.00
Trading Books with Michael Harris
1 × $6.00 -
×
 Volatile Markets Made Easy: Trading Stocks and Options for Increased Profits with Guy Cohen
1 × $6.00
Volatile Markets Made Easy: Trading Stocks and Options for Increased Profits with Guy Cohen
1 × $6.00 -
×
 Advanced Strategies for Option Trading Success with James Bittman
1 × $6.00
Advanced Strategies for Option Trading Success with James Bittman
1 × $6.00 -
×
 Essentials in Quantitative Trading QT01 By HangukQuant's
1 × $23.00
Essentials in Quantitative Trading QT01 By HangukQuant's
1 × $23.00 -
×
 Century Capital Group Course with Dylan Forexia
1 × $6.00
Century Capital Group Course with Dylan Forexia
1 × $6.00 -
×
 Passages To Profitability: A Comprehensive Guide To Channel Trading with Professor Jeff Bierman, CMT
1 × $6.00
Passages To Profitability: A Comprehensive Guide To Channel Trading with Professor Jeff Bierman, CMT
1 × $6.00 -
×
 CFA Level 3 - Examination Morning Session – Essay (2002)
1 × $6.00
CFA Level 3 - Examination Morning Session – Essay (2002)
1 × $6.00 -
×
 Mapping the Markets: A Guide to Stock Market Analysis with Deborah Owen & Robin Griffiths
1 × $6.00
Mapping the Markets: A Guide to Stock Market Analysis with Deborah Owen & Robin Griffiths
1 × $6.00 -
×
 Core Strategy Program + Extended Learning Track with Ota Courses
1 × $124.00
Core Strategy Program + Extended Learning Track with Ota Courses
1 × $124.00 -
×
 STERLING SUHR’S ADVANCED FOREX BANK TRADING COURSE (DAYTRADING FOREX LIVE COURSE) 2017
1 × $15.00
STERLING SUHR’S ADVANCED FOREX BANK TRADING COURSE (DAYTRADING FOREX LIVE COURSE) 2017
1 × $15.00 -
×
 A Grand Supercycle Top Webinar with Steven Hochberg
1 × $6.00
A Grand Supercycle Top Webinar with Steven Hochberg
1 × $6.00 -
×
 How to Trade the New Single Stock Futures with Jack Bernstein
1 × $6.00
How to Trade the New Single Stock Futures with Jack Bernstein
1 × $6.00 -
×
 SOAP. Served On A Platter CD with David Elliott
1 × $6.00
SOAP. Served On A Platter CD with David Elliott
1 × $6.00 -
×
 The Indices Orderflow Masterclass with The Forex Scalpers
1 × $23.00
The Indices Orderflow Masterclass with The Forex Scalpers
1 × $23.00
 with Arthur A.Hill")
Introduction to Candlestick (Article) with Arthur A.Hill
$6.00
File Size: Coming soon!
Delivery Time: 1–12 hours
Media Type: Online Course
Content Proof: Watch Here!
You may check content proof of “Introduction to Candlestick (Article) with Arthur A.Hill” below:
 with Arthur A.Hill")
Introduction to Candlestick (Article) with Arthur A. Hill
Candlestick charting is an essential tool for traders and investors, providing a visual representation of price movements. Arthur A. Hill, a renowned expert in technical analysis, offers a comprehensive introduction to candlestick charts, making them accessible to beginners and valuable for experienced traders. Let’s explore the basics of candlestick charting and how it can enhance your trading strategy.
What is a Candlestick Chart?
A candlestick chart is a type of financial chart used to describe price movements of a security, derivative, or currency.
Components of a Candlestick
- Body: The thick part of the candlestick, showing the opening and closing prices.
- Wicks/Shadows: The thin lines above and below the body, indicating the highest and lowest prices during the period.
- Color: Traditionally, a green or white body indicates a closing price higher than the opening price, while a red or black body indicates a closing price lower than the opening price.
History of Candlestick Charting
Candlestick charting originated in Japan over 300 years ago, developed by rice traders to track market prices and daily supply and demand.
Evolution of Candlestick Charts
Over the centuries, candlestick charting has evolved and gained popularity worldwide, becoming a staple in technical analysis.
Introduction to Western Markets
Candlestick charts were introduced to the Western financial markets in the late 20th century and quickly became popular among traders.
Advantages of Candlestick Charts
Candlestick charts offer several advantages over traditional bar charts and line charts.
Visual Clarity
Candlestick charts provide a clear and concise representation of price movements, making it easier to interpret market trends.
Immediate Insight
The color-coded bodies and wicks offer immediate insight into market sentiment and price direction.
Pattern Recognition
Candlestick charts are excellent for identifying patterns that can predict future price movements.
Common Candlestick Patterns
- Doji: Indicates indecision in the market.
- Hammer: Suggests a potential reversal from a downtrend.
- Engulfing: A strong signal of a potential trend reversal.
Basic Candlestick Patterns
Understanding basic candlestick patterns is crucial for any trader looking to use this charting method effectively.
Bullish Patterns
Bullish patterns indicate potential upward price movements.
Hammer and Inverted Hammer
- Hammer: A candlestick with a small body and a long lower wick, indicating potential reversal from a downtrend.
- Inverted Hammer: Similar to the hammer but with a long upper wick, suggesting a potential bullish reversal.
Bearish Patterns
Bearish patterns suggest potential downward price movements.
Shooting Star and Hanging Man
- Shooting Star: A candlestick with a small body and a long upper wick, indicating a potential reversal from an uptrend.
- Hanging Man: Similar to the hammer but occurs after an uptrend, signaling a potential bearish reversal.
Advanced Candlestick Patterns
For more experienced traders, advanced candlestick patterns provide deeper insights into market trends.
Engulfing Patterns
Engulfing patterns occur when a smaller candlestick is followed by a larger candlestick that completely engulfs the smaller one.
Bullish Engulfing
A bullish engulfing pattern occurs at the bottom of a downtrend and signals a potential upward reversal.
Bearish Engulfing
A bearish engulfing pattern appears at the top of an uptrend and suggests a potential downward reversal.
Morning Star and Evening Star
These patterns are three-candlestick formations that indicate strong trend reversals.
Morning Star
The morning star pattern consists of a bearish candle, a small indecisive candle, and a bullish candle, indicating a bullish reversal.
Evening Star
The evening star pattern includes a bullish candle, a small indecisive candle, and a bearish candle, suggesting a bearish reversal.
Incorporating Candlestick Charts into Your Trading Strategy
Candlestick charts are versatile and can be integrated into various trading strategies.
Combining with Other Indicators
Enhance the effectiveness of candlestick charts by combining them with other technical indicators.
Popular Indicators to Combine
- Moving Averages: Confirm trends and potential reversals.
- Relative Strength Index (RSI): Identify overbought or oversold conditions.
- Bollinger Bands: Measure market volatility and potential breakouts.
Setting Up Your Trading Platform
Most trading platforms offer candlestick charting options. Ensure you customize your charts to suit your trading style.
Customization Tips
- Time Frames: Choose appropriate time frames for your trading strategy.
- Color Schemes: Use distinct colors for bullish and bearish candles.
- Indicators: Add complementary indicators to your charts.
Common Mistakes to Avoid
Even with a robust understanding of candlestick charts, traders can make mistakes that affect their performance.
Over-reliance on Patterns
Relying solely on candlestick patterns without considering other factors can lead to false signals.
Diversify Analysis
Always use candlestick patterns in conjunction with other forms of analysis and market indicators.
Ignoring Market Context
Candlestick patterns can be misleading if not considered within the broader market context.
Comprehensive Analysis
Incorporate fundamental analysis and overall market trends to validate candlestick signals.
Conclusion
Candlestick charting, as introduced by Arthur A. Hill, offers a powerful tool for traders to understand and predict market movements. By mastering basic and advanced patterns, combining them with other technical indicators, and avoiding common pitfalls, traders can enhance their market analysis and trading performance. Whether you’re new to trading or an experienced trader, candlestick charts provide valuable insights that can guide your investment decisions.
Frequently Asked Questions:
- What is a candlestick chart?
A candlestick chart is a type of financial chart used to represent price movements over a specific period, showing the opening, closing, high, and low prices. - Why are candlestick charts popular among traders?
They provide visual clarity and help in identifying patterns that can predict future price movements. - What are some basic candlestick patterns?
Basic patterns include the hammer, inverted hammer, shooting star, and hanging man, which indicate potential market reversals. - Can candlestick charts be used with other technical indicators?
Yes, combining candlestick charts with indicators like moving averages, RSI, and Bollinger Bands enhances their effectiveness. - How can I avoid common mistakes when using candlestick charts?
Avoid over-relying on patterns and always consider the broader market context and other forms of analysis.
Be the first to review “Introduction to Candlestick (Article) with Arthur A.Hill”
You must be logged in to post a review.
Related products
Forex Trading
Original price was: $1,098.00.$39.00Current price is: $39.00.

Original price was: $2,120.00.$15.00Current price is: $15.00.

Original price was: $997.00.$8.00Current price is: $8.00.

Forex Trading
Original price was: $550.00.$5.00Current price is: $5.00.
Original price was: $649.00.$20.00Current price is: $20.00.
Forex Trading
Original price was: $1,898.00.$10.00Current price is: $10.00.

Original price was: $497.00.$11.00Current price is: $11.00.

Forex Trading
Original price was: $239.00.$8.00Current price is: $8.00.

Original price was: $700.00.$39.00Current price is: $39.00.

Forex Trading
Original price was: $500.00.$5.00Current price is: $5.00.

Original price was: $799.00.$15.00Current price is: $15.00.

Original price was: $1,849.00.$15.00Current price is: $15.00.

Forex Trading
The Complete Guide to Multiple Time Frame Analysis & Reading Price Action with Aiman Almansoori
Original price was: $1,399.00.$13.00Current price is: $13.00.
Forex Trading
Original price was: $850.00.$23.00Current price is: $23.00.

Original price was: $895.00.$15.00Current price is: $15.00.

Original price was: $4,995.00.$15.00Current price is: $15.00.
Forex Trading
Original price was: $697.00.$5.00Current price is: $5.00.

Forex Trading
Original price was: $2,997.00.$23.00Current price is: $23.00.

Forex Trading
Original price was: $4,997.00.$27.00Current price is: $27.00.

Original price was: $299.00.$8.00Current price is: $8.00.

Reviews
There are no reviews yet.