-
×
 Home Run Options Trading Course with Dave Aquino - Base Camp Trading
1 × $11.00
Home Run Options Trading Course with Dave Aquino - Base Camp Trading
1 × $11.00 -
×
 A Momentum Based Approach to Swing Trading with Dave Landry
1 × $6.00
A Momentum Based Approach to Swing Trading with Dave Landry
1 × $6.00 -
×
 WondaFX Signature Strategy with WondaFX
1 × $5.00
WondaFX Signature Strategy with WondaFX
1 × $5.00 -
×
 Deep Dive Butterfly Trading Strategy Class with SJG Trades
1 × $41.00
Deep Dive Butterfly Trading Strategy Class with SJG Trades
1 × $41.00 -
×
 ETF Trading Strategies Revealed with David Vomund
1 × $6.00
ETF Trading Strategies Revealed with David Vomund
1 × $6.00 -
×
 3 Steps To Supply/Demand + 3 Steps To Market Profile 10% Off Combined Price
1 × $23.00
3 Steps To Supply/Demand + 3 Steps To Market Profile 10% Off Combined Price
1 × $23.00 -
×
 The Prop Trading Code with Brannigan Barrett - Axia Futures
1 × $23.00
The Prop Trading Code with Brannigan Barrett - Axia Futures
1 × $23.00 -
×
 Fixed Income Securities (2nd Ed.) with Bruce Tuckman
1 × $10.00
Fixed Income Securities (2nd Ed.) with Bruce Tuckman
1 × $10.00 -
×
 YTC Price Action Trader
1 × $6.00
YTC Price Action Trader
1 × $6.00 -
×
 Contrarian Investment Strategies: The Next Generation with David Dreman
1 × $4.00
Contrarian Investment Strategies: The Next Generation with David Dreman
1 × $4.00 -
×
 TradeCraft: Your Path to Peak Performance Trading By Adam Grimes
1 × $15.00
TradeCraft: Your Path to Peak Performance Trading By Adam Grimes
1 × $15.00 -
×
 W. D Gann 's Square Of 9 Applied To Modern Markets with Sean Avidar - Hexatrade350
1 × $23.00
W. D Gann 's Square Of 9 Applied To Modern Markets with Sean Avidar - Hexatrade350
1 × $23.00 -
×
 TRADING NFX Course with Andrew NFX
1 × $5.00
TRADING NFX Course with Andrew NFX
1 × $5.00 -
×
 Short-Term Trading, Long-Term Profits with John Leizman - McGraw-Hill
1 × $6.00
Short-Term Trading, Long-Term Profits with John Leizman - McGraw-Hill
1 × $6.00 -
×
 Daily Price Action
1 × $23.00
Daily Price Action
1 × $23.00 -
×
 Wyckoff Unleashed Official Online Course (2018) with Wyckoffsmi
1 × $23.00
Wyckoff Unleashed Official Online Course (2018) with Wyckoffsmi
1 × $23.00 -
×
 5 Day Volume Profile Analysis Indicator Course with Mark Stone
1 × $54.00
5 Day Volume Profile Analysis Indicator Course with Mark Stone
1 × $54.00 -
×
 Profit Trading VIX Options Course with Don Kaufman
1 × $6.00
Profit Trading VIX Options Course with Don Kaufman
1 × $6.00 -
×
 Matrix Spread Options Trading Course with Base Camp Trading
1 × $31.00
Matrix Spread Options Trading Course with Base Camp Trading
1 × $31.00 -
×
 The Raptor 10 Momentum Methodology Course
1 × $6.00
The Raptor 10 Momentum Methodology Course
1 × $6.00 -
×
 Compass Trading System with Right Line Trading
1 × $39.00
Compass Trading System with Right Line Trading
1 × $39.00 -
×
 Mao, Marx & the Market: Capitalist Adventures in Russia and China with Dean LeBaro
1 × $6.00
Mao, Marx & the Market: Capitalist Adventures in Russia and China with Dean LeBaro
1 × $6.00 -
×
 Day Trading Options Guide PDF with Matt Diamond
1 × $23.00
Day Trading Options Guide PDF with Matt Diamond
1 × $23.00 -
×
 Advanced Spread Trading with Guy Bower - MasterClass Trader
1 × $15.00
Advanced Spread Trading with Guy Bower - MasterClass Trader
1 × $15.00 -
×
 Advanced Fibonacci Trading with Neal Hughes
1 × $6.00
Advanced Fibonacci Trading with Neal Hughes
1 × $6.00 -
×
 AI For Traders with Trading Markets
1 × $31.00
AI For Traders with Trading Markets
1 × $31.00 -
×
 SNR Trader Course with Ariff T
1 × $6.00
SNR Trader Course with Ariff T
1 × $6.00 -
×
 Private Access Pro Webinars 2021-2022 with Trader Lion
1 × $5.00
Private Access Pro Webinars 2021-2022 with Trader Lion
1 × $5.00 -
×
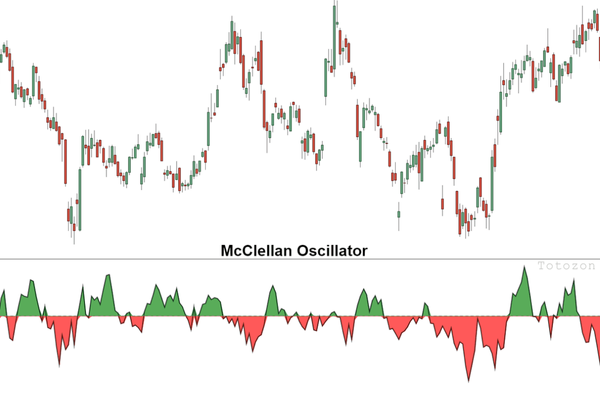 The McClellan Oscillator and Other Tools for with Tom McClellan
1 × $6.00
The McClellan Oscillator and Other Tools for with Tom McClellan
1 × $6.00 -
×
 Traders Positioning System with Lee Gettess
1 × $4.00
Traders Positioning System with Lee Gettess
1 × $4.00 -
×
 Best of the Best: Collars with Amy Meissner & Scott Ruble
1 × $15.00
Best of the Best: Collars with Amy Meissner & Scott Ruble
1 × $15.00 -
×
 Full Credit Spreads with Ryan Litchfield
1 × $6.00
Full Credit Spreads with Ryan Litchfield
1 × $6.00 -
×
 How To Become StressFree Trader with Jason Starzec
1 × $4.00
How To Become StressFree Trader with Jason Starzec
1 × $4.00 -
×
 ICT Prodigy Trading Course – $650K in Payouts with Alex Solignani
1 × $15.00
ICT Prodigy Trading Course – $650K in Payouts with Alex Solignani
1 × $15.00 -
×
 Forecasting Financial Markets (2nd Ed.)
1 × $6.00
Forecasting Financial Markets (2nd Ed.)
1 × $6.00 -
×
 Core Strategy Program + Extended Learning Track with Ota Courses
1 × $124.00
Core Strategy Program + Extended Learning Track with Ota Courses
1 × $124.00 -
×
 Smart Money Trading Course with Prosperity Academy
1 × $5.00
Smart Money Trading Course with Prosperity Academy
1 × $5.00 -
×
 Complete Day Trading Course with The Trading Floor
1 × $13.00
Complete Day Trading Course with The Trading Floor
1 × $13.00 -
×
 Sacredscience - W.F.Whitehead – Occultism Simplified
1 × $6.00
Sacredscience - W.F.Whitehead – Occultism Simplified
1 × $6.00 -
×
 The Beginners Guide to Commodities Investing with Brian & Gayle Rice
1 × $6.00
The Beginners Guide to Commodities Investing with Brian & Gayle Rice
1 × $6.00 -
×
 Synthetic and Structured Assets: A Practical Guide to Investment and Risk with Erik Banks
1 × $6.00
Synthetic and Structured Assets: A Practical Guide to Investment and Risk with Erik Banks
1 × $6.00 -
×
 Candlestick Charts with Clive Lambert
1 × $6.00
Candlestick Charts with Clive Lambert
1 × $6.00 -
×
 White Phoenix’s The Smart (Money) Approach to Trading with Jayson Casper
1 × $39.00
White Phoenix’s The Smart (Money) Approach to Trading with Jayson Casper
1 × $39.00 -
×
 Snapbacks CD
1 × $6.00
Snapbacks CD
1 × $6.00 -
×
 Forex Retracement Theory with CopperChips
1 × $6.00
Forex Retracement Theory with CopperChips
1 × $6.00 -
×
 Practical Elliott Wave Trading Strategies with Robert Miner
1 × $6.00
Practical Elliott Wave Trading Strategies with Robert Miner
1 × $6.00 -
×
 The Trading Blueprint with Brad Goh - The Trading Geek
1 × $5.00
The Trading Blueprint with Brad Goh - The Trading Geek
1 × $5.00 -
×
 A Day In The Life Of A Forex Trader with Vic Noble & Shirley Hudson
1 × $23.00
A Day In The Life Of A Forex Trader with Vic Noble & Shirley Hudson
1 × $23.00 -
×
 Advances in International Investments: Traditional and Alternative Approaches with Hung-Gay Fung, Xiaoqing Eleanor Xu & Jot Yau
1 × $6.00
Advances in International Investments: Traditional and Alternative Approaches with Hung-Gay Fung, Xiaoqing Eleanor Xu & Jot Yau
1 × $6.00 -
×
 Sea Lanes & Pipelines with Bernard D.Cole
1 × $6.00
Sea Lanes & Pipelines with Bernard D.Cole
1 × $6.00 -
×
 Trading The Hobbs Triple Crown Strategy with Derrik Hobbs
1 × $6.00
Trading The Hobbs Triple Crown Strategy with Derrik Hobbs
1 × $6.00 -
×
 A Really Friendly Guide to Wavelets with C.Vallens
1 × $6.00
A Really Friendly Guide to Wavelets with C.Vallens
1 × $6.00 -
×
 Forex Millionaire Course with Willis University
1 × $6.00
Forex Millionaire Course with Willis University
1 × $6.00 -
×
 The Naked Eye: Raw Data Analytics with Edgar Torres - Raw Data Analytics
1 × $8.00
The Naked Eye: Raw Data Analytics with Edgar Torres - Raw Data Analytics
1 × $8.00 -
×
 Finding Alpha: The Search for Alpha When Risk and Return Break Down with Eric Falkenstein
1 × $6.00
Finding Alpha: The Search for Alpha When Risk and Return Break Down with Eric Falkenstein
1 × $6.00 -
×
 SQX Mentorship with Tip Toe Hippo
1 × $23.00
SQX Mentorship with Tip Toe Hippo
1 × $23.00 -
×
 Financial Fortress with TradeSmart University
1 × $6.00
Financial Fortress with TradeSmart University
1 × $6.00 -
×
 Trading Short TermSame Day Trades Sep 2023 with Dan Sheridan & Mark Fenton - Sheridan Options Mentoring
1 × $31.00
Trading Short TermSame Day Trades Sep 2023 with Dan Sheridan & Mark Fenton - Sheridan Options Mentoring
1 × $31.00
 with Arthur A.Hill")
Introduction to Candlestick (Article) with Arthur A.Hill
$6.00
File Size: Coming soon!
Delivery Time: 1–12 hours
Media Type: Online Course
Content Proof: Watch Here!
You may check content proof of “Introduction to Candlestick (Article) with Arthur A.Hill” below:
 with Arthur A.Hill")
Introduction to Candlestick (Article) with Arthur A. Hill
Candlestick charting is an essential tool for traders and investors, providing a visual representation of price movements. Arthur A. Hill, a renowned expert in technical analysis, offers a comprehensive introduction to candlestick charts, making them accessible to beginners and valuable for experienced traders. Let’s explore the basics of candlestick charting and how it can enhance your trading strategy.
What is a Candlestick Chart?
A candlestick chart is a type of financial chart used to describe price movements of a security, derivative, or currency.
Components of a Candlestick
- Body: The thick part of the candlestick, showing the opening and closing prices.
- Wicks/Shadows: The thin lines above and below the body, indicating the highest and lowest prices during the period.
- Color: Traditionally, a green or white body indicates a closing price higher than the opening price, while a red or black body indicates a closing price lower than the opening price.
History of Candlestick Charting
Candlestick charting originated in Japan over 300 years ago, developed by rice traders to track market prices and daily supply and demand.
Evolution of Candlestick Charts
Over the centuries, candlestick charting has evolved and gained popularity worldwide, becoming a staple in technical analysis.
Introduction to Western Markets
Candlestick charts were introduced to the Western financial markets in the late 20th century and quickly became popular among traders.
Advantages of Candlestick Charts
Candlestick charts offer several advantages over traditional bar charts and line charts.
Visual Clarity
Candlestick charts provide a clear and concise representation of price movements, making it easier to interpret market trends.
Immediate Insight
The color-coded bodies and wicks offer immediate insight into market sentiment and price direction.
Pattern Recognition
Candlestick charts are excellent for identifying patterns that can predict future price movements.
Common Candlestick Patterns
- Doji: Indicates indecision in the market.
- Hammer: Suggests a potential reversal from a downtrend.
- Engulfing: A strong signal of a potential trend reversal.
Basic Candlestick Patterns
Understanding basic candlestick patterns is crucial for any trader looking to use this charting method effectively.
Bullish Patterns
Bullish patterns indicate potential upward price movements.
Hammer and Inverted Hammer
- Hammer: A candlestick with a small body and a long lower wick, indicating potential reversal from a downtrend.
- Inverted Hammer: Similar to the hammer but with a long upper wick, suggesting a potential bullish reversal.
Bearish Patterns
Bearish patterns suggest potential downward price movements.
Shooting Star and Hanging Man
- Shooting Star: A candlestick with a small body and a long upper wick, indicating a potential reversal from an uptrend.
- Hanging Man: Similar to the hammer but occurs after an uptrend, signaling a potential bearish reversal.
Advanced Candlestick Patterns
For more experienced traders, advanced candlestick patterns provide deeper insights into market trends.
Engulfing Patterns
Engulfing patterns occur when a smaller candlestick is followed by a larger candlestick that completely engulfs the smaller one.
Bullish Engulfing
A bullish engulfing pattern occurs at the bottom of a downtrend and signals a potential upward reversal.
Bearish Engulfing
A bearish engulfing pattern appears at the top of an uptrend and suggests a potential downward reversal.
Morning Star and Evening Star
These patterns are three-candlestick formations that indicate strong trend reversals.
Morning Star
The morning star pattern consists of a bearish candle, a small indecisive candle, and a bullish candle, indicating a bullish reversal.
Evening Star
The evening star pattern includes a bullish candle, a small indecisive candle, and a bearish candle, suggesting a bearish reversal.
Incorporating Candlestick Charts into Your Trading Strategy
Candlestick charts are versatile and can be integrated into various trading strategies.
Combining with Other Indicators
Enhance the effectiveness of candlestick charts by combining them with other technical indicators.
Popular Indicators to Combine
- Moving Averages: Confirm trends and potential reversals.
- Relative Strength Index (RSI): Identify overbought or oversold conditions.
- Bollinger Bands: Measure market volatility and potential breakouts.
Setting Up Your Trading Platform
Most trading platforms offer candlestick charting options. Ensure you customize your charts to suit your trading style.
Customization Tips
- Time Frames: Choose appropriate time frames for your trading strategy.
- Color Schemes: Use distinct colors for bullish and bearish candles.
- Indicators: Add complementary indicators to your charts.
Common Mistakes to Avoid
Even with a robust understanding of candlestick charts, traders can make mistakes that affect their performance.
Over-reliance on Patterns
Relying solely on candlestick patterns without considering other factors can lead to false signals.
Diversify Analysis
Always use candlestick patterns in conjunction with other forms of analysis and market indicators.
Ignoring Market Context
Candlestick patterns can be misleading if not considered within the broader market context.
Comprehensive Analysis
Incorporate fundamental analysis and overall market trends to validate candlestick signals.
Conclusion
Candlestick charting, as introduced by Arthur A. Hill, offers a powerful tool for traders to understand and predict market movements. By mastering basic and advanced patterns, combining them with other technical indicators, and avoiding common pitfalls, traders can enhance their market analysis and trading performance. Whether you’re new to trading or an experienced trader, candlestick charts provide valuable insights that can guide your investment decisions.
Frequently Asked Questions:
- What is a candlestick chart?
A candlestick chart is a type of financial chart used to represent price movements over a specific period, showing the opening, closing, high, and low prices. - Why are candlestick charts popular among traders?
They provide visual clarity and help in identifying patterns that can predict future price movements. - What are some basic candlestick patterns?
Basic patterns include the hammer, inverted hammer, shooting star, and hanging man, which indicate potential market reversals. - Can candlestick charts be used with other technical indicators?
Yes, combining candlestick charts with indicators like moving averages, RSI, and Bollinger Bands enhances their effectiveness. - How can I avoid common mistakes when using candlestick charts?
Avoid over-relying on patterns and always consider the broader market context and other forms of analysis.
Be the first to review “Introduction to Candlestick (Article) with Arthur A.Hill”
You must be logged in to post a review.
Related products

Original price was: $999.00.$5.00Current price is: $5.00.
Original price was: $497.00.$31.00Current price is: $31.00.
Original price was: $1,200.00.$23.00Current price is: $23.00.
Forex Trading
Original price was: $1,098.00.$39.00Current price is: $39.00.

Forex Trading
Original price was: $4,997.00.$27.00Current price is: $27.00.
Forex Trading
Original price was: $2,995.00.$31.00Current price is: $31.00.

Forex Trading
Original price was: $499.00.$15.00Current price is: $15.00.

Original price was: $299.00.$8.00Current price is: $8.00.

Forex Trading
Original price was: $799.00.$15.00Current price is: $15.00.
Forex Trading
Original price was: $397.00.$31.00Current price is: $31.00.
Forex Trading
Original price was: $550.00.$5.00Current price is: $5.00.

Forex Trading
Original price was: $2,000.00.$23.00Current price is: $23.00.

Original price was: $649.00.$20.00Current price is: $20.00.
Forex Trading
Original price was: $500.00.$5.00Current price is: $5.00.
Original price was: $2,120.00.$15.00Current price is: $15.00.

Original price was: $1,849.00.$15.00Current price is: $15.00.
Original price was: $497.00.$11.00Current price is: $11.00.
Original price was: $799.00.$15.00Current price is: $15.00.
Original price was: $4,995.00.$15.00Current price is: $15.00.
Original price was: $700.00.$39.00Current price is: $39.00.

Reviews
There are no reviews yet.