-
×
 The Aggressive Conservative Investor with Martin Whitman & Martin Shubik
1 × $6.00
The Aggressive Conservative Investor with Martin Whitman & Martin Shubik
1 × $6.00 -
×
 Trading With DiNapoli Levels
1 × $6.00
Trading With DiNapoli Levels
1 × $6.00 -
×
 Learn Before you Loose
1 × $6.00
Learn Before you Loose
1 × $6.00 -
×
 Scalp Strategy and Flipping Small Accounts with Opes Trading Group
1 × $5.00
Scalp Strategy and Flipping Small Accounts with Opes Trading Group
1 × $5.00 -
×
 Matrix Spread Options Trading Course with Base Camp Trading
1 × $31.00
Matrix Spread Options Trading Course with Base Camp Trading
1 × $31.00 -
×
 Advanced Nuances & Exceptions eCourse with Jim Dalton
1 × $15.00
Advanced Nuances & Exceptions eCourse with Jim Dalton
1 × $15.00 -
×
 Survive and Thrive in Extreme Volatility Class with Don Kaufman
1 × $6.00
Survive and Thrive in Extreme Volatility Class with Don Kaufman
1 × $6.00 -
×
 Mastermind Bootcamp + Core Concepts Mastery with DreamsFX
1 × $6.00
Mastermind Bootcamp + Core Concepts Mastery with DreamsFX
1 × $6.00 -
×
 Advanced Options Trading with Lucas Downey
1 × $15.00
Advanced Options Trading with Lucas Downey
1 × $15.00 -
×
 Bodhi, Lighthouse, Truckin by Brian James Sklenka
1 × $6.00
Bodhi, Lighthouse, Truckin by Brian James Sklenka
1 × $6.00 -
×
 Drewize Banks Course
1 × $5.00
Drewize Banks Course
1 × $5.00 -
×
 Seasonality. Systems, Strategies & Signals
1 × $6.00
Seasonality. Systems, Strategies & Signals
1 × $6.00 -
×
 Options Trading & Ultimate MasterClass With Tyrone Abela - FX Evolution
1 × $54.00
Options Trading & Ultimate MasterClass With Tyrone Abela - FX Evolution
1 × $54.00 -
×
 Guide To Selling High Probability Spreads Class with Don Kaufman
1 × $6.00
Guide To Selling High Probability Spreads Class with Don Kaufman
1 × $6.00 -
×
 Flipping Cash Rockstar with Lucas Adamski
1 × $6.00
Flipping Cash Rockstar with Lucas Adamski
1 × $6.00 -
×
 Full Members Area (Icludes 2006 Seminar & Webinars) with Tom Yeomans
1 × $6.00
Full Members Area (Icludes 2006 Seminar & Webinars) with Tom Yeomans
1 × $6.00 -
×
 FX Funding Mate Course
1 × $5.00
FX Funding Mate Course
1 × $5.00 -
×
 Secret Weapon to Trading Options on ETF's Class with Don Kaufman
1 × $6.00
Secret Weapon to Trading Options on ETF's Class with Don Kaufman
1 × $6.00 -
×
 Options For Gold, Oil and Other Commodities
1 × $6.00
Options For Gold, Oil and Other Commodities
1 × $6.00 -
×
 Profit Freedom Blueprint with High Performance Trading
1 × $5.00
Profit Freedom Blueprint with High Performance Trading
1 × $5.00 -
×
 Equity Valuation for Analysts and Investors: A Unique Stock Valuation Tool for Financial Statement Analysis and Model-Building with James Kelleher
1 × $6.00
Equity Valuation for Analysts and Investors: A Unique Stock Valuation Tool for Financial Statement Analysis and Model-Building with James Kelleher
1 × $6.00 -
×
 3 Technical Indicators to Help You Ride the Elliott Wave Trend with Chris Carolan
1 × $6.00
3 Technical Indicators to Help You Ride the Elliott Wave Trend with Chris Carolan
1 × $6.00 -
×
 High Probability Patterns and Rule Based Trading with Jake Bernstein
1 × $6.00
High Probability Patterns and Rule Based Trading with Jake Bernstein
1 × $6.00 -
×
 Part I Basic and Part II Beyond the Basic with Strategic Trading
1 × $6.00
Part I Basic and Part II Beyond the Basic with Strategic Trading
1 × $6.00 -
×
 Day Trading Futures, Stocks, and Crypto
1 × $5.00
Day Trading Futures, Stocks, and Crypto
1 × $5.00 -
×
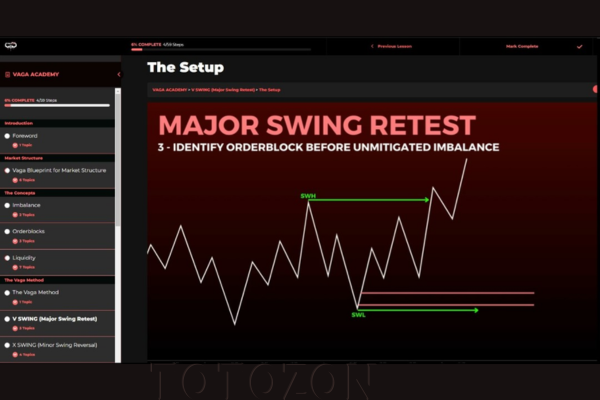 Vaga Academy with VAGAFX
1 × $5.00
Vaga Academy with VAGAFX
1 × $5.00 -
×
 Profit Before Work System with John Piper
1 × $6.00
Profit Before Work System with John Piper
1 × $6.00 -
×
 Options Education FULL Course 30+ Hours with Macrohedged
1 × $23.00
Options Education FULL Course 30+ Hours with Macrohedged
1 × $23.00 -
×
 Charting the Major Forex Pairs: Focus on Major Currencies with James Bickford
1 × $6.00
Charting the Major Forex Pairs: Focus on Major Currencies with James Bickford
1 × $6.00 -
×
 Super Conference 2020 - Premier Coaching Package with Vince Vora
1 × $109.00
Super Conference 2020 - Premier Coaching Package with Vince Vora
1 × $109.00 -
×
 Attracting Abundance with EFT by Carol Look
1 × $6.00
Attracting Abundance with EFT by Carol Look
1 × $6.00 -
×
 Jim Rickards Intelligence Triggers with Agora Financial
1 × $5.00
Jim Rickards Intelligence Triggers with Agora Financial
1 × $5.00 -
×
 Beat The Market Maker
1 × $62.00
Beat The Market Maker
1 × $62.00 -
×
 Lessons From A Trader’s Camp. Winning Psychology & Tactics with Alexander Elder
1 × $6.00
Lessons From A Trader’s Camp. Winning Psychology & Tactics with Alexander Elder
1 × $6.00 -
×
 Trading Volatility - The Ultimate Course with Master Trader
1 × $69.00
Trading Volatility - The Ultimate Course with Master Trader
1 × $69.00 -
×
 Trading to Win (Seminar WorkBook 2003) with Bruce Gilmore
1 × $6.00
Trading to Win (Seminar WorkBook 2003) with Bruce Gilmore
1 × $6.00 -
×
 The Banks Code with Smart Money Trader
1 × $34.00
The Banks Code with Smart Money Trader
1 × $34.00 -
×
 Commodity Futures Traders Club (CTCN) Issues 01 – 77
1 × $6.00
Commodity Futures Traders Club (CTCN) Issues 01 – 77
1 × $6.00 -
×
 Mastering Metatrader 4 in 90 Minutes & Members Site with Alan Benefield
1 × $15.00
Mastering Metatrader 4 in 90 Minutes & Members Site with Alan Benefield
1 × $15.00 -
×
 Money & European Union with Stephen Frank Overturf
1 × $6.00
Money & European Union with Stephen Frank Overturf
1 × $6.00 -
×
 Interactive Course
1 × $6.00
Interactive Course
1 × $6.00 -
×
 Ezaih Academy 2024 Mentorship with Ezaih
1 × $54.00
Ezaih Academy 2024 Mentorship with Ezaih
1 × $54.00 -
×
 Stock Trading Course Level 2 Market Snapper™ 2019 with Piranha Profits
1 × $6.00
Stock Trading Course Level 2 Market Snapper™ 2019 with Piranha Profits
1 × $6.00 -
×
 News FX Strategy with Zain Agha
1 × $6.00
News FX Strategy with Zain Agha
1 × $6.00 -
×
 Price Action Trader Training
1 × $6.00
Price Action Trader Training
1 × $6.00 -
×
 Market Stalkers Level 3 - Intraday Trading University
1 × $8.00
Market Stalkers Level 3 - Intraday Trading University
1 × $8.00 -
×
 Trendline Mastery Video Course with Frank Paul & Peter Bain
1 × $6.00
Trendline Mastery Video Course with Frank Paul & Peter Bain
1 × $6.00 -
×
 Trading Decoded with Axia Futures
1 × $31.00
Trading Decoded with Axia Futures
1 × $31.00 -
×
 Inside the Minds Leading Wall Street Investors with Aspatore Books
1 × $6.00
Inside the Minds Leading Wall Street Investors with Aspatore Books
1 × $6.00 -
×
 ABCs of Trading and Tech Analysis (Online Investor Expo, Las Vegas 2000) with Tom Bierovic
1 × $6.00
ABCs of Trading and Tech Analysis (Online Investor Expo, Las Vegas 2000) with Tom Bierovic
1 × $6.00 -
×
 Opening Price Principle: Best Kept Secret on Wall Street - Larry Pesavento & Peggy MacKay
1 × $6.00
Opening Price Principle: Best Kept Secret on Wall Street - Larry Pesavento & Peggy MacKay
1 × $6.00 -
×
 Virtual Intensive Trader Training
1 × $31.00
Virtual Intensive Trader Training
1 × $31.00 -
×
 LT Pulse and LT Trend/Ultra
1 × $23.00
LT Pulse and LT Trend/Ultra
1 × $23.00 -
×
 OilTradingAcademy - Oil Trading Academy Code 1 + 2 + 3 Video Course
1 × $6.00
OilTradingAcademy - Oil Trading Academy Code 1 + 2 + 3 Video Course
1 × $6.00 -
×
 WD Gann’s Master Time Factor DVD With Miles Wilson Walker
1 × $6.00
WD Gann’s Master Time Factor DVD With Miles Wilson Walker
1 × $6.00 -
×
 Commodities for Dummies with Amine Bouchentouf
1 × $6.00
Commodities for Dummies with Amine Bouchentouf
1 × $6.00 -
×
 Restore & Enhance Your Biofield (Advanced) by Spirituality Zone
1 × $15.40
Restore & Enhance Your Biofield (Advanced) by Spirituality Zone
1 × $15.40 -
×
 How to Use Gann Techniques to Implement a Trading System
1 × $6.00
How to Use Gann Techniques to Implement a Trading System
1 × $6.00 -
×
 Dynamic Trader 6 Dynamic Trader Real Time and End Of Day
1 × $6.00
Dynamic Trader 6 Dynamic Trader Real Time and End Of Day
1 × $6.00 -
×
 Professional Sniper FX
1 × $6.00
Professional Sniper FX
1 × $6.00 -
×
 The Vital Few vs. the Trivial Many: Invest with the Insiders, Not the Masses with George Muzea
1 × $6.00
The Vital Few vs. the Trivial Many: Invest with the Insiders, Not the Masses with George Muzea
1 × $6.00 -
×
 The TC2000 Masterclass Course with Sasha Evdakov - Rise2learn
1 × $23.00
The TC2000 Masterclass Course with Sasha Evdakov - Rise2learn
1 × $23.00 -
×
 Trading The Hobbs Triple Crown Strategy with Derrik Hobbs
1 × $6.00
Trading The Hobbs Triple Crown Strategy with Derrik Hobbs
1 × $6.00 -
×
 The Day Trader: From the Pit to the PC with Lewis Borsellino
1 × $6.00
The Day Trader: From the Pit to the PC with Lewis Borsellino
1 × $6.00 -
×
 Crash or Correction - Top 5 Patterns Every Trader Must Master with Todd Gordon
1 × $6.00
Crash or Correction - Top 5 Patterns Every Trader Must Master with Todd Gordon
1 × $6.00 -
×
 Wyckoff simplified from Michael Z
1 × $6.00
Wyckoff simplified from Michael Z
1 × $6.00 -
×
 How to Collect Income Being Short with Don Kaufman
1 × $6.00
How to Collect Income Being Short with Don Kaufman
1 × $6.00 -
×
 Electronic Trading "TNT" I Gorilla Trading Stuff with Joe Ross & Mark Cherlin
1 × $6.00
Electronic Trading "TNT" I Gorilla Trading Stuff with Joe Ross & Mark Cherlin
1 × $6.00 -
×
 W. D Gann 's Square Of 9 Applied To Modern Markets with Sean Avidar - Hexatrade350
1 × $23.00
W. D Gann 's Square Of 9 Applied To Modern Markets with Sean Avidar - Hexatrade350
1 × $23.00 -
×
 ShredderFX Compete Courses & Indicators
1 × $6.00
ShredderFX Compete Courses & Indicators
1 × $6.00 -
×
 Rob’s 6 Day 21 Set-up Course with Rob Hoffman
1 × $85.00
Rob’s 6 Day 21 Set-up Course with Rob Hoffman
1 × $85.00 -
×
 In Jeremy's Stock Market Brain
1 × $62.00
In Jeremy's Stock Market Brain
1 × $62.00 -
×
 Price action profits formula v2
1 × $31.00
Price action profits formula v2
1 × $31.00 -
×
 Interpreting Balance of Power with Peter Worden
1 × $6.00
Interpreting Balance of Power with Peter Worden
1 × $6.00 -
×
 The Orderflows Trade Opportunities Encyclopedia with Michael Valtos
1 × $8.00
The Orderflows Trade Opportunities Encyclopedia with Michael Valtos
1 × $8.00 -
×
 Trading Masterclass POTM + PFTM + PTMI with Anton Kreil
1 × $6.00
Trading Masterclass POTM + PFTM + PTMI with Anton Kreil
1 × $6.00 -
×
 6 Dynamic Trader Real Time and End Of Day
1 × $39.00
6 Dynamic Trader Real Time and End Of Day
1 × $39.00 -
×
 Perfect Publishing System Elite with Johnny Andrews
1 × $6.00
Perfect Publishing System Elite with Johnny Andrews
1 × $6.00 -
×
 The TrendAdvisor Guide to Breakthrough Profits with Chuck Dukas
1 × $6.00
The TrendAdvisor Guide to Breakthrough Profits with Chuck Dukas
1 × $6.00 -
×
 Hedge Fund Investment Management with Izze Nelken
1 × $6.00
Hedge Fund Investment Management with Izze Nelken
1 × $6.00 -
×
 Consistent Small Account Growth Formula with Matt Williamson
1 × $6.00
Consistent Small Account Growth Formula with Matt Williamson
1 × $6.00 -
×
 A Mathematician Plays The Stock Market with John Allen Paulos
1 × $6.00
A Mathematician Plays The Stock Market with John Allen Paulos
1 × $6.00 -
×
 Applied Quantitative Methods for Trading and Investment with Christian Dunis, Jason Laws & Patrick Na¿m
1 × $6.00
Applied Quantitative Methods for Trading and Investment with Christian Dunis, Jason Laws & Patrick Na¿m
1 × $6.00 -
×
 The Handbook of Technical Analysis: A Comprehensive Guide to Analytical Methods, Trading Systems and Technical Indicators with Darrell R. Jobman
1 × $6.00
The Handbook of Technical Analysis: A Comprehensive Guide to Analytical Methods, Trading Systems and Technical Indicators with Darrell R. Jobman
1 × $6.00 -
×
 Wyckoff Analytics Courses Collection
1 × $27.00
Wyckoff Analytics Courses Collection
1 × $27.00 -
×
 Forex Eye
1 × $5.00
Forex Eye
1 × $5.00 -
×
 Complete Day Trading Course with The Trading Floor
1 × $13.00
Complete Day Trading Course with The Trading Floor
1 × $13.00 -
×
 Ahead of the Curve with Joseph Ellis
1 × $6.00
Ahead of the Curve with Joseph Ellis
1 × $6.00 -
×
 Does a Holy Grail Really Exist with John Hayden
1 × $6.00
Does a Holy Grail Really Exist with John Hayden
1 × $6.00 -
×
 Triple Squeeze Indicator TOS
1 × $6.00
Triple Squeeze Indicator TOS
1 × $6.00 -
×
 Directional Calendars in 2023 with Dan Sheridan & Mark Fenton - Sheridan Options Mentoring
1 × $85.00
Directional Calendars in 2023 with Dan Sheridan & Mark Fenton - Sheridan Options Mentoring
1 × $85.00 -
×
 Avoiding Trading Mistakes with Mark D.Cook
1 × $6.00
Avoiding Trading Mistakes with Mark D.Cook
1 × $6.00 -
×
 Day Trading Smart Right From the Start: Trading Essentials for Maximum Results - David Nassar & John Boyer
1 × $6.00
Day Trading Smart Right From the Start: Trading Essentials for Maximum Results - David Nassar & John Boyer
1 × $6.00 -
×
 Adz Trading Academy
1 × $5.00
Adz Trading Academy
1 × $5.00 -
×
 Trade Hot IPOs-The Promise Of The Future (IPO Course) with Dave Landry
1 × $78.00
Trade Hot IPOs-The Promise Of The Future (IPO Course) with Dave Landry
1 × $78.00 -
×
 Advanced Nasdaq Trading Techniques with Alan Rich
1 × $6.00
Advanced Nasdaq Trading Techniques with Alan Rich
1 × $6.00 -
×
 Intro to Fibonacci Trading with Neal Hughes
1 × $6.00
Intro to Fibonacci Trading with Neal Hughes
1 × $6.00 -
×
 QuickBooks 2003 Official Guide
1 × $6.00
QuickBooks 2003 Official Guide
1 × $6.00 -
×
 Investing with LEAPS. What You Should Know About Long Term Investing with James Bittman
1 × $6.00
Investing with LEAPS. What You Should Know About Long Term Investing with James Bittman
1 × $6.00 -
×
 The Options Course Workbook: Step-by-Step Exercises and Tests to Help You Master the Options Course - George Fontanills
1 × $6.00
The Options Course Workbook: Step-by-Step Exercises and Tests to Help You Master the Options Course - George Fontanills
1 × $6.00 -
×
 Electronic Trading "TNT" II How - To Win Trading Stuff with Joe Ross & Mark Cherlin
1 × $6.00
Electronic Trading "TNT" II How - To Win Trading Stuff with Joe Ross & Mark Cherlin
1 × $6.00 -
×
 Forex Profit Multiplier with Bill & Greg Poulos
1 × $6.00
Forex Profit Multiplier with Bill & Greg Poulos
1 × $6.00 -
×
 TradeCraft: Your Path to Peak Performance Trading By Adam Grimes
1 × $15.00
TradeCraft: Your Path to Peak Performance Trading By Adam Grimes
1 × $15.00 -
×
 Full 2 Day Dark Pool And Market Strategy Training
1 × $6.00
Full 2 Day Dark Pool And Market Strategy Training
1 × $6.00
 with Arthur A.Hill")
Introduction to Candlestick (Article) with Arthur A.Hill
$6.00
File Size: Coming soon!
Delivery Time: 1–12 hours
Media Type: Online Course
Content Proof: Watch Here!
You may check content proof of “Introduction to Candlestick (Article) with Arthur A.Hill” below:
 with Arthur A.Hill")
Introduction to Candlestick (Article) with Arthur A. Hill
Candlestick charting is an essential tool for traders and investors, providing a visual representation of price movements. Arthur A. Hill, a renowned expert in technical analysis, offers a comprehensive introduction to candlestick charts, making them accessible to beginners and valuable for experienced traders. Let’s explore the basics of candlestick charting and how it can enhance your trading strategy.
What is a Candlestick Chart?
A candlestick chart is a type of financial chart used to describe price movements of a security, derivative, or currency.
Components of a Candlestick
- Body: The thick part of the candlestick, showing the opening and closing prices.
- Wicks/Shadows: The thin lines above and below the body, indicating the highest and lowest prices during the period.
- Color: Traditionally, a green or white body indicates a closing price higher than the opening price, while a red or black body indicates a closing price lower than the opening price.
History of Candlestick Charting
Candlestick charting originated in Japan over 300 years ago, developed by rice traders to track market prices and daily supply and demand.
Evolution of Candlestick Charts
Over the centuries, candlestick charting has evolved and gained popularity worldwide, becoming a staple in technical analysis.
Introduction to Western Markets
Candlestick charts were introduced to the Western financial markets in the late 20th century and quickly became popular among traders.
Advantages of Candlestick Charts
Candlestick charts offer several advantages over traditional bar charts and line charts.
Visual Clarity
Candlestick charts provide a clear and concise representation of price movements, making it easier to interpret market trends.
Immediate Insight
The color-coded bodies and wicks offer immediate insight into market sentiment and price direction.
Pattern Recognition
Candlestick charts are excellent for identifying patterns that can predict future price movements.
Common Candlestick Patterns
- Doji: Indicates indecision in the market.
- Hammer: Suggests a potential reversal from a downtrend.
- Engulfing: A strong signal of a potential trend reversal.
Basic Candlestick Patterns
Understanding basic candlestick patterns is crucial for any trader looking to use this charting method effectively.
Bullish Patterns
Bullish patterns indicate potential upward price movements.
Hammer and Inverted Hammer
- Hammer: A candlestick with a small body and a long lower wick, indicating potential reversal from a downtrend.
- Inverted Hammer: Similar to the hammer but with a long upper wick, suggesting a potential bullish reversal.
Bearish Patterns
Bearish patterns suggest potential downward price movements.
Shooting Star and Hanging Man
- Shooting Star: A candlestick with a small body and a long upper wick, indicating a potential reversal from an uptrend.
- Hanging Man: Similar to the hammer but occurs after an uptrend, signaling a potential bearish reversal.
Advanced Candlestick Patterns
For more experienced traders, advanced candlestick patterns provide deeper insights into market trends.
Engulfing Patterns
Engulfing patterns occur when a smaller candlestick is followed by a larger candlestick that completely engulfs the smaller one.
Bullish Engulfing
A bullish engulfing pattern occurs at the bottom of a downtrend and signals a potential upward reversal.
Bearish Engulfing
A bearish engulfing pattern appears at the top of an uptrend and suggests a potential downward reversal.
Morning Star and Evening Star
These patterns are three-candlestick formations that indicate strong trend reversals.
Morning Star
The morning star pattern consists of a bearish candle, a small indecisive candle, and a bullish candle, indicating a bullish reversal.
Evening Star
The evening star pattern includes a bullish candle, a small indecisive candle, and a bearish candle, suggesting a bearish reversal.
Incorporating Candlestick Charts into Your Trading Strategy
Candlestick charts are versatile and can be integrated into various trading strategies.
Combining with Other Indicators
Enhance the effectiveness of candlestick charts by combining them with other technical indicators.
Popular Indicators to Combine
- Moving Averages: Confirm trends and potential reversals.
- Relative Strength Index (RSI): Identify overbought or oversold conditions.
- Bollinger Bands: Measure market volatility and potential breakouts.
Setting Up Your Trading Platform
Most trading platforms offer candlestick charting options. Ensure you customize your charts to suit your trading style.
Customization Tips
- Time Frames: Choose appropriate time frames for your trading strategy.
- Color Schemes: Use distinct colors for bullish and bearish candles.
- Indicators: Add complementary indicators to your charts.
Common Mistakes to Avoid
Even with a robust understanding of candlestick charts, traders can make mistakes that affect their performance.
Over-reliance on Patterns
Relying solely on candlestick patterns without considering other factors can lead to false signals.
Diversify Analysis
Always use candlestick patterns in conjunction with other forms of analysis and market indicators.
Ignoring Market Context
Candlestick patterns can be misleading if not considered within the broader market context.
Comprehensive Analysis
Incorporate fundamental analysis and overall market trends to validate candlestick signals.
Conclusion
Candlestick charting, as introduced by Arthur A. Hill, offers a powerful tool for traders to understand and predict market movements. By mastering basic and advanced patterns, combining them with other technical indicators, and avoiding common pitfalls, traders can enhance their market analysis and trading performance. Whether you’re new to trading or an experienced trader, candlestick charts provide valuable insights that can guide your investment decisions.
Frequently Asked Questions:
- What is a candlestick chart?
A candlestick chart is a type of financial chart used to represent price movements over a specific period, showing the opening, closing, high, and low prices. - Why are candlestick charts popular among traders?
They provide visual clarity and help in identifying patterns that can predict future price movements. - What are some basic candlestick patterns?
Basic patterns include the hammer, inverted hammer, shooting star, and hanging man, which indicate potential market reversals. - Can candlestick charts be used with other technical indicators?
Yes, combining candlestick charts with indicators like moving averages, RSI, and Bollinger Bands enhances their effectiveness. - How can I avoid common mistakes when using candlestick charts?
Avoid over-relying on patterns and always consider the broader market context and other forms of analysis.
Be the first to review “Introduction to Candlestick (Article) with Arthur A.Hill”
You must be logged in to post a review.
Related products

Forex Trading
Original price was: $249.00.$15.00Current price is: $15.00.

Forex Trading
Original price was: $239.00.$8.00Current price is: $8.00.

Forex Trading
Original price was: $797.00.$10.00Current price is: $10.00.

Forex Trading
The Complete Guide to Multiple Time Frame Analysis & Reading Price Action with Aiman Almansoori
Original price was: $1,399.00.$13.00Current price is: $13.00.

Forex Trading
Original price was: $999.00.$15.00Current price is: $15.00.

Original price was: $2,120.00.$15.00Current price is: $15.00.

Forex Trading
Original price was: $500.00.$5.00Current price is: $5.00.
Original price was: $4,995.00.$15.00Current price is: $15.00.

Forex Trading
Original price was: $2,997.00.$23.00Current price is: $23.00.

Original price was: $700.00.$39.00Current price is: $39.00.
Original price was: $497.00.$31.00Current price is: $31.00.

Original price was: $895.00.$15.00Current price is: $15.00.

Forex Trading
Original price was: $397.00.$31.00Current price is: $31.00.

Forex Trading
Original price was: $1,098.00.$39.00Current price is: $39.00.
Original price was: $1,800.00.$54.00Current price is: $54.00.

Forex Trading
Original price was: $850.00.$23.00Current price is: $23.00.

Forex Trading
Original price was: $550.00.$5.00Current price is: $5.00.

Original price was: $197.00.$5.00Current price is: $5.00.
Original price was: $299.00.$8.00Current price is: $8.00.

Original price was: $1,849.00.$15.00Current price is: $15.00.

Reviews
There are no reviews yet.