-
×
 Traders Secret Library
1 × $6.00
Traders Secret Library
1 × $6.00 -
×
 OFA - Intensive Boot Camp 5 Day Course
1 × $6.00
OFA - Intensive Boot Camp 5 Day Course
1 × $6.00 -
×
 Algohub 2023 Full Completed with Algohub
1 × $5.00
Algohub 2023 Full Completed with Algohub
1 × $5.00 -
×
 More on the Short Cycles of Interest Rates (Article) with Arie Melnik, Alan Kraus
1 × $6.00
More on the Short Cycles of Interest Rates (Article) with Arie Melnik, Alan Kraus
1 × $6.00 -
×
 New Market Mavericks with Geoff Cutmore
1 × $6.00
New Market Mavericks with Geoff Cutmore
1 × $6.00 -
×
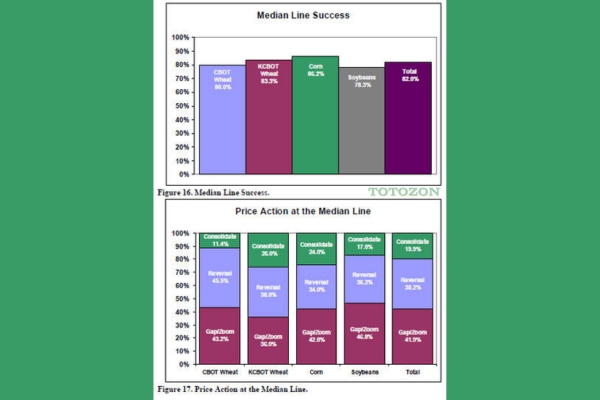 Using Median Lines as a Trading Tool with Greg Fisher
1 × $6.00
Using Median Lines as a Trading Tool with Greg Fisher
1 × $6.00 -
×
 The Trading Blueprint with Brad Goh - The Trading Geek
1 × $5.00
The Trading Blueprint with Brad Goh - The Trading Geek
1 × $5.00 -
×
 The Trader's Mindset Course with Chris Mathews
1 × $6.00
The Trader's Mindset Course with Chris Mathews
1 × $6.00 -
×
 Price Action Trader Training
1 × $6.00
Price Action Trader Training
1 × $6.00 -
×
 Advanced Trading Course with Edney Pinheiro
1 × $5.00
Advanced Trading Course with Edney Pinheiro
1 × $5.00 -
×
 0 DTE Options Trading Workshop with Aeromir Corporation
1 × $15.00
0 DTE Options Trading Workshop with Aeromir Corporation
1 × $15.00 -
×
 Lee Gettess’s Package
1 × $6.00
Lee Gettess’s Package
1 × $6.00 -
×
 Forex Millionaire Course with Willis University
1 × $6.00
Forex Millionaire Course with Willis University
1 × $6.00 -
×
 My Forex League - The Course
1 × $5.00
My Forex League - The Course
1 × $5.00 -
×
 How to Make the Stock Market Make Money For You with Ted Warren
1 × $6.00
How to Make the Stock Market Make Money For You with Ted Warren
1 × $6.00 -
×
 Art & Science of Trend Trading Class with Jeff Bierman
1 × $6.00
Art & Science of Trend Trading Class with Jeff Bierman
1 × $6.00 -
×
 ENG Renko Mastery with International Scalpers
1 × $10.00
ENG Renko Mastery with International Scalpers
1 × $10.00 -
×
 AI For Traders with Trading Markets
1 × $31.00
AI For Traders with Trading Markets
1 × $31.00 -
×
 Forty Cents for Financial Freedom with Darlene Nelson
1 × $6.00
Forty Cents for Financial Freedom with Darlene Nelson
1 × $6.00 -
×
 The Trader’s Book of Volume with Mark Leibovit
1 × $6.00
The Trader’s Book of Volume with Mark Leibovit
1 × $6.00 -
×
 Adx Mastery Complete Course
1 × $6.00
Adx Mastery Complete Course
1 × $6.00 -
×
 Forecast 2024 Clarification with Larry Williams
1 × $15.00
Forecast 2024 Clarification with Larry Williams
1 × $15.00 -
×
 Simpler Options - Double Diagonals Class
1 × $6.00
Simpler Options - Double Diagonals Class
1 × $6.00 -
×
 Quantamentals - The Next Great Forefront Of Trading and Investing with Trading Markets
1 × $8.00
Quantamentals - The Next Great Forefront Of Trading and Investing with Trading Markets
1 × $8.00 -
×
 Profinacci Complete Course with Stephen A.Pierce
1 × $6.00
Profinacci Complete Course with Stephen A.Pierce
1 × $6.00 -
×
 You AreThe Indicator Online Course
1 × $31.00
You AreThe Indicator Online Course
1 × $31.00 -
×
 Neural Networks in Trading with Dr. Ernest P. Chan
1 × $31.00
Neural Networks in Trading with Dr. Ernest P. Chan
1 × $31.00 -
×
 A Complete Guide to Technical Trading Tactics with John Person
1 × $6.00
A Complete Guide to Technical Trading Tactics with John Person
1 × $6.00 -
×
 Elliott Wave Indicator Suite for ThinkorSwim
1 × $15.00
Elliott Wave Indicator Suite for ThinkorSwim
1 × $15.00 -
×
 TradeSafe Mechanical Trading System, Course, and Coaching
1 × $85.00
TradeSafe Mechanical Trading System, Course, and Coaching
1 × $85.00 -
×
 Self-Mastery Course with Steven Cruz
1 × $62.00
Self-Mastery Course with Steven Cruz
1 × $62.00 -
×
 Picking the Best Stocks & Strategies for every Option Trade with James Bittman
1 × $6.00
Picking the Best Stocks & Strategies for every Option Trade with James Bittman
1 × $6.00 -
×
 How To Become StressFree Trader with Jason Starzec
1 × $4.00
How To Become StressFree Trader with Jason Starzec
1 × $4.00 -
×
 The 13-Week Cash Flow Model
1 × $15.00
The 13-Week Cash Flow Model
1 × $15.00 -
×
 System Building Masterclass
1 × $31.00
System Building Masterclass
1 × $31.00 -
×
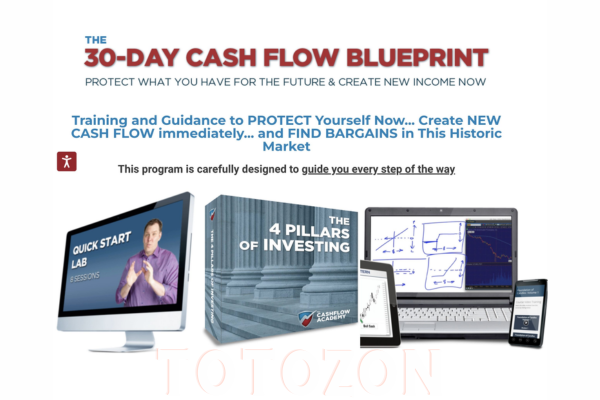 The 30-Day Cash Flow Blueprint with Andy Tanner
1 × $31.00
The 30-Day Cash Flow Blueprint with Andy Tanner
1 × $31.00 -
×
 Forex Trading Education Program (Apr-June 2010) with Jimmy Young
1 × $6.00
Forex Trading Education Program (Apr-June 2010) with Jimmy Young
1 × $6.00 -
×
 Connors on Advanced Trading Strategies with Larry Connors
1 × $6.00
Connors on Advanced Trading Strategies with Larry Connors
1 × $6.00 -
×
 Floor Traders Edge Mentorship Program with Market Geeks
1 × $6.00
Floor Traders Edge Mentorship Program with Market Geeks
1 × $6.00 -
×
 Bond Market Course with The Macro Compass
1 × $15.00
Bond Market Course with The Macro Compass
1 × $15.00 -
×
 Empirical Market Microstructure
1 × $6.00
Empirical Market Microstructure
1 × $6.00 -
×
 SJG Trading - Butterflies Class with Steve Ganz
1 × $31.00
SJG Trading - Butterflies Class with Steve Ganz
1 × $31.00 -
×
 Traders Edge with Steven Dux
1 × $5.00
Traders Edge with Steven Dux
1 × $5.00 -
×
 Prometheus Course with QuantProgram
1 × $13.00
Prometheus Course with QuantProgram
1 × $13.00 -
×
 Advanced Risk Reversals and Rolling Thunder with Stratagem Trade
1 × $54.00
Advanced Risk Reversals and Rolling Thunder with Stratagem Trade
1 × $54.00 -
×
 Pro Indicator Pack with Trade Confident
1 × $15.00
Pro Indicator Pack with Trade Confident
1 × $15.00 -
×
 PFAZoneSuite [Trading Indicator] 2017
1 × $109.00
PFAZoneSuite [Trading Indicator] 2017
1 × $109.00 -
×
 Protecting your Retirement Account in a Correction with Dan Sheridan - Sheridan Options Mentoring
1 × $31.00
Protecting your Retirement Account in a Correction with Dan Sheridan - Sheridan Options Mentoring
1 × $31.00 -
×
 Stock Investing Strategies with Maria Crawford Scott, John Bajkowski
1 × $6.00
Stock Investing Strategies with Maria Crawford Scott, John Bajkowski
1 × $6.00 -
×
 Forex Trader Package 2010
1 × $15.00
Forex Trader Package 2010
1 × $15.00 -
×
 E-Bonds: An Introduction to the Online Bond Market with Jake Wengroff
1 × $6.00
E-Bonds: An Introduction to the Online Bond Market with Jake Wengroff
1 × $6.00 -
×
 7 Commandments of Stock Investing with Gene Marcial
1 × $6.00
7 Commandments of Stock Investing with Gene Marcial
1 × $6.00 -
×
 Emini Volume Break Out System
1 × $6.00
Emini Volume Break Out System
1 × $6.00 -
×
 Trading a Living Thing (Article) with David Bowden
1 × $6.00
Trading a Living Thing (Article) with David Bowden
1 × $6.00 -
×
 Activedaytrader - Elite Earnings Pusuit
1 × $54.00
Activedaytrader - Elite Earnings Pusuit
1 × $54.00 -
×
 TRADING NFX Course with Andrew NFX
1 × $5.00
TRADING NFX Course with Andrew NFX
1 × $5.00
 with Arthur A.Hill")
Introduction to Candlestick (Article) with Arthur A.Hill
$6.00
File Size: Coming soon!
Delivery Time: 1–12 hours
Media Type: Online Course
Content Proof: Watch Here!
You may check content proof of “Introduction to Candlestick (Article) with Arthur A.Hill” below:
 with Arthur A.Hill")
Introduction to Candlestick (Article) with Arthur A. Hill
Candlestick charting is an essential tool for traders and investors, providing a visual representation of price movements. Arthur A. Hill, a renowned expert in technical analysis, offers a comprehensive introduction to candlestick charts, making them accessible to beginners and valuable for experienced traders. Let’s explore the basics of candlestick charting and how it can enhance your trading strategy.
What is a Candlestick Chart?
A candlestick chart is a type of financial chart used to describe price movements of a security, derivative, or currency.
Components of a Candlestick
- Body: The thick part of the candlestick, showing the opening and closing prices.
- Wicks/Shadows: The thin lines above and below the body, indicating the highest and lowest prices during the period.
- Color: Traditionally, a green or white body indicates a closing price higher than the opening price, while a red or black body indicates a closing price lower than the opening price.
History of Candlestick Charting
Candlestick charting originated in Japan over 300 years ago, developed by rice traders to track market prices and daily supply and demand.
Evolution of Candlestick Charts
Over the centuries, candlestick charting has evolved and gained popularity worldwide, becoming a staple in technical analysis.
Introduction to Western Markets
Candlestick charts were introduced to the Western financial markets in the late 20th century and quickly became popular among traders.
Advantages of Candlestick Charts
Candlestick charts offer several advantages over traditional bar charts and line charts.
Visual Clarity
Candlestick charts provide a clear and concise representation of price movements, making it easier to interpret market trends.
Immediate Insight
The color-coded bodies and wicks offer immediate insight into market sentiment and price direction.
Pattern Recognition
Candlestick charts are excellent for identifying patterns that can predict future price movements.
Common Candlestick Patterns
- Doji: Indicates indecision in the market.
- Hammer: Suggests a potential reversal from a downtrend.
- Engulfing: A strong signal of a potential trend reversal.
Basic Candlestick Patterns
Understanding basic candlestick patterns is crucial for any trader looking to use this charting method effectively.
Bullish Patterns
Bullish patterns indicate potential upward price movements.
Hammer and Inverted Hammer
- Hammer: A candlestick with a small body and a long lower wick, indicating potential reversal from a downtrend.
- Inverted Hammer: Similar to the hammer but with a long upper wick, suggesting a potential bullish reversal.
Bearish Patterns
Bearish patterns suggest potential downward price movements.
Shooting Star and Hanging Man
- Shooting Star: A candlestick with a small body and a long upper wick, indicating a potential reversal from an uptrend.
- Hanging Man: Similar to the hammer but occurs after an uptrend, signaling a potential bearish reversal.
Advanced Candlestick Patterns
For more experienced traders, advanced candlestick patterns provide deeper insights into market trends.
Engulfing Patterns
Engulfing patterns occur when a smaller candlestick is followed by a larger candlestick that completely engulfs the smaller one.
Bullish Engulfing
A bullish engulfing pattern occurs at the bottom of a downtrend and signals a potential upward reversal.
Bearish Engulfing
A bearish engulfing pattern appears at the top of an uptrend and suggests a potential downward reversal.
Morning Star and Evening Star
These patterns are three-candlestick formations that indicate strong trend reversals.
Morning Star
The morning star pattern consists of a bearish candle, a small indecisive candle, and a bullish candle, indicating a bullish reversal.
Evening Star
The evening star pattern includes a bullish candle, a small indecisive candle, and a bearish candle, suggesting a bearish reversal.
Incorporating Candlestick Charts into Your Trading Strategy
Candlestick charts are versatile and can be integrated into various trading strategies.
Combining with Other Indicators
Enhance the effectiveness of candlestick charts by combining them with other technical indicators.
Popular Indicators to Combine
- Moving Averages: Confirm trends and potential reversals.
- Relative Strength Index (RSI): Identify overbought or oversold conditions.
- Bollinger Bands: Measure market volatility and potential breakouts.
Setting Up Your Trading Platform
Most trading platforms offer candlestick charting options. Ensure you customize your charts to suit your trading style.
Customization Tips
- Time Frames: Choose appropriate time frames for your trading strategy.
- Color Schemes: Use distinct colors for bullish and bearish candles.
- Indicators: Add complementary indicators to your charts.
Common Mistakes to Avoid
Even with a robust understanding of candlestick charts, traders can make mistakes that affect their performance.
Over-reliance on Patterns
Relying solely on candlestick patterns without considering other factors can lead to false signals.
Diversify Analysis
Always use candlestick patterns in conjunction with other forms of analysis and market indicators.
Ignoring Market Context
Candlestick patterns can be misleading if not considered within the broader market context.
Comprehensive Analysis
Incorporate fundamental analysis and overall market trends to validate candlestick signals.
Conclusion
Candlestick charting, as introduced by Arthur A. Hill, offers a powerful tool for traders to understand and predict market movements. By mastering basic and advanced patterns, combining them with other technical indicators, and avoiding common pitfalls, traders can enhance their market analysis and trading performance. Whether you’re new to trading or an experienced trader, candlestick charts provide valuable insights that can guide your investment decisions.
Frequently Asked Questions:
- What is a candlestick chart?
A candlestick chart is a type of financial chart used to represent price movements over a specific period, showing the opening, closing, high, and low prices. - Why are candlestick charts popular among traders?
They provide visual clarity and help in identifying patterns that can predict future price movements. - What are some basic candlestick patterns?
Basic patterns include the hammer, inverted hammer, shooting star, and hanging man, which indicate potential market reversals. - Can candlestick charts be used with other technical indicators?
Yes, combining candlestick charts with indicators like moving averages, RSI, and Bollinger Bands enhances their effectiveness. - How can I avoid common mistakes when using candlestick charts?
Avoid over-relying on patterns and always consider the broader market context and other forms of analysis.
Be the first to review “Introduction to Candlestick (Article) with Arthur A.Hill”
You must be logged in to post a review.
Related products

Forex Trading
Original price was: $125.00.$17.00Current price is: $17.00.

Original price was: $139.00.$23.00Current price is: $23.00.

Original price was: $1,800.00.$54.00Current price is: $54.00.

Original price was: $999.00.$5.00Current price is: $5.00.

Original price was: $1,849.00.$15.00Current price is: $15.00.
Forex Trading
Original price was: $1,898.00.$10.00Current price is: $10.00.

Original price was: $2,120.00.$15.00Current price is: $15.00.

Original price was: $799.00.$15.00Current price is: $15.00.

Original price was: $895.00.$15.00Current price is: $15.00.

Original price was: $497.00.$31.00Current price is: $31.00.

Original price was: $497.00.$11.00Current price is: $11.00.

Forex Trading
Original price was: $797.00.$10.00Current price is: $10.00.

Original price was: $997.00.$13.00Current price is: $13.00.

Original price was: $997.00.$8.00Current price is: $8.00.

Original price was: $310.00.$23.00Current price is: $23.00.

Forex Trading
Original price was: $4,997.00.$27.00Current price is: $27.00.
Forex Trading
Original price was: $249.00.$15.00Current price is: $15.00.
Forex Trading
Original price was: $697.00.$5.00Current price is: $5.00.

Forex Trading
Original price was: $550.00.$5.00Current price is: $5.00.

Forex Trading
Original price was: $799.00.$15.00Current price is: $15.00.

Reviews
There are no reviews yet.