-
×
 Trading 3SMA System with Hector DeVille
1 × $6.00
Trading 3SMA System with Hector DeVille
1 × $6.00 -
×
 Jeffrey Kennedy’s Package ( Discount 25% )
1 × $31.00
Jeffrey Kennedy’s Package ( Discount 25% )
1 × $31.00 -
×
 Increase Your Net Worth In 2 Hours A Week with Jerremy Newsome - Real Life Trading
1 × $17.00
Increase Your Net Worth In 2 Hours A Week with Jerremy Newsome - Real Life Trading
1 × $17.00 -
×
 Managing Your Goals with Alec MacKenzie
1 × $6.00
Managing Your Goals with Alec MacKenzie
1 × $6.00 -
×
 Stock Option Trading 3 – Easy Advanced Profits and Success with Scott Paton
1 × $6.00
Stock Option Trading 3 – Easy Advanced Profits and Success with Scott Paton
1 × $6.00 -
×
 Forex Robotron (Unlocked)
1 × $6.00
Forex Robotron (Unlocked)
1 × $6.00 -
×
 AutoTrader-Fully Automated Trading System with Trading123
1 × $46.00
AutoTrader-Fully Automated Trading System with Trading123
1 × $46.00 -
×
 Pocketing Premium Master Class (Basic) with Henrry Gambell
1 × $31.00
Pocketing Premium Master Class (Basic) with Henrry Gambell
1 × $31.00 -
×
 The GBP USD Trading System with A.Heuscher
1 × $6.00
The GBP USD Trading System with A.Heuscher
1 × $6.00 -
×
 Fx Engine Trading Course with Adeh Mirzakhani
1 × $6.00
Fx Engine Trading Course with Adeh Mirzakhani
1 × $6.00 -
×
 Commodity Options: Trading and Hedging Volatility in the World’s Most Lucrative Market with Carley Garner & Paul Brittain
1 × $6.00
Commodity Options: Trading and Hedging Volatility in the World’s Most Lucrative Market with Carley Garner & Paul Brittain
1 × $6.00 -
×
 Advanced Trading Strategies
1 × $31.00
Advanced Trading Strategies
1 × $31.00 -
×
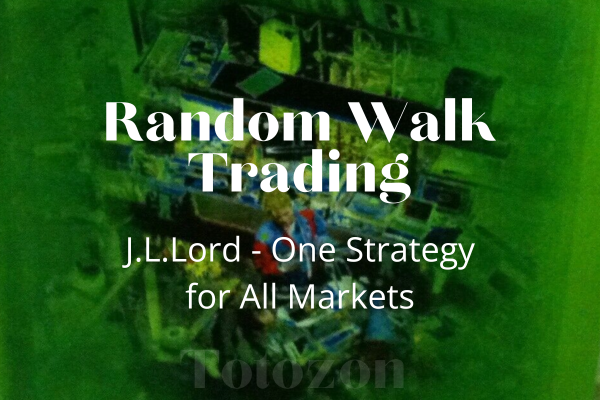 Random Walk Trading - J.L.Lord - One Strategy for All Markets
1 × $6.00
Random Walk Trading - J.L.Lord - One Strategy for All Markets
1 × $6.00 -
×
 Computerized Trading with Mark Jurik
1 × $6.00
Computerized Trading with Mark Jurik
1 × $6.00 -
×
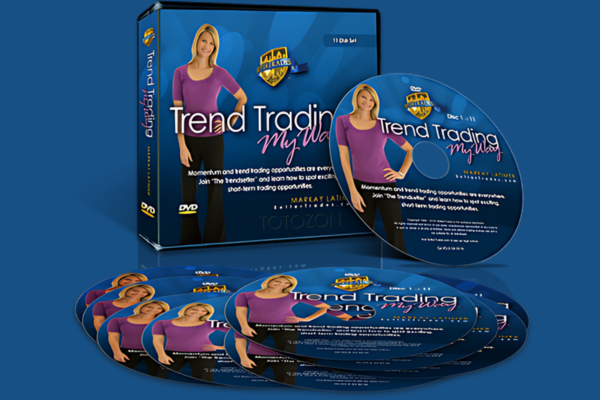 Trend Trading My Way with Markay Latimer
1 × $15.00
Trend Trading My Way with Markay Latimer
1 × $15.00 -
×
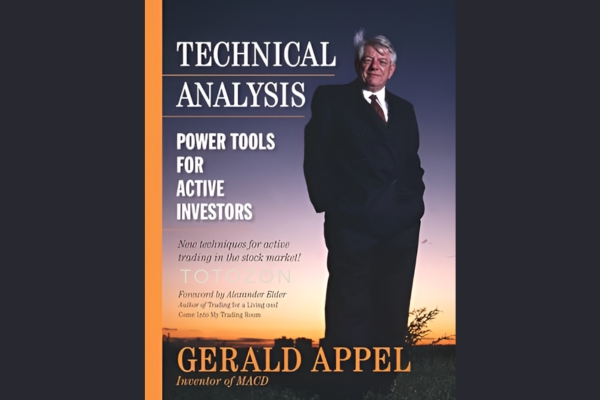 Technical Analysis: Power Tools for Active Investors with Gerald Appel
1 × $6.00
Technical Analysis: Power Tools for Active Investors with Gerald Appel
1 × $6.00 -
×
 A-Z Course with InvestiTrade Academy
1 × $5.00
A-Z Course with InvestiTrade Academy
1 × $5.00 -
×
 Using Median Lines as a Trading Tool with Greg Fisher
1 × $6.00
Using Median Lines as a Trading Tool with Greg Fisher
1 × $6.00 -
×
 A- Z Educational Trading Course with InvestiTrade
1 × $39.00
A- Z Educational Trading Course with InvestiTrade
1 × $39.00 -
×
 Opening Bell Income Strategy with Todd Mitchell
1 × $54.00
Opening Bell Income Strategy with Todd Mitchell
1 × $54.00 -
×
 Chart Analysis Boot Camp Course Webinar with Mike Albright
1 × $6.00
Chart Analysis Boot Camp Course Webinar with Mike Albright
1 × $6.00 -
×
 Module IV - Day Trading to Short Term Swing Trades with FX MindShift
1 × $6.00
Module IV - Day Trading to Short Term Swing Trades with FX MindShift
1 × $6.00 -
×
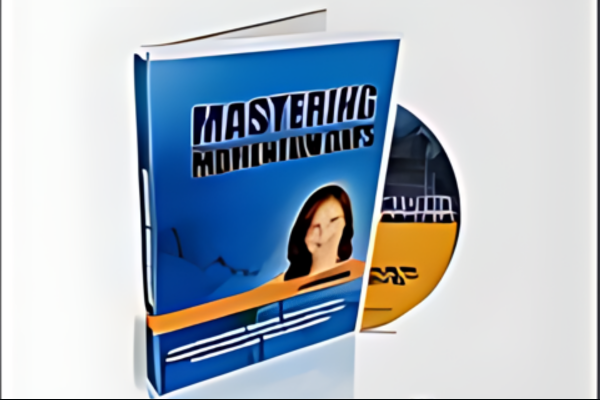 Mastering Momentum Gaps with Toni Hansen
1 × $6.00
Mastering Momentum Gaps with Toni Hansen
1 × $6.00 -
×
 Cyber Trading University - Power Trading 7 CD
1 × $8.00
Cyber Trading University - Power Trading 7 CD
1 × $8.00 -
×
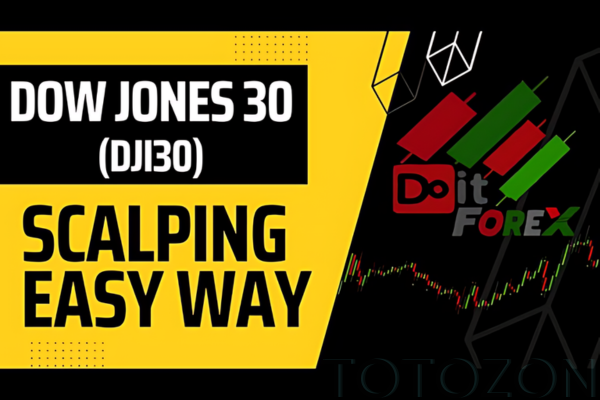 Scalping Dow Jones 30 (DJI30) course - Live Trading Sessions with ISSAC Asimov
1 × $5.00
Scalping Dow Jones 30 (DJI30) course - Live Trading Sessions with ISSAC Asimov
1 × $5.00 -
×
 Mind & Markets. An Advanced Study Course of Stock Market Education (1951) with Bert Larson
1 × $6.00
Mind & Markets. An Advanced Study Course of Stock Market Education (1951) with Bert Larson
1 × $6.00 -
×
 Crypto Trading Cyber Security for Bitcoin & Altcoin Holders with Zlatin Georgiev
1 × $5.00
Crypto Trading Cyber Security for Bitcoin & Altcoin Holders with Zlatin Georgiev
1 × $5.00 -
×
 Advanced Trading Strategies with Larry Connors
1 × $6.00
Advanced Trading Strategies with Larry Connors
1 × $6.00 -
×
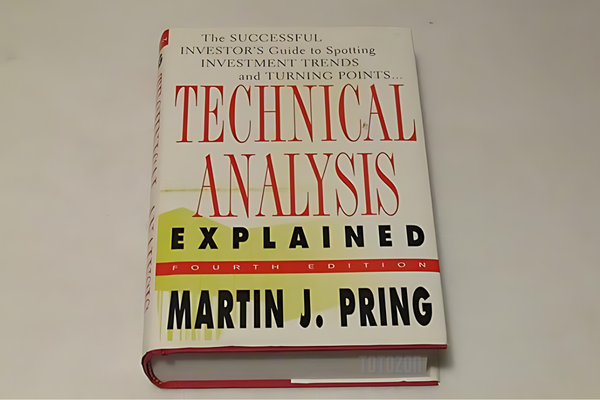 Technical Analysis Package with Martin Pring
1 × $4.00
Technical Analysis Package with Martin Pring
1 × $4.00 -
×
 Butterfly and Condor Workshop with Aeromir
1 × $15.00
Butterfly and Condor Workshop with Aeromir
1 × $15.00 -
×
 Special Webinars Module 1 with Trader Dante
1 × $6.00
Special Webinars Module 1 with Trader Dante
1 × $6.00 -
×
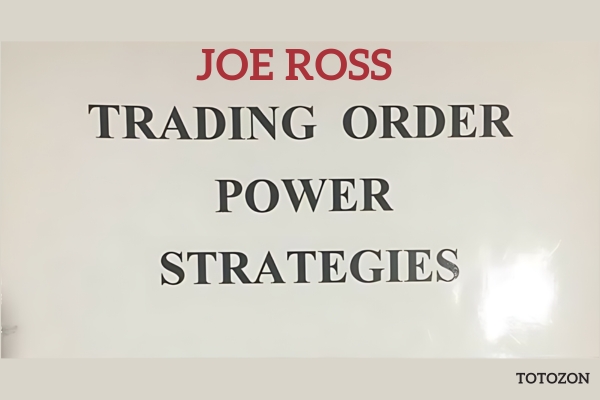 Trading Order Power Strategies
1 × $6.00
Trading Order Power Strategies
1 × $6.00 -
×
 The Day Traders Fast Track Program
1 × $23.00
The Day Traders Fast Track Program
1 × $23.00 -
×
 The Value Connection with Marc Gerstein
1 × $5.00
The Value Connection with Marc Gerstein
1 × $5.00 -
×
 Spike 35 Traders Manual with J.D.Hamon
1 × $6.00
Spike 35 Traders Manual with J.D.Hamon
1 × $6.00 -
×
 How to Collect Income Being Short with Don Kaufman
1 × $6.00
How to Collect Income Being Short with Don Kaufman
1 × $6.00 -
×
 The Inner Circle Seminar
1 × $15.00
The Inner Circle Seminar
1 × $15.00 -
×
 Romeo’s University of Turtle Soup with Romeo
1 × $6.00
Romeo’s University of Turtle Soup with Romeo
1 × $6.00 -
×
 How To Read The Market Professionally with TradeSmart
1 × $27.00
How To Read The Market Professionally with TradeSmart
1 × $27.00 -
×
 Math for the Trades with LearningExpress
1 × $6.00
Math for the Trades with LearningExpress
1 × $6.00 -
×
 Tandem Trader with Investors Underground
1 × $6.00
Tandem Trader with Investors Underground
1 × $6.00 -
×
 Textbook Trading DVD with InvestorsLive
1 × $6.00
Textbook Trading DVD with InvestorsLive
1 × $6.00 -
×
 Reminiscences of a Stock Operator (75th Aniversary Ed.) with Edwin Lefevre
1 × $6.00
Reminiscences of a Stock Operator (75th Aniversary Ed.) with Edwin Lefevre
1 × $6.00 -
×
 Entries & Exits Strategy with The Chart Guys
1 × $6.00
Entries & Exits Strategy with The Chart Guys
1 × $6.00 -
×
 Fed Balance Sheet 201 with Joseph Wang - Central Banking 101
1 × $10.00
Fed Balance Sheet 201 with Joseph Wang - Central Banking 101
1 × $10.00 -
×
 B.O.S.S. Carbon with Pat Mitchell – Trick Trades
1 × $8.00
B.O.S.S. Carbon with Pat Mitchell – Trick Trades
1 × $8.00 -
×
 Revolutionary Proven 3 Step with NFTs Cracked
1 × $6.00
Revolutionary Proven 3 Step with NFTs Cracked
1 × $6.00 -
×
 Pristine - Trading the Pristine Method 2
1 × $6.00
Pristine - Trading the Pristine Method 2
1 × $6.00 -
×
 How to Find the Most Profitable Stocks with Mubarak Shah
1 × $6.00
How to Find the Most Profitable Stocks with Mubarak Shah
1 × $6.00 -
×
 Technical & Fundamental Courses with Diamant Capital
1 × $5.00
Technical & Fundamental Courses with Diamant Capital
1 × $5.00 -
×
 Profit Wave Trade Strategy with Base Camp Trading
1 × $4.00
Profit Wave Trade Strategy with Base Camp Trading
1 × $4.00 -
×
 Bootcamp and eBook with Jjwurldin
1 × $24.00
Bootcamp and eBook with Jjwurldin
1 × $24.00 -
×
 Day Trading with Volume Profile and Orderflow - Price Action Volume Trader
1 × $6.00
Day Trading with Volume Profile and Orderflow - Price Action Volume Trader
1 × $6.00 -
×
 Day Trading with Lines in the Sky By R.L.Muehlberg
1 × $6.00
Day Trading with Lines in the Sky By R.L.Muehlberg
1 × $6.00 -
×
 Mutual Funds for Dummies (6th edition) with Eric Tyson
1 × $6.00
Mutual Funds for Dummies (6th edition) with Eric Tyson
1 × $6.00 -
×
 Affinity Foundation Option Course with Affinitytrading
1 × $6.00
Affinity Foundation Option Course with Affinitytrading
1 × $6.00 -
×
 Volume Trader Course (SMART MONEY SYSTEM-in German)
1 × $139.00
Volume Trader Course (SMART MONEY SYSTEM-in German)
1 × $139.00 -
×
 Tradingmarkets - Introduction to AmiBroker Programming
1 × $15.00
Tradingmarkets - Introduction to AmiBroker Programming
1 × $15.00 -
×
 Backspreads, Diagonals and Butterflies – Advanced Options Strategies
1 × $6.00
Backspreads, Diagonals and Butterflies – Advanced Options Strategies
1 × $6.00 -
×
 Super Structure Trading Home Study Course
1 × $23.00
Super Structure Trading Home Study Course
1 × $23.00 -
×
 Day Trading Options Guide PDF with Matt Diamond
1 × $23.00
Day Trading Options Guide PDF with Matt Diamond
1 × $23.00 -
×
 George Wollsten: Expert Stock and Grain Trader with George Bayer
1 × $6.00
George Wollsten: Expert Stock and Grain Trader with George Bayer
1 × $6.00 -
×
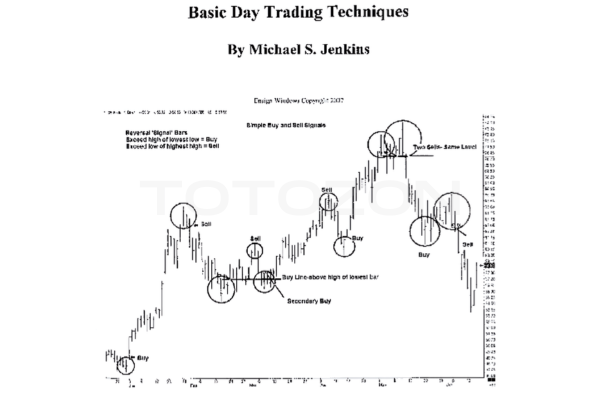 Basic Day Trading Techniques with Michael Jenkins
1 × $6.00
Basic Day Trading Techniques with Michael Jenkins
1 × $6.00 -
×
 Market Tide indicator with Alphashark
1 × $54.00
Market Tide indicator with Alphashark
1 × $54.00 -
×
 W. D Gann 's Square Of 9 Applied To Modern Markets with Sean Avidar - Hexatrade350
1 × $23.00
W. D Gann 's Square Of 9 Applied To Modern Markets with Sean Avidar - Hexatrade350
1 × $23.00 -
×
 Foreign Exchange Option Pricing: A Practitioner's Guide with Iain Clark
1 × $6.00
Foreign Exchange Option Pricing: A Practitioner's Guide with Iain Clark
1 × $6.00 -
×
 Algorithmic Trading Systems: Advanced Gap Strategies for the Futures Markets with David Bean
1 × $5.00
Algorithmic Trading Systems: Advanced Gap Strategies for the Futures Markets with David Bean
1 × $5.00 -
×
 Developing & Implementing Pattern-Based Trading Systems with Tushar S.Chande
1 × $6.00
Developing & Implementing Pattern-Based Trading Systems with Tushar S.Chande
1 × $6.00 -
×
 Long/Short Market Dynamics: Trading Strategies for Today's Markets with Clive Corcoran
1 × $6.00
Long/Short Market Dynamics: Trading Strategies for Today's Markets with Clive Corcoran
1 × $6.00 -
×
 TradeCraft: Your Path to Peak Performance Trading By Adam Grimes
1 × $15.00
TradeCraft: Your Path to Peak Performance Trading By Adam Grimes
1 × $15.00 -
×
 Building Automated Trading Systems C++.NET with Benjamin Van Vliet
1 × $6.00
Building Automated Trading Systems C++.NET with Benjamin Van Vliet
1 × $6.00 -
×
 ETF Trend Trading Mentorship Course
1 × $15.00
ETF Trend Trading Mentorship Course
1 × $15.00 -
×
 Chicago Trading Workshop 2017 with Marketdelta
1 × $23.00
Chicago Trading Workshop 2017 with Marketdelta
1 × $23.00 -
×
 Inner Circle Course with Darius Fx
1 × $24.00
Inner Circle Course with Darius Fx
1 × $24.00 -
×
 Price Action Trading Volume 2 with Fractal Flow Pro
1 × $6.00
Price Action Trading Volume 2 with Fractal Flow Pro
1 × $6.00 -
×
 Staying Out of Trouble Trading Currency with Channels - Barbara Rockefeller
1 × $6.00
Staying Out of Trouble Trading Currency with Channels - Barbara Rockefeller
1 × $6.00 -
×
 Best of the Best: Collars with Amy Meissner & Scott Ruble
1 × $15.00
Best of the Best: Collars with Amy Meissner & Scott Ruble
1 × $15.00
 with Arthur A.Hill")
Introduction to Candlestick (Article) with Arthur A.Hill
$6.00
File Size: Coming soon!
Delivery Time: 1–12 hours
Media Type: Online Course
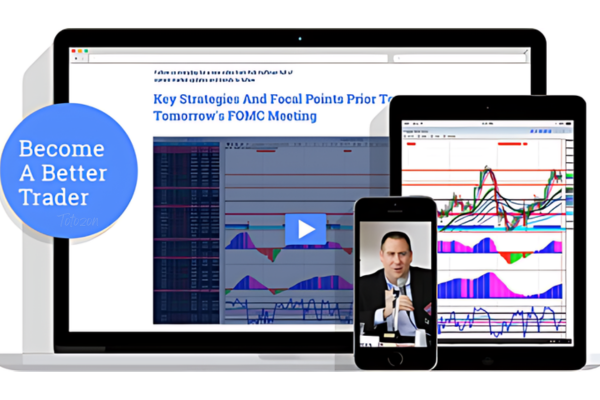
Content Proof: Watch Here!
You may check content proof of “Introduction to Candlestick (Article) with Arthur A.Hill” below:
 with Arthur A.Hill")
Introduction to Candlestick (Article) with Arthur A. Hill
Candlestick charting is an essential tool for traders and investors, providing a visual representation of price movements. Arthur A. Hill, a renowned expert in technical analysis, offers a comprehensive introduction to candlestick charts, making them accessible to beginners and valuable for experienced traders. Let’s explore the basics of candlestick charting and how it can enhance your trading strategy.
What is a Candlestick Chart?
A candlestick chart is a type of financial chart used to describe price movements of a security, derivative, or currency.
Components of a Candlestick
- Body: The thick part of the candlestick, showing the opening and closing prices.
- Wicks/Shadows: The thin lines above and below the body, indicating the highest and lowest prices during the period.
- Color: Traditionally, a green or white body indicates a closing price higher than the opening price, while a red or black body indicates a closing price lower than the opening price.
History of Candlestick Charting
Candlestick charting originated in Japan over 300 years ago, developed by rice traders to track market prices and daily supply and demand.
Evolution of Candlestick Charts
Over the centuries, candlestick charting has evolved and gained popularity worldwide, becoming a staple in technical analysis.
Introduction to Western Markets
Candlestick charts were introduced to the Western financial markets in the late 20th century and quickly became popular among traders.
Advantages of Candlestick Charts
Candlestick charts offer several advantages over traditional bar charts and line charts.
Visual Clarity
Candlestick charts provide a clear and concise representation of price movements, making it easier to interpret market trends.
Immediate Insight
The color-coded bodies and wicks offer immediate insight into market sentiment and price direction.
Pattern Recognition
Candlestick charts are excellent for identifying patterns that can predict future price movements.
Common Candlestick Patterns
- Doji: Indicates indecision in the market.
- Hammer: Suggests a potential reversal from a downtrend.
- Engulfing: A strong signal of a potential trend reversal.
Basic Candlestick Patterns
Understanding basic candlestick patterns is crucial for any trader looking to use this charting method effectively.
Bullish Patterns
Bullish patterns indicate potential upward price movements.
Hammer and Inverted Hammer
- Hammer: A candlestick with a small body and a long lower wick, indicating potential reversal from a downtrend.
- Inverted Hammer: Similar to the hammer but with a long upper wick, suggesting a potential bullish reversal.
Bearish Patterns
Bearish patterns suggest potential downward price movements.
Shooting Star and Hanging Man
- Shooting Star: A candlestick with a small body and a long upper wick, indicating a potential reversal from an uptrend.
- Hanging Man: Similar to the hammer but occurs after an uptrend, signaling a potential bearish reversal.
Advanced Candlestick Patterns
For more experienced traders, advanced candlestick patterns provide deeper insights into market trends.
Engulfing Patterns
Engulfing patterns occur when a smaller candlestick is followed by a larger candlestick that completely engulfs the smaller one.
Bullish Engulfing
A bullish engulfing pattern occurs at the bottom of a downtrend and signals a potential upward reversal.
Bearish Engulfing
A bearish engulfing pattern appears at the top of an uptrend and suggests a potential downward reversal.
Morning Star and Evening Star
These patterns are three-candlestick formations that indicate strong trend reversals.
Morning Star
The morning star pattern consists of a bearish candle, a small indecisive candle, and a bullish candle, indicating a bullish reversal.
Evening Star
The evening star pattern includes a bullish candle, a small indecisive candle, and a bearish candle, suggesting a bearish reversal.
Incorporating Candlestick Charts into Your Trading Strategy
Candlestick charts are versatile and can be integrated into various trading strategies.
Combining with Other Indicators
Enhance the effectiveness of candlestick charts by combining them with other technical indicators.
Popular Indicators to Combine
- Moving Averages: Confirm trends and potential reversals.
- Relative Strength Index (RSI): Identify overbought or oversold conditions.
- Bollinger Bands: Measure market volatility and potential breakouts.
Setting Up Your Trading Platform
Most trading platforms offer candlestick charting options. Ensure you customize your charts to suit your trading style.
Customization Tips
- Time Frames: Choose appropriate time frames for your trading strategy.
- Color Schemes: Use distinct colors for bullish and bearish candles.
- Indicators: Add complementary indicators to your charts.
Common Mistakes to Avoid
Even with a robust understanding of candlestick charts, traders can make mistakes that affect their performance.
Over-reliance on Patterns
Relying solely on candlestick patterns without considering other factors can lead to false signals.
Diversify Analysis
Always use candlestick patterns in conjunction with other forms of analysis and market indicators.
Ignoring Market Context
Candlestick patterns can be misleading if not considered within the broader market context.
Comprehensive Analysis
Incorporate fundamental analysis and overall market trends to validate candlestick signals.
Conclusion
Candlestick charting, as introduced by Arthur A. Hill, offers a powerful tool for traders to understand and predict market movements. By mastering basic and advanced patterns, combining them with other technical indicators, and avoiding common pitfalls, traders can enhance their market analysis and trading performance. Whether you’re new to trading or an experienced trader, candlestick charts provide valuable insights that can guide your investment decisions.
Frequently Asked Questions:
- What is a candlestick chart?
A candlestick chart is a type of financial chart used to represent price movements over a specific period, showing the opening, closing, high, and low prices. - Why are candlestick charts popular among traders?
They provide visual clarity and help in identifying patterns that can predict future price movements. - What are some basic candlestick patterns?
Basic patterns include the hammer, inverted hammer, shooting star, and hanging man, which indicate potential market reversals. - Can candlestick charts be used with other technical indicators?
Yes, combining candlestick charts with indicators like moving averages, RSI, and Bollinger Bands enhances their effectiveness. - How can I avoid common mistakes when using candlestick charts?
Avoid over-relying on patterns and always consider the broader market context and other forms of analysis.
Be the first to review “Introduction to Candlestick (Article) with Arthur A.Hill”
You must be logged in to post a review.
Related products

Original price was: $299.00.$8.00Current price is: $8.00.

Original price was: $649.00.$20.00Current price is: $20.00.

Forex Trading
Original price was: $1,098.00.$39.00Current price is: $39.00.

Forex Trading
Original price was: $550.00.$5.00Current price is: $5.00.

Forex Trading
Original price was: $125.00.$17.00Current price is: $17.00.

Forex Trading
Original price was: $999.00.$15.00Current price is: $15.00.

Original price was: $997.00.$13.00Current price is: $13.00.

Original price was: $497.00.$31.00Current price is: $31.00.

Forex Trading
Original price was: $2,997.00.$23.00Current price is: $23.00.

Original price was: $1,200.00.$23.00Current price is: $23.00.

Forex Trading
Original price was: $239.00.$8.00Current price is: $8.00.
Original price was: $4,995.00.$15.00Current price is: $15.00.

Forex Trading
The Complete Guide to Multiple Time Frame Analysis & Reading Price Action with Aiman Almansoori
Original price was: $1,399.00.$13.00Current price is: $13.00.

Forex Trading
Original price was: $397.00.$31.00Current price is: $31.00.

Original price was: $450.00.$23.00Current price is: $23.00.

Original price was: $2,120.00.$15.00Current price is: $15.00.

Forex Trading
Original price was: $697.00.$5.00Current price is: $5.00.
Forex Trading
Original price was: $799.00.$15.00Current price is: $15.00.

Forex Trading
Original price was: $499.00.$15.00Current price is: $15.00.

Original price was: $497.00.$11.00Current price is: $11.00.

Reviews
There are no reviews yet.