-
×
 Crypto Trading Academy with Cheeky Investor - Aussie Day Trader
1 × $13.00
Crypto Trading Academy with Cheeky Investor - Aussie Day Trader
1 × $13.00 -
×
 Technical Analysis By JC Parets - Investopedia Academy
1 × $15.00
Technical Analysis By JC Parets - Investopedia Academy
1 × $15.00 -
×
 WYCKOFF TRADING COURSE (WTC) PART I – ANALYSIS (Fall 2021) with Roman Bogomazov
1 × $209.00
WYCKOFF TRADING COURSE (WTC) PART I – ANALYSIS (Fall 2021) with Roman Bogomazov
1 × $209.00 -
×
 The Orderflow Masterclass with PrimeTrading
1 × $17.00
The Orderflow Masterclass with PrimeTrading
1 × $17.00 -
×
 Full Credit Spreads with Ryan Litchfield
1 × $6.00
Full Credit Spreads with Ryan Litchfield
1 × $6.00 -
×
 Confidence to Hypnotize
1 × $6.00
Confidence to Hypnotize
1 × $6.00 -
×
 Capital with Charles D.Ellis
1 × $6.00
Capital with Charles D.Ellis
1 × $6.00 -
×
 The Bible of Options Strategies: The Definitive Guide for Practical Trading Strategies with Guy Cohen
1 × $6.00
The Bible of Options Strategies: The Definitive Guide for Practical Trading Strategies with Guy Cohen
1 × $6.00 -
×
 Level II Trading Warfare - The Undergroundtrader's Powerful Weapons for Winning - Jea Yu
1 × $6.00
Level II Trading Warfare - The Undergroundtrader's Powerful Weapons for Winning - Jea Yu
1 × $6.00 -
×
 Currency Trading for Dummies with Mark Galant
1 × $6.00
Currency Trading for Dummies with Mark Galant
1 × $6.00 -
×
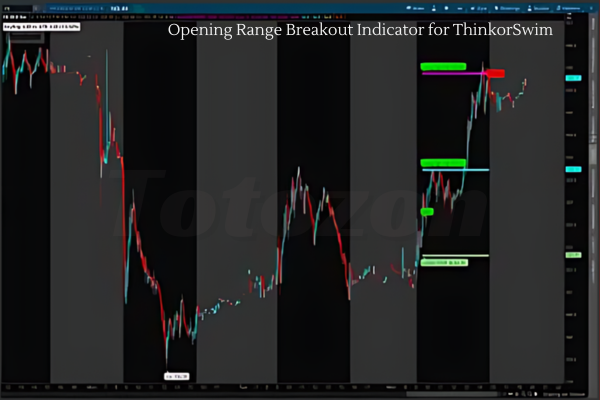 Opening Range Breakout Indicator for ThinkorSwim
1 × $6.00
Opening Range Breakout Indicator for ThinkorSwim
1 × $6.00 -
×
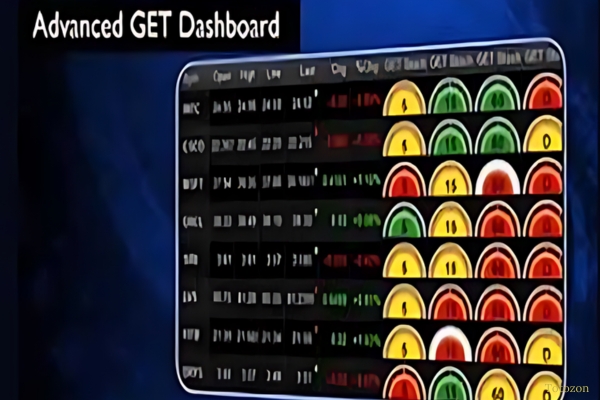 Advanced GET 8.0 EOD
1 × $6.00
Advanced GET 8.0 EOD
1 × $6.00 -
×
 Short Term Trading. Integrated Pithfork Analysis with Dr. Mircea Dologa
1 × $6.00
Short Term Trading. Integrated Pithfork Analysis with Dr. Mircea Dologa
1 × $6.00 -
×
 Introduction to Technical Analysis with Jake Bernstein
1 × $6.00
Introduction to Technical Analysis with Jake Bernstein
1 × $6.00 -
×
 Secret Forex Society Economic Reports (2006-2007) with Felix Homogratus
1 × $6.00
Secret Forex Society Economic Reports (2006-2007) with Felix Homogratus
1 × $6.00 -
×
 FX Capital Online
1 × $5.00
FX Capital Online
1 × $5.00 -
×
 How to Trade the New Single Stock Futures with Jack Bernstein
1 × $6.00
How to Trade the New Single Stock Futures with Jack Bernstein
1 × $6.00 -
×
 Volatile Markets Made Easy: Trading Stocks and Options for Increased Profits with Guy Cohen
1 × $6.00
Volatile Markets Made Easy: Trading Stocks and Options for Increased Profits with Guy Cohen
1 × $6.00 -
×
 Levines Guide to Spss for Analysis of Variance with Melanie Page, Sanford Braver & David Mackinnon
1 × $6.00
Levines Guide to Spss for Analysis of Variance with Melanie Page, Sanford Braver & David Mackinnon
1 × $6.00 -
×
 Trading Analysis Crash Course
1 × $23.00
Trading Analysis Crash Course
1 × $23.00 -
×
 Hedge Fund of Funds Investing with Joseph Nicholas
1 × $6.00
Hedge Fund of Funds Investing with Joseph Nicholas
1 × $6.00 -
×
 Pristine - Noble DraKoln – The Complete Liverpool Futures Seminar Series
1 × $6.00
Pristine - Noble DraKoln – The Complete Liverpool Futures Seminar Series
1 × $6.00 -
×
 Compass Trading System with Right Line Trading
1 × $39.00
Compass Trading System with Right Line Trading
1 × $39.00 -
×
 Accumulation & Distribution with Larry Williams
1 × $4.00
Accumulation & Distribution with Larry Williams
1 × $4.00 -
×
 The Art And Science Of Trading with Adam Grimes
1 × $6.00
The Art And Science Of Trading with Adam Grimes
1 × $6.00 -
×
 Trading Short TermSame Day Trades Sep 2023 with Dan Sheridan & Mark Fenton - Sheridan Options Mentoring
1 × $31.00
Trading Short TermSame Day Trades Sep 2023 with Dan Sheridan & Mark Fenton - Sheridan Options Mentoring
1 × $31.00 -
×
 How To Read The Market Professionally with TradeSmart
1 × $27.00
How To Read The Market Professionally with TradeSmart
1 × $27.00 -
×
 Scalp Strategy and Flipping Small Accounts with Opes Trading Group
1 × $5.00
Scalp Strategy and Flipping Small Accounts with Opes Trading Group
1 × $5.00 -
×
 Ultimate Trading Course with Dodgy's Dungeon
1 × $8.00
Ultimate Trading Course with Dodgy's Dungeon
1 × $8.00 -
×
 $20 – 52k 20 pips a day challange with Rafał Zuchowicz - TopMasterTrader
1 × $5.00
$20 – 52k 20 pips a day challange with Rafał Zuchowicz - TopMasterTrader
1 × $5.00 -
×
 Investing with LEAPS. What You Should Know About Long Term Investing with James Bittman
1 × $6.00
Investing with LEAPS. What You Should Know About Long Term Investing with James Bittman
1 × $6.00 -
×
 Vertex Investing Course
1 × $6.00
Vertex Investing Course
1 × $6.00 -
×
 The Complete Guide To Futures & Commodities Trading with Stephen Jennings
1 × $6.00
The Complete Guide To Futures & Commodities Trading with Stephen Jennings
1 × $6.00 -
×
 Traders Secret Library
1 × $6.00
Traders Secret Library
1 × $6.00 -
×
 Trading Using Ocean Theory with Pat Raffolovich
1 × $4.00
Trading Using Ocean Theory with Pat Raffolovich
1 × $4.00 -
×
 90 Days To Trade MasterClass with Jerremy Newsome & Matt Delong - Real Life Trading
1 × $104.00
90 Days To Trade MasterClass with Jerremy Newsome & Matt Delong - Real Life Trading
1 × $104.00 -
×
 Advance Courses for Members
1 × $15.00
Advance Courses for Members
1 × $15.00 -
×
 Rob’s 6 Day 21 Set-up Course with Rob Hoffman
1 × $85.00
Rob’s 6 Day 21 Set-up Course with Rob Hoffman
1 × $85.00 -
×
 Profit Trading VIX Options Course with Don Kaufman
1 × $6.00
Profit Trading VIX Options Course with Don Kaufman
1 × $6.00 -
×
 Traders Secret Success Package. Symmetry Wave Trading with Michael Gur Dillon
1 × $6.00
Traders Secret Success Package. Symmetry Wave Trading with Michael Gur Dillon
1 × $6.00 -
×
 Fractal Markets SFX with Tyson Bieniek
1 × $5.00
Fractal Markets SFX with Tyson Bieniek
1 × $5.00 -
×
 TRADING NFX Course with Andrew NFX
1 × $5.00
TRADING NFX Course with Andrew NFX
1 × $5.00 -
×
 Swing Trading Futures & Commodities with the COT
1 × $93.00
Swing Trading Futures & Commodities with the COT
1 × $93.00 -
×
 Traders Trick Advanced Concepts - Recorded Webinar with Joe Ross
1 × $23.00
Traders Trick Advanced Concepts - Recorded Webinar with Joe Ross
1 × $23.00 -
×
 Expert Forex Systems with Andrew Fields
1 × $6.00
Expert Forex Systems with Andrew Fields
1 × $6.00 -
×
 Technical Trading: System and Design Testing Class with Jeff Bierman
1 × $6.00
Technical Trading: System and Design Testing Class with Jeff Bierman
1 × $6.00 -
×
 The Options Course Woorkbook. Exercises and Tests for Options Course Book with George Fontanillis
1 × $6.00
The Options Course Woorkbook. Exercises and Tests for Options Course Book with George Fontanillis
1 × $6.00 -
×
 Elite Price Action Tutorials with Wmd4x
1 × $8.00
Elite Price Action Tutorials with Wmd4x
1 × $8.00 -
×
 Bond Market Course with The Macro Compass
1 × $15.00
Bond Market Course with The Macro Compass
1 × $15.00 -
×
 Technical Analysis for Long-Term Investors with Clay Allen
1 × $6.00
Technical Analysis for Long-Term Investors with Clay Allen
1 × $6.00 -
×
 Forex Trading Course with Zack Kolundzic
1 × $6.00
Forex Trading Course with Zack Kolundzic
1 × $6.00 -
×
 How to Trade Stock Options Course
1 × $6.00
How to Trade Stock Options Course
1 × $6.00 -
×
 Complete Trading System with Segma Singh
1 × $6.00
Complete Trading System with Segma Singh
1 × $6.00 -
×
 Price Headley - Using Williams %R The BigTrends Way
1 × $6.00
Price Headley - Using Williams %R The BigTrends Way
1 × $6.00 -
×
 Options Trading & Ultimate MasterClass With Tyrone Abela - FX Evolution
1 × $54.00
Options Trading & Ultimate MasterClass With Tyrone Abela - FX Evolution
1 × $54.00 -
×
 The Oil Money (open code) (Nov 2013)
1 × $6.00
The Oil Money (open code) (Nov 2013)
1 × $6.00 -
×
 Crystal Ball Pack PLUS bonus Live Trade By Pat Mitchell - Trick Trades
1 × $20.00
Crystal Ball Pack PLUS bonus Live Trade By Pat Mitchell - Trick Trades
1 × $20.00 -
×
 Wheels of Gann. Top Secret Forecast Guide with Pat Reda
1 × $6.00
Wheels of Gann. Top Secret Forecast Guide with Pat Reda
1 × $6.00 -
×
 White Phoenix’s The Smart (Money) Approach to Trading with Jayson Casper
1 × $39.00
White Phoenix’s The Smart (Money) Approach to Trading with Jayson Casper
1 × $39.00 -
×
 RTM + Suppy and Demand with Nora Bystra
1 × $6.00
RTM + Suppy and Demand with Nora Bystra
1 × $6.00 -
×
 The Trading Blueprint with Brad Goh - The Trading Geek
1 × $5.00
The Trading Blueprint with Brad Goh - The Trading Geek
1 × $5.00 -
×
 Neall Concord-Cushing - Secret of Forecasting Using Wave59 Tools (Book I & II)
1 × $6.00
Neall Concord-Cushing - Secret of Forecasting Using Wave59 Tools (Book I & II)
1 × $6.00 -
×
 Essentials in Quantitative Trading QT01 By HangukQuant's
1 × $23.00
Essentials in Quantitative Trading QT01 By HangukQuant's
1 × $23.00 -
×
 Commodity Futures Traders Club (CTCN) Issues 01 – 77
1 × $6.00
Commodity Futures Traders Club (CTCN) Issues 01 – 77
1 × $6.00 -
×
 A Conservative Plan to Make $3K Monthly on $25K with Dan Sheridan – Sheridan Options Mentoring
1 × $23.00
A Conservative Plan to Make $3K Monthly on $25K with Dan Sheridan – Sheridan Options Mentoring
1 × $23.00 -
×
 Squeeze the Markets with Markay Latimer
1 × $6.00
Squeeze the Markets with Markay Latimer
1 × $6.00 -
×
 Aspectos Generales del Mercado de Valores with A.Bachiller
1 × $6.00
Aspectos Generales del Mercado de Valores with A.Bachiller
1 × $6.00 -
×
 Activedaytrader - Mastering Technicals
1 × $15.00
Activedaytrader - Mastering Technicals
1 × $15.00 -
×
 Apteros Trading Fall Intensive 2021 - Trading Intensive
1 × $54.00
Apteros Trading Fall Intensive 2021 - Trading Intensive
1 × $54.00 -
×
 Alternative Beta Strategies & Hedge Fund Replication with Lars Jaeger & Jeffrey Pease
1 × $6.00
Alternative Beta Strategies & Hedge Fund Replication with Lars Jaeger & Jeffrey Pease
1 × $6.00 -
×
 Artificial Intelligence with Larry Pesavento
1 × $6.00
Artificial Intelligence with Larry Pesavento
1 × $6.00 -
×
 AI For Traders with Trading Markets
1 × $31.00
AI For Traders with Trading Markets
1 × $31.00 -
×
 Technical Analysis for the Trading Professional with Constance Brown
1 × $6.00
Technical Analysis for the Trading Professional with Constance Brown
1 × $6.00 -
×
 Advanced Strategies in Forex Trading with Don Schellenberg
1 × $6.00
Advanced Strategies in Forex Trading with Don Schellenberg
1 × $6.00 -
×
 Consistently Profitable Trader with Pollinate Trading
1 × $13.00
Consistently Profitable Trader with Pollinate Trading
1 × $13.00 -
×
 Yarimi University Course
1 × $56.00
Yarimi University Course
1 × $56.00 -
×
 Trading Systems Explained with Martin Pring
1 × $6.00
Trading Systems Explained with Martin Pring
1 × $6.00 -
×
 A Day In The Life Of A Forex Trader with Vic Noble & Shirley Hudson
1 × $23.00
A Day In The Life Of A Forex Trader with Vic Noble & Shirley Hudson
1 × $23.00 -
×
 Pro Trader Boot Camp Home Study with Derrick Oldensmith - T3 Live
1 × $31.00
Pro Trader Boot Camp Home Study with Derrick Oldensmith - T3 Live
1 × $31.00 -
×
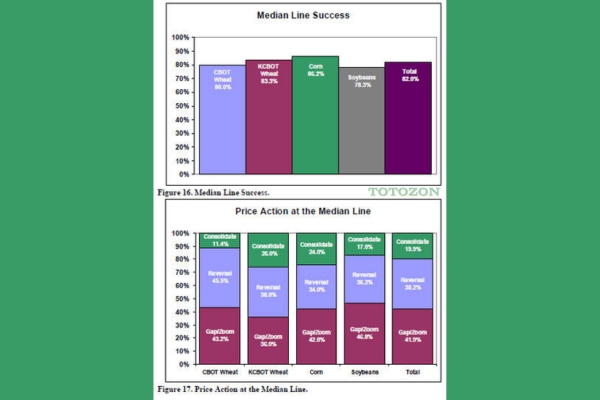 Using Median Lines as a Trading Tool with Greg Fisher
1 × $6.00
Using Median Lines as a Trading Tool with Greg Fisher
1 × $6.00 -
×
 Trading with MORE Special Set-ups - Recorded Webinar
1 × $15.00
Trading with MORE Special Set-ups - Recorded Webinar
1 × $15.00 -
×
 Wealth Management with Dimitris Chorafas
1 × $6.00
Wealth Management with Dimitris Chorafas
1 × $6.00 -
×
 Spread Trading
1 × $6.00
Spread Trading
1 × $6.00 -
×
 Behavior and Performance of Investment Newsletter Analysts (Article) with Alok Kumar
1 × $6.00
Behavior and Performance of Investment Newsletter Analysts (Article) with Alok Kumar
1 × $6.00 -
×
 The M21 Strategy
1 × $15.00
The M21 Strategy
1 × $15.00 -
×
 Beginner's Guide to Ratio Butterflys Class with Don Kaufman
1 × $6.00
Beginner's Guide to Ratio Butterflys Class with Don Kaufman
1 × $6.00 -
×
 PROPRIETARY TRADING PROGRAM with Bid Ask Trader
1 × $31.00
PROPRIETARY TRADING PROGRAM with Bid Ask Trader
1 × $31.00 -
×
 TradeCraft: Your Path to Peak Performance Trading By Adam Grimes
1 × $15.00
TradeCraft: Your Path to Peak Performance Trading By Adam Grimes
1 × $15.00 -
×
 The New Contrarian Investing Strategies. The Next Generation. Psychology and the Stock with David Dreman
1 × $6.00
The New Contrarian Investing Strategies. The Next Generation. Psychology and the Stock with David Dreman
1 × $6.00 -
×
 The Complete Value Investing Course (Updated 2019) with Wealthy Education
1 × $6.00
The Complete Value Investing Course (Updated 2019) with Wealthy Education
1 × $6.00 -
×
 The Streetsmart Guide to Timing the Stock Market with Colin Alexander
1 × $6.00
The Streetsmart Guide to Timing the Stock Market with Colin Alexander
1 × $6.00 -
×
 All About Stocks (3rd Ed.) withEsme E.Faerber
1 × $6.00
All About Stocks (3rd Ed.) withEsme E.Faerber
1 × $6.00 -
×
 The Art of the Trade: What I Learned (and Lost) Trading the Chicago Futures Markets - Jason Alan Jankovsky
1 × $6.00
The Art of the Trade: What I Learned (and Lost) Trading the Chicago Futures Markets - Jason Alan Jankovsky
1 × $6.00 -
×
 Best Trading Set Ups Playbook with Stacey Burke Trading
1 × $5.00
Best Trading Set Ups Playbook with Stacey Burke Trading
1 × $5.00 -
×
 Quant Edge with T3 Live
1 × $6.00
Quant Edge with T3 Live
1 × $6.00 -
×
 Chaos. The New Map for Traders
1 × $15.00
Chaos. The New Map for Traders
1 × $15.00 -
×
 Trading for a Bright Future with Martin Cole
1 × $6.00
Trading for a Bright Future with Martin Cole
1 × $6.00 -
×
 The Money Flow Trading System: A Profitable Trend Following System So Easy You Can Run it On Your Phone! (English Edition) (Kindle) - Bernd Traxl
1 × $6.00
The Money Flow Trading System: A Profitable Trend Following System So Easy You Can Run it On Your Phone! (English Edition) (Kindle) - Bernd Traxl
1 × $6.00 -
×
 The City Traders Course with Andrew Lockwood
1 × $10.00
The City Traders Course with Andrew Lockwood
1 × $10.00 -
×
 JJ Dream Team Workshop Training Full Course
1 × $55.00
JJ Dream Team Workshop Training Full Course
1 × $55.00 -
×
 A Complete Beginner to Advanced Trading Mentorship Program with Habby Forex Trading Academy
1 × $5.00
A Complete Beginner to Advanced Trading Mentorship Program with Habby Forex Trading Academy
1 × $5.00 -
×
 Emini Day Trading Boot Camp - Base Camp Trading
1 × $6.00
Emini Day Trading Boot Camp - Base Camp Trading
1 × $6.00 -
×
 Money Attraction Bootcamp - Video + Audio + Workbook by Greg Habstritt
1 × $6.00
Money Attraction Bootcamp - Video + Audio + Workbook by Greg Habstritt
1 × $6.00 -
×
 Active Investment Management: Finding and Harnessing Investment Skill with Charles Jackson
1 × $6.00
Active Investment Management: Finding and Harnessing Investment Skill with Charles Jackson
1 × $6.00 -
×
 Euro Trading Course with Bkforex
1 × $6.00
Euro Trading Course with Bkforex
1 × $6.00 -
×
 Ez-Forex Trading System 4.2 with Beau Diamond
1 × $6.00
Ez-Forex Trading System 4.2 with Beau Diamond
1 × $6.00 -
×
 Automatic Millionaire (Audio Book) with David Bach
1 × $6.00
Automatic Millionaire (Audio Book) with David Bach
1 × $6.00 -
×
 Forex Trading Education Program (Apr-June 2010) with Jimmy Young
1 × $6.00
Forex Trading Education Program (Apr-June 2010) with Jimmy Young
1 × $6.00 -
×
 The Indices Orderflow Masterclass with The Forex Scalpers
1 × $23.00
The Indices Orderflow Masterclass with The Forex Scalpers
1 × $23.00 -
×
 The Dark Side Of Valuation with Aswath Damodaran
1 × $6.00
The Dark Side Of Valuation with Aswath Damodaran
1 × $6.00 -
×
 Option Strategies with Courtney Smith
1 × $6.00
Option Strategies with Courtney Smith
1 × $6.00 -
×
 Day Trading Institution 2.0 with Raul Gonzalez
1 × $5.00
Day Trading Institution 2.0 with Raul Gonzalez
1 × $5.00 -
×
 An Ultimate Guide to Successful Investing with Trading Tuitions
1 × $23.00
An Ultimate Guide to Successful Investing with Trading Tuitions
1 × $23.00 -
×
 Forex Trading Advice & Intro to The Natural Flow
1 × $6.00
Forex Trading Advice & Intro to The Natural Flow
1 × $6.00 -
×
 Cracking The Forex Code with Kevin Adams
1 × $6.00
Cracking The Forex Code with Kevin Adams
1 × $6.00 -
×
 All About Mutual Funds with Bruce Jacobs
1 × $6.00
All About Mutual Funds with Bruce Jacobs
1 × $6.00 -
×
 Trade Like a Pro in Currency Trading with Don Schellenberg
1 × $6.00
Trade Like a Pro in Currency Trading with Don Schellenberg
1 × $6.00 -
×
 Value Investing King of Trading Methods in the Commodity Markets - Hal Masover
1 × $6.00
Value Investing King of Trading Methods in the Commodity Markets - Hal Masover
1 × $6.00 -
×
 Game Plan of a Winning Trader with Mike Podwojski & Vic Noble
1 × $6.00
Game Plan of a Winning Trader with Mike Podwojski & Vic Noble
1 × $6.00 -
×
 Algo Trading Masterclass with Ali Casey - StatOasis
1 × $23.00
Algo Trading Masterclass with Ali Casey - StatOasis
1 × $23.00 -
×
 Order flow self-study training program with iMFtracker
1 × $10.00
Order flow self-study training program with iMFtracker
1 × $10.00 -
×
 Best of the Best: Collars with Amy Meissner & Scott Ruble
1 × $15.00
Best of the Best: Collars with Amy Meissner & Scott Ruble
1 × $15.00
 with Arthur A.Hill")
Introduction to Candlestick (Article) with Arthur A.Hill
$6.00
File Size: Coming soon!
Delivery Time: 1–12 hours
Media Type: Online Course
Content Proof: Watch Here!
You may check content proof of “Introduction to Candlestick (Article) with Arthur A.Hill” below:
 with Arthur A.Hill")
Introduction to Candlestick (Article) with Arthur A. Hill
Candlestick charting is an essential tool for traders and investors, providing a visual representation of price movements. Arthur A. Hill, a renowned expert in technical analysis, offers a comprehensive introduction to candlestick charts, making them accessible to beginners and valuable for experienced traders. Let’s explore the basics of candlestick charting and how it can enhance your trading strategy.
What is a Candlestick Chart?
A candlestick chart is a type of financial chart used to describe price movements of a security, derivative, or currency.
Components of a Candlestick
- Body: The thick part of the candlestick, showing the opening and closing prices.
- Wicks/Shadows: The thin lines above and below the body, indicating the highest and lowest prices during the period.
- Color: Traditionally, a green or white body indicates a closing price higher than the opening price, while a red or black body indicates a closing price lower than the opening price.
History of Candlestick Charting
Candlestick charting originated in Japan over 300 years ago, developed by rice traders to track market prices and daily supply and demand.
Evolution of Candlestick Charts
Over the centuries, candlestick charting has evolved and gained popularity worldwide, becoming a staple in technical analysis.
Introduction to Western Markets
Candlestick charts were introduced to the Western financial markets in the late 20th century and quickly became popular among traders.
Advantages of Candlestick Charts
Candlestick charts offer several advantages over traditional bar charts and line charts.
Visual Clarity
Candlestick charts provide a clear and concise representation of price movements, making it easier to interpret market trends.
Immediate Insight
The color-coded bodies and wicks offer immediate insight into market sentiment and price direction.
Pattern Recognition
Candlestick charts are excellent for identifying patterns that can predict future price movements.
Common Candlestick Patterns
- Doji: Indicates indecision in the market.
- Hammer: Suggests a potential reversal from a downtrend.
- Engulfing: A strong signal of a potential trend reversal.
Basic Candlestick Patterns
Understanding basic candlestick patterns is crucial for any trader looking to use this charting method effectively.
Bullish Patterns
Bullish patterns indicate potential upward price movements.
Hammer and Inverted Hammer
- Hammer: A candlestick with a small body and a long lower wick, indicating potential reversal from a downtrend.
- Inverted Hammer: Similar to the hammer but with a long upper wick, suggesting a potential bullish reversal.
Bearish Patterns
Bearish patterns suggest potential downward price movements.
Shooting Star and Hanging Man
- Shooting Star: A candlestick with a small body and a long upper wick, indicating a potential reversal from an uptrend.
- Hanging Man: Similar to the hammer but occurs after an uptrend, signaling a potential bearish reversal.
Advanced Candlestick Patterns
For more experienced traders, advanced candlestick patterns provide deeper insights into market trends.
Engulfing Patterns
Engulfing patterns occur when a smaller candlestick is followed by a larger candlestick that completely engulfs the smaller one.
Bullish Engulfing
A bullish engulfing pattern occurs at the bottom of a downtrend and signals a potential upward reversal.
Bearish Engulfing
A bearish engulfing pattern appears at the top of an uptrend and suggests a potential downward reversal.
Morning Star and Evening Star
These patterns are three-candlestick formations that indicate strong trend reversals.
Morning Star
The morning star pattern consists of a bearish candle, a small indecisive candle, and a bullish candle, indicating a bullish reversal.
Evening Star
The evening star pattern includes a bullish candle, a small indecisive candle, and a bearish candle, suggesting a bearish reversal.
Incorporating Candlestick Charts into Your Trading Strategy
Candlestick charts are versatile and can be integrated into various trading strategies.
Combining with Other Indicators
Enhance the effectiveness of candlestick charts by combining them with other technical indicators.
Popular Indicators to Combine
- Moving Averages: Confirm trends and potential reversals.
- Relative Strength Index (RSI): Identify overbought or oversold conditions.
- Bollinger Bands: Measure market volatility and potential breakouts.
Setting Up Your Trading Platform
Most trading platforms offer candlestick charting options. Ensure you customize your charts to suit your trading style.
Customization Tips
- Time Frames: Choose appropriate time frames for your trading strategy.
- Color Schemes: Use distinct colors for bullish and bearish candles.
- Indicators: Add complementary indicators to your charts.
Common Mistakes to Avoid
Even with a robust understanding of candlestick charts, traders can make mistakes that affect their performance.
Over-reliance on Patterns
Relying solely on candlestick patterns without considering other factors can lead to false signals.
Diversify Analysis
Always use candlestick patterns in conjunction with other forms of analysis and market indicators.
Ignoring Market Context
Candlestick patterns can be misleading if not considered within the broader market context.
Comprehensive Analysis
Incorporate fundamental analysis and overall market trends to validate candlestick signals.
Conclusion
Candlestick charting, as introduced by Arthur A. Hill, offers a powerful tool for traders to understand and predict market movements. By mastering basic and advanced patterns, combining them with other technical indicators, and avoiding common pitfalls, traders can enhance their market analysis and trading performance. Whether you’re new to trading or an experienced trader, candlestick charts provide valuable insights that can guide your investment decisions.
Frequently Asked Questions:
- What is a candlestick chart?
A candlestick chart is a type of financial chart used to represent price movements over a specific period, showing the opening, closing, high, and low prices. - Why are candlestick charts popular among traders?
They provide visual clarity and help in identifying patterns that can predict future price movements. - What are some basic candlestick patterns?
Basic patterns include the hammer, inverted hammer, shooting star, and hanging man, which indicate potential market reversals. - Can candlestick charts be used with other technical indicators?
Yes, combining candlestick charts with indicators like moving averages, RSI, and Bollinger Bands enhances their effectiveness. - How can I avoid common mistakes when using candlestick charts?
Avoid over-relying on patterns and always consider the broader market context and other forms of analysis.
Be the first to review “Introduction to Candlestick (Article) with Arthur A.Hill”
You must be logged in to post a review.
Related products
Original price was: $1,800.00.$54.00Current price is: $54.00.

Original price was: $997.00.$8.00Current price is: $8.00.

Forex Trading
Original price was: $797.00.$10.00Current price is: $10.00.

Original price was: $497.00.$11.00Current price is: $11.00.
Original price was: $197.00.$5.00Current price is: $5.00.
Forex Trading
Original price was: $499.00.$15.00Current price is: $15.00.
Original price was: $799.00.$15.00Current price is: $15.00.

Forex Trading
Quantamentals – The Next Great Forefront Of Trading and Investing with Trading Markets
Original price was: $1,495.00.$8.00Current price is: $8.00.

Forex Trading
Original price was: $999.00.$15.00Current price is: $15.00.

Original price was: $299.00.$8.00Current price is: $8.00.

Original price was: $695.00.$41.00Current price is: $41.00.
Forex Trading
Original price was: $1,098.00.$39.00Current price is: $39.00.
Forex Trading
Original price was: $239.00.$8.00Current price is: $8.00.
Forex Trading
Original price was: $697.00.$5.00Current price is: $5.00.
Forex Trading
Original price was: $397.00.$31.00Current price is: $31.00.
Original price was: $700.00.$39.00Current price is: $39.00.
Forex Trading
Original price was: $500.00.$5.00Current price is: $5.00.

Forex Trading
The Complete Guide to Multiple Time Frame Analysis & Reading Price Action with Aiman Almansoori
Original price was: $1,399.00.$13.00Current price is: $13.00.

Forex Trading
Original price was: $550.00.$5.00Current price is: $5.00.
Forex Trading
Original price was: $2,000.00.$23.00Current price is: $23.00.

Reviews
There are no reviews yet.