-
×
 Trading Mindset, and Three Steps To Profitable Trading with Bruce Banks
1 × $6.00
Trading Mindset, and Three Steps To Profitable Trading with Bruce Banks
1 × $6.00 -
×
 Millard on Channel Analysis: The key to Share Price Prediction (2nd Ed.) with Brian Millard
1 × $6.00
Millard on Channel Analysis: The key to Share Price Prediction (2nd Ed.) with Brian Millard
1 × $6.00 -
×
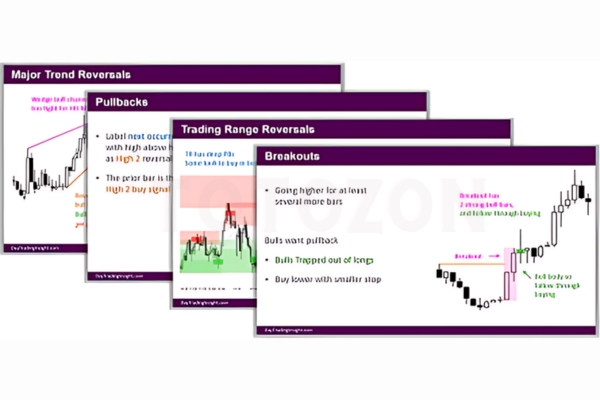 Day Trading Insight with Al Brooks
1 × $10.00
Day Trading Insight with Al Brooks
1 × $10.00 -
×
 The Practical Handbook of Genetic Algorithms with Lance Chambers
1 × $6.00
The Practical Handbook of Genetic Algorithms with Lance Chambers
1 × $6.00 -
×
 The A to Z of Mathematics: A Basic Guide with Thomas Sidebotham
1 × $6.00
The A to Z of Mathematics: A Basic Guide with Thomas Sidebotham
1 × $6.00 -
×
 Secrets of An Electronic Futures Trader with Larry Levin
1 × $6.00
Secrets of An Electronic Futures Trader with Larry Levin
1 × $6.00 -
×
 The Trading Blueprint with Brad Goh - The Trading Geek
1 × $5.00
The Trading Blueprint with Brad Goh - The Trading Geek
1 × $5.00 -
×
 $20 – 52k 20 pips a day challange with Rafał Zuchowicz - TopMasterTrader
1 × $5.00
$20 – 52k 20 pips a day challange with Rafał Zuchowicz - TopMasterTrader
1 × $5.00 -
×
 WondaFX Signature Strategy with WondaFX
1 × $5.00
WondaFX Signature Strategy with WondaFX
1 × $5.00 -
×
 ICT Prodigy Trading Course – $650K in Payouts with Alex Solignani
1 × $15.00
ICT Prodigy Trading Course – $650K in Payouts with Alex Solignani
1 × $15.00 -
×
 How to Avoid Tax on Your Stock Market Profits with Lee Hadnum
1 × $6.00
How to Avoid Tax on Your Stock Market Profits with Lee Hadnum
1 × $6.00 -
×
 T. Harv Eker’s All-Access
1 × $39.00
T. Harv Eker’s All-Access
1 × $39.00 -
×
 Algo Trading Masterclass with Ali Casey - StatOasis
1 × $23.00
Algo Trading Masterclass with Ali Casey - StatOasis
1 × $23.00 -
×
 Fast Start Barter System with Bob Meyer
1 × $31.00
Fast Start Barter System with Bob Meyer
1 × $31.00 -
×
 Essentials Course & Day Trading Strategies with Bear Bull Traders
1 × $13.00
Essentials Course & Day Trading Strategies with Bear Bull Traders
1 × $13.00 -
×
 8 Strategies for Day Trading
1 × $31.00
8 Strategies for Day Trading
1 × $31.00 -
×
 Deep Market Analysis Volume 1 with Fractal Flow Pro
1 × $6.00
Deep Market Analysis Volume 1 with Fractal Flow Pro
1 × $6.00 -
×
 Setups of a Winning Trader with Gareth Soloway
1 × $521.00
Setups of a Winning Trader with Gareth Soloway
1 × $521.00 -
×
 Candlestick Charting Explained with Greg Morris
1 × $8.00
Candlestick Charting Explained with Greg Morris
1 × $8.00 -
×
 Profiletraders - MARKET PROFILE TACTICAL STRATEGIES FOR DAY TRADING
1 × $23.00
Profiletraders - MARKET PROFILE TACTICAL STRATEGIES FOR DAY TRADING
1 × $23.00 -
×
 How I use Technical Analysis & Orderflow with Adam Webb - Traderskew
1 × $54.00
How I use Technical Analysis & Orderflow with Adam Webb - Traderskew
1 × $54.00 -
×
 Compass Trading System with Right Line Trading
1 × $39.00
Compass Trading System with Right Line Trading
1 × $39.00 -
×
 7 Day FX Mastery Course with Market Masters
1 × $6.00
7 Day FX Mastery Course with Market Masters
1 × $6.00 -
×
 Commodity Trading Video Course with Bob Buran
1 × $6.00
Commodity Trading Video Course with Bob Buran
1 × $6.00 -
×
 The Deadly 7 Sins of Investing with Maury Fertig
1 × $6.00
The Deadly 7 Sins of Investing with Maury Fertig
1 × $6.00 -
×
 Swing Trading (Italian) with Guiuseppe Migliorino
1 × $6.00
Swing Trading (Italian) with Guiuseppe Migliorino
1 × $6.00 -
×
 Scalp Strategy and Flipping Small Accounts with Opes Trading Group
1 × $5.00
Scalp Strategy and Flipping Small Accounts with Opes Trading Group
1 × $5.00 -
×
 The Complete Lot Flipper System
1 × $6.00
The Complete Lot Flipper System
1 × $6.00 -
×
 Learn Investing & Trading with Danny Devan
1 × $23.00
Learn Investing & Trading with Danny Devan
1 × $23.00 -
×
 ALGO™ Online Retail - Version 2.9
1 × $155.00
ALGO™ Online Retail - Version 2.9
1 × $155.00 -
×
 Ezaih Academy 2024 Mentorship with Ezaih
1 × $54.00
Ezaih Academy 2024 Mentorship with Ezaih
1 × $54.00 -
×
 Applications of Abstract Algebra with Maple - Richard E.Kline, Neil Sigmon, Ernst Stitzinger
1 × $6.00
Applications of Abstract Algebra with Maple - Richard E.Kline, Neil Sigmon, Ernst Stitzinger
1 × $6.00 -
×
 Candlestick Patterns to Master Forex Trading Price Action with Federico Sellitti
1 × $6.00
Candlestick Patterns to Master Forex Trading Price Action with Federico Sellitti
1 × $6.00 -
×
 Commodities Rising: The Reality Behind the Hype and How To Really Profit in the Commodities Market - Jeffrey Christian
1 × $6.00
Commodities Rising: The Reality Behind the Hype and How To Really Profit in the Commodities Market - Jeffrey Christian
1 × $6.00 -
×
 7 Figures Forex Course
1 × $15.00
7 Figures Forex Course
1 × $15.00 -
×
 Options Trading. The Hidden Reality Course with Charles Cottle
1 × $6.00
Options Trading. The Hidden Reality Course with Charles Cottle
1 × $6.00 -
×
 Forecast 2024 Clarification with Larry Williams
1 × $15.00
Forecast 2024 Clarification with Larry Williams
1 × $15.00 -
×
 4D Bootcamp with Black Rabbit
1 × $10.00
4D Bootcamp with Black Rabbit
1 × $10.00 -
×
 Optimize Funding Program 2023 with Solo Network Courses
1 × $13.00
Optimize Funding Program 2023 with Solo Network Courses
1 × $13.00 -
×
 Butterfly and Condor Workshop with Aeromir
1 × $15.00
Butterfly and Condor Workshop with Aeromir
1 × $15.00 -
×
 How Stocks Work with David L.Scott
1 × $6.00
How Stocks Work with David L.Scott
1 × $6.00 -
×
 The Practical Fractal with Bill Williams
1 × $6.00
The Practical Fractal with Bill Williams
1 × $6.00 -
×
 Advanced Spread Trading with Guy Bower - MasterClass Trader
1 × $15.00
Advanced Spread Trading with Guy Bower - MasterClass Trader
1 × $15.00 -
×
 A Treasure House of Bayer. 32 Articles and Forecasts with George Bayer
1 × $6.00
A Treasure House of Bayer. 32 Articles and Forecasts with George Bayer
1 × $6.00 -
×
 Startup Trading Masterclass with Jack Gleason
1 × $93.00
Startup Trading Masterclass with Jack Gleason
1 × $93.00 -
×
 Trading Mastery Course 2009
1 × $6.00
Trading Mastery Course 2009
1 × $6.00 -
×
 High Powered Investing with Amine Bouchentouf
1 × $6.00
High Powered Investing with Amine Bouchentouf
1 × $6.00 -
×
 Options Trading & Ultimate MasterClass With Tyrone Abela - FX Evolution
1 × $54.00
Options Trading & Ultimate MasterClass With Tyrone Abela - FX Evolution
1 × $54.00 -
×
 Beginner's Guide to Ratio Butterflys Class with Don Kaufman
1 × $6.00
Beginner's Guide to Ratio Butterflys Class with Don Kaufman
1 × $6.00 -
×
 How to Pick Hot Reverse Merger Penny Stocks with John Lux
1 × $5.00
How to Pick Hot Reverse Merger Penny Stocks with John Lux
1 × $5.00 -
×
 Math Trading Course 2023
1 × $34.00
Math Trading Course 2023
1 × $34.00 -
×
 Street-Smart Chart Reading – Volume 2 – Digging Deeper with Donald G.Worden
1 × $6.00
Street-Smart Chart Reading – Volume 2 – Digging Deeper with Donald G.Worden
1 × $6.00 -
×
 The Best Option Trading Course with David Jaffee - Best Stock Strategy
1 × $15.00
The Best Option Trading Course with David Jaffee - Best Stock Strategy
1 × $15.00 -
×
 Seller Specialist Program with Chris Prefontaine
1 × $62.00
Seller Specialist Program with Chris Prefontaine
1 × $62.00 -
×
 The Prop Trading Code with Brannigan Barrett - Axia Futures
1 × $23.00
The Prop Trading Code with Brannigan Barrett - Axia Futures
1 × $23.00 -
×
 Handbook of Integral Equations with Andrei D.Polyanin, Alexander V.Manzhirov
1 × $6.00
Handbook of Integral Equations with Andrei D.Polyanin, Alexander V.Manzhirov
1 × $6.00 -
×
 Secret Forex Society Economic Reports (2006-2007) with Felix Homogratus
1 × $6.00
Secret Forex Society Economic Reports (2006-2007) with Felix Homogratus
1 × $6.00 -
×
 5 Day Volume Profile Analysis Indicator Course with Mark Stone
1 × $54.00
5 Day Volume Profile Analysis Indicator Course with Mark Stone
1 × $54.00 -
×
 Selective Forex Trading with Don Snellgrove
1 × $6.00
Selective Forex Trading with Don Snellgrove
1 × $6.00 -
×
 The 13-Week Cash Flow Model
1 × $15.00
The 13-Week Cash Flow Model
1 × $15.00 -
×
 High Probability Trading Using Elliott Wave And Fibonacci Analysis withVic Patel - Forex Training Group
1 × $10.00
High Probability Trading Using Elliott Wave And Fibonacci Analysis withVic Patel - Forex Training Group
1 × $10.00 -
×
 Slapped by the Invisible Hand: The Panic of 2007 with Gary Gorton
1 × $6.00
Slapped by the Invisible Hand: The Panic of 2007 with Gary Gorton
1 × $6.00 -
×
 Guidelines for Analysis and Establishing a Trading Plan with Charles Drummond
1 × $6.00
Guidelines for Analysis and Establishing a Trading Plan with Charles Drummond
1 × $6.00 -
×
 Natural Language Processing in Trading with Dr. Terry Benzschawel
1 × $31.00
Natural Language Processing in Trading with Dr. Terry Benzschawel
1 × $31.00 -
×
 The Complete Guide to Multiple Time Frame Analysis & Reading Price Action with Aiman Almansoori
1 × $13.00
The Complete Guide to Multiple Time Frame Analysis & Reading Price Action with Aiman Almansoori
1 × $13.00 -
×
 How To Read The Market Professionally with TradeSmart
1 × $27.00
How To Read The Market Professionally with TradeSmart
1 × $27.00 -
×
 Matrix Spread Options Trading Course with Base Camp Trading
1 × $31.00
Matrix Spread Options Trading Course with Base Camp Trading
1 × $31.00 -
×
 Pattern Recognition: A Fundamental Introduction to Japanese Candlestick Charting Techniques Class with Jeff Bierman
1 × $6.00
Pattern Recognition: A Fundamental Introduction to Japanese Candlestick Charting Techniques Class with Jeff Bierman
1 × $6.00 -
×
 Order flow self-study training program with iMFtracker
1 × $10.00
Order flow self-study training program with iMFtracker
1 × $10.00 -
×
 Street-Smart Chart Reading – Volume 1 – The Rudiments with Donald G.Worden
1 × $6.00
Street-Smart Chart Reading – Volume 1 – The Rudiments with Donald G.Worden
1 × $6.00 -
×
 Advanced Trading Course - Footprint Charts, Market Profile & TPO with Jayson Casper
1 × $31.00
Advanced Trading Course - Footprint Charts, Market Profile & TPO with Jayson Casper
1 × $31.00 -
×
 Planetary Harmonics of Speculative Markets with Larry Pesavento
1 × $6.00
Planetary Harmonics of Speculative Markets with Larry Pesavento
1 × $6.00 -
×
 The Indices Orderflow Masterclass with The Forex Scalpers
1 × $23.00
The Indices Orderflow Masterclass with The Forex Scalpers
1 × $23.00 -
×
 Deep Dive Butterfly Trading Strategy Class with SJG Trades
1 × $41.00
Deep Dive Butterfly Trading Strategy Class with SJG Trades
1 × $41.00 -
×
 Financial Fortress with TradeSmart University
1 × $6.00
Financial Fortress with TradeSmart University
1 × $6.00 -
×
 A Plan to make $3k Monthly on $25k with Short Term Trades with Dan Sheridan
1 × $23.00
A Plan to make $3k Monthly on $25k with Short Term Trades with Dan Sheridan
1 × $23.00 -
×
 A Grand Supercycle Top Webinar with Steven Hochberg
1 × $6.00
A Grand Supercycle Top Webinar with Steven Hochberg
1 × $6.00 -
×
 Profiting In Bull Or Bear Markets with George Dagnino
1 × $6.00
Profiting In Bull Or Bear Markets with George Dagnino
1 × $6.00 -
×
 The Q’s (2nd Ed.) with Darlene Nelson
1 × $6.00
The Q’s (2nd Ed.) with Darlene Nelson
1 × $6.00 -
×
 Crystal Ball Pack PLUS bonus Live Trade By Pat Mitchell - Trick Trades
1 × $20.00
Crystal Ball Pack PLUS bonus Live Trade By Pat Mitchell - Trick Trades
1 × $20.00 -
×
 Larry Connors Professional Day Trading for Success Program
1 × $62.00
Larry Connors Professional Day Trading for Success Program
1 × $62.00 -
×
 Quantitative Trading Strategies (1st Edition) with Lars Kestner
1 × $6.00
Quantitative Trading Strategies (1st Edition) with Lars Kestner
1 × $6.00 -
×
 How to Lose Money Profitably with Mark D.Cook
1 × $6.00
How to Lose Money Profitably with Mark D.Cook
1 × $6.00 -
×
 7 Days Options Masters Course with John Carter
1 × $54.00
7 Days Options Masters Course with John Carter
1 × $54.00 -
×
 The A14 Weekly Option Strategy Workshop with Amy Meissner
1 × $23.00
The A14 Weekly Option Strategy Workshop with Amy Meissner
1 × $23.00 -
×
 Forex Trading Course with Mike Norman
1 × $17.00
Forex Trading Course with Mike Norman
1 × $17.00 -
×
 Candlestick Charts with Clive Lambert
1 × $6.00
Candlestick Charts with Clive Lambert
1 × $6.00 -
×
 Cash Flow Investing Course
1 × $20.00
Cash Flow Investing Course
1 × $20.00 -
×
 Strategy Week: Using High Probability Options Strategies with Don Kaufman
1 × $6.00
Strategy Week: Using High Probability Options Strategies with Don Kaufman
1 × $6.00 -
×
 Seasonal Stock Market Trends: The Definitive Guide to Calendar‐Based Stock Market Trading with Jay Kaeppel
1 × $6.00
Seasonal Stock Market Trends: The Definitive Guide to Calendar‐Based Stock Market Trading with Jay Kaeppel
1 × $6.00 -
×
 Pocketing Premium Master Class (Basic) with Henrry Gambell
1 × $31.00
Pocketing Premium Master Class (Basic) with Henrry Gambell
1 × $31.00 -
×
 Best of the Best: Collars with Amy Meissner & Scott Ruble
1 × $15.00
Best of the Best: Collars with Amy Meissner & Scott Ruble
1 × $15.00
 with Arthur A.Hill")
Introduction to Candlestick (Article) with Arthur A.Hill
$6.00
File Size: Coming soon!
Delivery Time: 1–12 hours
Media Type: Online Course
Content Proof: Watch Here!
You may check content proof of “Introduction to Candlestick (Article) with Arthur A.Hill” below:
 with Arthur A.Hill")
Introduction to Candlestick (Article) with Arthur A. Hill
Candlestick charting is an essential tool for traders and investors, providing a visual representation of price movements. Arthur A. Hill, a renowned expert in technical analysis, offers a comprehensive introduction to candlestick charts, making them accessible to beginners and valuable for experienced traders. Let’s explore the basics of candlestick charting and how it can enhance your trading strategy.
What is a Candlestick Chart?
A candlestick chart is a type of financial chart used to describe price movements of a security, derivative, or currency.
Components of a Candlestick
- Body: The thick part of the candlestick, showing the opening and closing prices.
- Wicks/Shadows: The thin lines above and below the body, indicating the highest and lowest prices during the period.
- Color: Traditionally, a green or white body indicates a closing price higher than the opening price, while a red or black body indicates a closing price lower than the opening price.
History of Candlestick Charting
Candlestick charting originated in Japan over 300 years ago, developed by rice traders to track market prices and daily supply and demand.
Evolution of Candlestick Charts
Over the centuries, candlestick charting has evolved and gained popularity worldwide, becoming a staple in technical analysis.
Introduction to Western Markets
Candlestick charts were introduced to the Western financial markets in the late 20th century and quickly became popular among traders.
Advantages of Candlestick Charts
Candlestick charts offer several advantages over traditional bar charts and line charts.
Visual Clarity
Candlestick charts provide a clear and concise representation of price movements, making it easier to interpret market trends.
Immediate Insight
The color-coded bodies and wicks offer immediate insight into market sentiment and price direction.
Pattern Recognition
Candlestick charts are excellent for identifying patterns that can predict future price movements.
Common Candlestick Patterns
- Doji: Indicates indecision in the market.
- Hammer: Suggests a potential reversal from a downtrend.
- Engulfing: A strong signal of a potential trend reversal.
Basic Candlestick Patterns
Understanding basic candlestick patterns is crucial for any trader looking to use this charting method effectively.
Bullish Patterns
Bullish patterns indicate potential upward price movements.
Hammer and Inverted Hammer
- Hammer: A candlestick with a small body and a long lower wick, indicating potential reversal from a downtrend.
- Inverted Hammer: Similar to the hammer but with a long upper wick, suggesting a potential bullish reversal.
Bearish Patterns
Bearish patterns suggest potential downward price movements.
Shooting Star and Hanging Man
- Shooting Star: A candlestick with a small body and a long upper wick, indicating a potential reversal from an uptrend.
- Hanging Man: Similar to the hammer but occurs after an uptrend, signaling a potential bearish reversal.
Advanced Candlestick Patterns
For more experienced traders, advanced candlestick patterns provide deeper insights into market trends.
Engulfing Patterns
Engulfing patterns occur when a smaller candlestick is followed by a larger candlestick that completely engulfs the smaller one.
Bullish Engulfing
A bullish engulfing pattern occurs at the bottom of a downtrend and signals a potential upward reversal.
Bearish Engulfing
A bearish engulfing pattern appears at the top of an uptrend and suggests a potential downward reversal.
Morning Star and Evening Star
These patterns are three-candlestick formations that indicate strong trend reversals.
Morning Star
The morning star pattern consists of a bearish candle, a small indecisive candle, and a bullish candle, indicating a bullish reversal.
Evening Star
The evening star pattern includes a bullish candle, a small indecisive candle, and a bearish candle, suggesting a bearish reversal.
Incorporating Candlestick Charts into Your Trading Strategy
Candlestick charts are versatile and can be integrated into various trading strategies.
Combining with Other Indicators
Enhance the effectiveness of candlestick charts by combining them with other technical indicators.
Popular Indicators to Combine
- Moving Averages: Confirm trends and potential reversals.
- Relative Strength Index (RSI): Identify overbought or oversold conditions.
- Bollinger Bands: Measure market volatility and potential breakouts.
Setting Up Your Trading Platform
Most trading platforms offer candlestick charting options. Ensure you customize your charts to suit your trading style.
Customization Tips
- Time Frames: Choose appropriate time frames for your trading strategy.
- Color Schemes: Use distinct colors for bullish and bearish candles.
- Indicators: Add complementary indicators to your charts.
Common Mistakes to Avoid
Even with a robust understanding of candlestick charts, traders can make mistakes that affect their performance.
Over-reliance on Patterns
Relying solely on candlestick patterns without considering other factors can lead to false signals.
Diversify Analysis
Always use candlestick patterns in conjunction with other forms of analysis and market indicators.
Ignoring Market Context
Candlestick patterns can be misleading if not considered within the broader market context.
Comprehensive Analysis
Incorporate fundamental analysis and overall market trends to validate candlestick signals.
Conclusion
Candlestick charting, as introduced by Arthur A. Hill, offers a powerful tool for traders to understand and predict market movements. By mastering basic and advanced patterns, combining them with other technical indicators, and avoiding common pitfalls, traders can enhance their market analysis and trading performance. Whether you’re new to trading or an experienced trader, candlestick charts provide valuable insights that can guide your investment decisions.
Frequently Asked Questions:
- What is a candlestick chart?
A candlestick chart is a type of financial chart used to represent price movements over a specific period, showing the opening, closing, high, and low prices. - Why are candlestick charts popular among traders?
They provide visual clarity and help in identifying patterns that can predict future price movements. - What are some basic candlestick patterns?
Basic patterns include the hammer, inverted hammer, shooting star, and hanging man, which indicate potential market reversals. - Can candlestick charts be used with other technical indicators?
Yes, combining candlestick charts with indicators like moving averages, RSI, and Bollinger Bands enhances their effectiveness. - How can I avoid common mistakes when using candlestick charts?
Avoid over-relying on patterns and always consider the broader market context and other forms of analysis.
Be the first to review “Introduction to Candlestick (Article) with Arthur A.Hill”
You must be logged in to post a review.
Related products
Forex Trading
Original price was: $2,000.00.$23.00Current price is: $23.00.
Original price was: $999.00.$5.00Current price is: $5.00.

Original price was: $997.00.$13.00Current price is: $13.00.

Forex Trading
Original price was: $125.00.$17.00Current price is: $17.00.

Forex Trading
Quantamentals – The Next Great Forefront Of Trading and Investing with Trading Markets
Original price was: $1,495.00.$8.00Current price is: $8.00.

Forex Trading
Original price was: $500.00.$5.00Current price is: $5.00.
Original price was: $497.00.$31.00Current price is: $31.00.
Forex Trading
Original price was: $697.00.$5.00Current price is: $5.00.

Forex Trading
Original price was: $850.00.$23.00Current price is: $23.00.
Original price was: $895.00.$15.00Current price is: $15.00.

Original price was: $700.00.$39.00Current price is: $39.00.

Forex Trading
Original price was: $499.00.$15.00Current price is: $15.00.

Original price was: $997.00.$8.00Current price is: $8.00.
Original price was: $1,800.00.$54.00Current price is: $54.00.
Original price was: $799.00.$15.00Current price is: $15.00.

Forex Trading
Original price was: $2,997.00.$23.00Current price is: $23.00.
Original price was: $1,200.00.$23.00Current price is: $23.00.
Original price was: $197.00.$5.00Current price is: $5.00.
Original price was: $310.00.$23.00Current price is: $23.00.
Original price was: $2,120.00.$15.00Current price is: $15.00.

Reviews
There are no reviews yet.