-
×
 Advanced Spread Trading with Guy Bower - MasterClass Trader
1 × $15.00
Advanced Spread Trading with Guy Bower - MasterClass Trader
1 × $15.00 -
×
 The Naked Eye: Raw Data Analytics with Edgar Torres - Raw Data Analytics
1 × $8.00
The Naked Eye: Raw Data Analytics with Edgar Torres - Raw Data Analytics
1 × $8.00 -
×
 The Orderflows Trade Opportunities Encyclopedia with Michael Valtos
1 × $8.00
The Orderflows Trade Opportunities Encyclopedia with Michael Valtos
1 × $8.00 -
×
 The Complete Guide to Multiple Time Frame Analysis & Reading Price Action with Aiman Almansoori
1 × $13.00
The Complete Guide to Multiple Time Frame Analysis & Reading Price Action with Aiman Almansoori
1 × $13.00 -
×
 The Best Option Trading Course with David Jaffee - Best Stock Strategy
1 × $15.00
The Best Option Trading Course with David Jaffee - Best Stock Strategy
1 × $15.00 -
×
 Options Trading & Ultimate MasterClass With Tyrone Abela - FX Evolution
1 × $54.00
Options Trading & Ultimate MasterClass With Tyrone Abela - FX Evolution
1 × $54.00 -
×
 The Trading Blueprint with Brad Goh - The Trading Geek
1 × $5.00
The Trading Blueprint with Brad Goh - The Trading Geek
1 × $5.00 -
×
 Algo Trading Masterclass with Ali Casey - StatOasis
1 × $23.00
Algo Trading Masterclass with Ali Casey - StatOasis
1 × $23.00 -
×
 Essentials in Quantitative Trading QT01 By HangukQuant's
1 × $23.00
Essentials in Quantitative Trading QT01 By HangukQuant's
1 × $23.00 -
×
 TradeCraft: Your Path to Peak Performance Trading By Adam Grimes
1 × $15.00
TradeCraft: Your Path to Peak Performance Trading By Adam Grimes
1 × $15.00 -
×
 $20 – 52k 20 pips a day challange with Rafał Zuchowicz - TopMasterTrader
1 × $5.00
$20 – 52k 20 pips a day challange with Rafał Zuchowicz - TopMasterTrader
1 × $5.00 -
×
 The Indices Orderflow Masterclass with The Forex Scalpers
1 × $23.00
The Indices Orderflow Masterclass with The Forex Scalpers
1 × $23.00 -
×
 8 Year Presidential Election Pattern (Article) with Adam White
1 × $6.00
8 Year Presidential Election Pattern (Article) with Adam White
1 × $6.00 -
×
 Simple Smart Forex Renko Program with Nikos Mermigas
1 × $10.00
Simple Smart Forex Renko Program with Nikos Mermigas
1 × $10.00 -
×
 How To Read The Market Professionally with TradeSmart
1 × $27.00
How To Read The Market Professionally with TradeSmart
1 × $27.00 -
×
 Emini, Forex, Stock Course COMPLETE Series Recorded Seminar 2009 - 49 Modules in 3 DVDs (SpecialistTrading.com)
1 × $78.00
Emini, Forex, Stock Course COMPLETE Series Recorded Seminar 2009 - 49 Modules in 3 DVDs (SpecialistTrading.com)
1 × $78.00 -
×
 AI For Traders with Trading Markets
1 × $31.00
AI For Traders with Trading Markets
1 × $31.00 -
×
 Foundations of Forex Trading with TradeSmart University
1 × $6.00
Foundations of Forex Trading with TradeSmart University
1 × $6.00 -
×
 White Phoenix’s The Smart (Money) Approach to Trading with Jayson Casper
1 × $39.00
White Phoenix’s The Smart (Money) Approach to Trading with Jayson Casper
1 × $39.00 -
×
 Best of the Best: Collars with Amy Meissner & Scott Ruble
1 × $15.00
Best of the Best: Collars with Amy Meissner & Scott Ruble
1 × $15.00 -
×
 Matrix Spread Options Trading Course with Base Camp Trading
1 × $31.00
Matrix Spread Options Trading Course with Base Camp Trading
1 × $31.00 -
×
 0 DTE Options Trading Workshop with Aeromir Corporation
1 × $15.00
0 DTE Options Trading Workshop with Aeromir Corporation
1 × $15.00 -
×
 Quantamentals - The Next Great Forefront Of Trading and Investing with Trading Markets
1 × $8.00
Quantamentals - The Next Great Forefront Of Trading and Investing with Trading Markets
1 × $8.00 -
×
 Smart Money Trading Course with Prosperity Academy
1 × $5.00
Smart Money Trading Course with Prosperity Academy
1 × $5.00 -
×
 Sacredscience - Sepharial Arcana – Rubber
1 × $6.00
Sacredscience - Sepharial Arcana – Rubber
1 × $6.00 -
×
 The Candlestick Training Series with Timon Weller
1 × $6.00
The Candlestick Training Series with Timon Weller
1 × $6.00 -
×
 TRADING NFX Course with Andrew NFX
1 × $5.00
TRADING NFX Course with Andrew NFX
1 × $5.00 -
×
 Sacredscience - Edward Johndro – Collected Articles
1 × $6.00
Sacredscience - Edward Johndro – Collected Articles
1 × $6.00 -
×
 ENG Renko Mastery with International Scalpers
1 × $10.00
ENG Renko Mastery with International Scalpers
1 × $10.00 -
×
 Order flow self-study training program with iMFtracker
1 × $10.00
Order flow self-study training program with iMFtracker
1 × $10.00 -
×
 Swift Trader, Perfecting the Art of DayTrading with Charles Kim
1 × $6.00
Swift Trader, Perfecting the Art of DayTrading with Charles Kim
1 × $6.00 -
×
 The Complete Guide to Market Breadth Indicators: How to Analyze and Evaluate market Direction and Strength - Greg Morris
1 × $6.00
The Complete Guide to Market Breadth Indicators: How to Analyze and Evaluate market Direction and Strength - Greg Morris
1 × $6.00 -
×
 Forecast 2024 Clarification with Larry Williams
1 × $15.00
Forecast 2024 Clarification with Larry Williams
1 × $15.00 -
×
 FasTrack Premium with Note Conference
1 × $78.00
FasTrack Premium with Note Conference
1 × $78.00 -
×
 Advanced Trading Course with Edney Pinheiro
1 × $5.00
Advanced Trading Course with Edney Pinheiro
1 × $5.00 -
×
 Fibonacci Mastery Course: Complete Guide to Trading with Fib By Todd Gordon
1 × $62.00
Fibonacci Mastery Course: Complete Guide to Trading with Fib By Todd Gordon
1 × $62.00 -
×
 3-Day Day Trading Seminar Online CD with John Carter & Hubert Senters
1 × $6.00
3-Day Day Trading Seminar Online CD with John Carter & Hubert Senters
1 × $6.00 -
×
 FXStreet Unrecorded Webinars Sept & Oct, 2011 with Sam Seiden
1 × $6.00
FXStreet Unrecorded Webinars Sept & Oct, 2011 with Sam Seiden
1 × $6.00 -
×
 3_8’s to Wealth (Audio 84 MB+ WorkBooks) with Darlene Nelson
1 × $6.00
3_8’s to Wealth (Audio 84 MB+ WorkBooks) with Darlene Nelson
1 × $6.00 -
×
 SQX Mentorship with Tip Toe Hippo
1 × $23.00
SQX Mentorship with Tip Toe Hippo
1 × $23.00 -
×
 T3 Live - The Simple Art of Trading
1 × $31.00
T3 Live - The Simple Art of Trading
1 × $31.00 -
×
 The Prop Trading Code with Brannigan Barrett - Axia Futures
1 × $23.00
The Prop Trading Code with Brannigan Barrett - Axia Futures
1 × $23.00 -
×
 Renko Profits Accelerator
1 × $15.00
Renko Profits Accelerator
1 × $15.00 -
×
 WondaFX Signature Strategy with WondaFX
1 × $5.00
WondaFX Signature Strategy with WondaFX
1 × $5.00 -
×
 A Really Friendly Guide to Wavelets with C.Vallens
1 × $6.00
A Really Friendly Guide to Wavelets with C.Vallens
1 × $6.00 -
×
 Art & Science of Trend Trading Class with Jeff Bierman
1 × $6.00
Art & Science of Trend Trading Class with Jeff Bierman
1 × $6.00 -
×
 High Powered Investing with Amine Bouchentouf
1 × $6.00
High Powered Investing with Amine Bouchentouf
1 × $6.00 -
×
 All About Dividend Investing with Don Schreiber & Gary Stroik
1 × $6.00
All About Dividend Investing with Don Schreiber & Gary Stroik
1 × $6.00 -
×
 Technical Analysis for Long-Term Investors with Clay Allen
1 × $6.00
Technical Analysis for Long-Term Investors with Clay Allen
1 × $6.00 -
×
 The A to Z of Mathematics: A Basic Guide with Thomas Sidebotham
1 × $6.00
The A to Z of Mathematics: A Basic Guide with Thomas Sidebotham
1 × $6.00 -
×
 A Course in Trading with Donald Mack & Wetsel Market Bureau
1 × $6.00
A Course in Trading with Donald Mack & Wetsel Market Bureau
1 × $6.00 -
×
 Traders Winning Edge (Presentation) with Adrienne Laris Toghraie
1 × $6.00
Traders Winning Edge (Presentation) with Adrienne Laris Toghraie
1 × $6.00 -
×
 Scalp Strategy and Flipping Small Accounts with Opes Trading Group
1 × $5.00
Scalp Strategy and Flipping Small Accounts with Opes Trading Group
1 × $5.00 -
×
 Advanced Trading Course - Footprint Charts, Market Profile & TPO with Jayson Casper
1 × $31.00
Advanced Trading Course - Footprint Charts, Market Profile & TPO with Jayson Casper
1 × $31.00 -
×
 Cash In On Chaos with Hans Hannula
1 × $6.00
Cash In On Chaos with Hans Hannula
1 × $6.00 -
×
 The Art And Science Of Trading with Adam Grimes
1 × $6.00
The Art And Science Of Trading with Adam Grimes
1 × $6.00 -
×
 Futures Spread Trading Intro Course with Thetradingframework
1 × $6.00
Futures Spread Trading Intro Course with Thetradingframework
1 × $6.00 -
×
 5-Day Master Trader Program 2022 with Mark Minervini
1 × $31.00
5-Day Master Trader Program 2022 with Mark Minervini
1 × $31.00 -
×
 Small Account Options Trading Workshop Package with Doc Severson
1 × $6.00
Small Account Options Trading Workshop Package with Doc Severson
1 × $6.00 -
×
 The 80% Solution S&P Systems with Bruce Babcock
1 × $6.00
The 80% Solution S&P Systems with Bruce Babcock
1 × $6.00 -
×
 Forex Secrets Exposed
1 × $15.00
Forex Secrets Exposed
1 × $15.00 -
×
 The Orderflow Masterclass with PrimeTrading
1 × $17.00
The Orderflow Masterclass with PrimeTrading
1 × $17.00 -
×
 Short-Term Trading with Precision Timing - Jack Bernstein
1 × $6.00
Short-Term Trading with Precision Timing - Jack Bernstein
1 × $6.00 -
×
 Cecil Robles Advent Forex Course & Indicators with Adventforex
1 × $6.00
Cecil Robles Advent Forex Course & Indicators with Adventforex
1 × $6.00 -
×
 Peter Borish Online Trader Program
1 × $15.00
Peter Borish Online Trader Program
1 × $15.00 -
×
 30 Day Masterclass with Joe Elite Trader Hub ICT
1 × $6.00
30 Day Masterclass with Joe Elite Trader Hub ICT
1 × $6.00 -
×
 Smart Money Concepts with JordyBanks
1 × $6.00
Smart Money Concepts with JordyBanks
1 × $6.00 -
×
 Adx Mastery Complete Course
1 × $6.00
Adx Mastery Complete Course
1 × $6.00 -
×
 Professor Jeff Bierman's 15 Class Bundle (The Professor's Package)
1 × $6.00
Professor Jeff Bierman's 15 Class Bundle (The Professor's Package)
1 × $6.00 -
×
 Volatility Trading with Fractal Flow Pro
1 × $15.00
Volatility Trading with Fractal Flow Pro
1 × $15.00 -
×
 All About Stock Market Strategies: The Easy Way To Get Started (All About Series) with David Brown
1 × $6.00
All About Stock Market Strategies: The Easy Way To Get Started (All About Series) with David Brown
1 × $6.00 -
×
 How Do You Read Charts? A Guide to Classic Price Pattern Recognition Class with Professor Jeff Bierman
1 × $6.00
How Do You Read Charts? A Guide to Classic Price Pattern Recognition Class with Professor Jeff Bierman
1 × $6.00 -
×
 Forecasting Profits Using Price & Time with Ed Gately
1 × $6.00
Forecasting Profits Using Price & Time with Ed Gately
1 × $6.00 -
×
 Stock Market Rules (3rd Ed.) with Michael Sheimo
1 × $6.00
Stock Market Rules (3rd Ed.) with Michael Sheimo
1 × $6.00 -
×
 Advanced Option Trading with Broken Wing Butterflys with Greg Loehr
1 × $9.00
Advanced Option Trading with Broken Wing Butterflys with Greg Loehr
1 × $9.00 -
×
 Investor’s Guide to Charting By Alistair Blair
1 × $6.00
Investor’s Guide to Charting By Alistair Blair
1 × $6.00 -
×
 RiskDoctor RD1 – Introduction to Options Trading the RiskDoctor Way with Charles Cottle
1 × $6.00
RiskDoctor RD1 – Introduction to Options Trading the RiskDoctor Way with Charles Cottle
1 × $6.00 -
×
 Trading Masterclass XVII with Wysetrade
1 × $6.00
Trading Masterclass XVII with Wysetrade
1 × $6.00 -
×
 HST Mobile
1 × $31.00
HST Mobile
1 × $31.00 -
×
 How Do You See Risk? A Guide to Evaluating & Applying Technical Volatility Indicators class with Theotrade
1 × $4.00
How Do You See Risk? A Guide to Evaluating & Applying Technical Volatility Indicators class with Theotrade
1 × $4.00 -
×
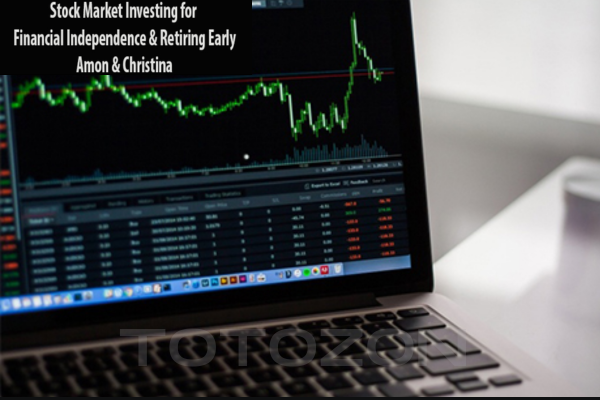 Stock Market Investing for Financial Independence & Retiring Early with Amon & Christina
1 × $15.00
Stock Market Investing for Financial Independence & Retiring Early with Amon & Christina
1 × $15.00 -
×
 Butterfly and Condor Workshop with Aeromir
1 × $15.00
Butterfly and Condor Workshop with Aeromir
1 × $15.00 -
×
 How to Trade Diagonal Triangles. Superior Risk Reward Trade Setups
1 × $6.00
How to Trade Diagonal Triangles. Superior Risk Reward Trade Setups
1 × $6.00 -
×
 Jason Bond Dvds for Traders (all 4 programs)
1 × $6.00
Jason Bond Dvds for Traders (all 4 programs)
1 × $6.00 -
×
 How I Turned 500 USD to 6 Figures in 2 months Trading Options with The Money Printers
1 × $8.00
How I Turned 500 USD to 6 Figures in 2 months Trading Options with The Money Printers
1 × $8.00 -
×
 The Amazing Common Sense Guide To Investment Success with John Thomchick
1 × $6.00
The Amazing Common Sense Guide To Investment Success with John Thomchick
1 × $6.00 -
×
 Advanced Strategies in Forex Trading with Don Schellenberg
1 × $6.00
Advanced Strategies in Forex Trading with Don Schellenberg
1 × $6.00 -
×
 Home Run Options Trading Course with Dave Aquino - Base Camp Trading
1 × $11.00
Home Run Options Trading Course with Dave Aquino - Base Camp Trading
1 × $11.00
 with Arthur A.Hill")
Introduction to Candlestick (Article) with Arthur A.Hill
$6.00
File Size: Coming soon!
Delivery Time: 1–12 hours
Media Type: Online Course
Content Proof: Watch Here!
You may check content proof of “Introduction to Candlestick (Article) with Arthur A.Hill” below:
 with Arthur A.Hill")
Introduction to Candlestick (Article) with Arthur A. Hill
Candlestick charting is an essential tool for traders and investors, providing a visual representation of price movements. Arthur A. Hill, a renowned expert in technical analysis, offers a comprehensive introduction to candlestick charts, making them accessible to beginners and valuable for experienced traders. Let’s explore the basics of candlestick charting and how it can enhance your trading strategy.
What is a Candlestick Chart?
A candlestick chart is a type of financial chart used to describe price movements of a security, derivative, or currency.
Components of a Candlestick
- Body: The thick part of the candlestick, showing the opening and closing prices.
- Wicks/Shadows: The thin lines above and below the body, indicating the highest and lowest prices during the period.
- Color: Traditionally, a green or white body indicates a closing price higher than the opening price, while a red or black body indicates a closing price lower than the opening price.
History of Candlestick Charting
Candlestick charting originated in Japan over 300 years ago, developed by rice traders to track market prices and daily supply and demand.
Evolution of Candlestick Charts
Over the centuries, candlestick charting has evolved and gained popularity worldwide, becoming a staple in technical analysis.
Introduction to Western Markets
Candlestick charts were introduced to the Western financial markets in the late 20th century and quickly became popular among traders.
Advantages of Candlestick Charts
Candlestick charts offer several advantages over traditional bar charts and line charts.
Visual Clarity
Candlestick charts provide a clear and concise representation of price movements, making it easier to interpret market trends.
Immediate Insight
The color-coded bodies and wicks offer immediate insight into market sentiment and price direction.
Pattern Recognition
Candlestick charts are excellent for identifying patterns that can predict future price movements.
Common Candlestick Patterns
- Doji: Indicates indecision in the market.
- Hammer: Suggests a potential reversal from a downtrend.
- Engulfing: A strong signal of a potential trend reversal.
Basic Candlestick Patterns
Understanding basic candlestick patterns is crucial for any trader looking to use this charting method effectively.
Bullish Patterns
Bullish patterns indicate potential upward price movements.
Hammer and Inverted Hammer
- Hammer: A candlestick with a small body and a long lower wick, indicating potential reversal from a downtrend.
- Inverted Hammer: Similar to the hammer but with a long upper wick, suggesting a potential bullish reversal.
Bearish Patterns
Bearish patterns suggest potential downward price movements.
Shooting Star and Hanging Man
- Shooting Star: A candlestick with a small body and a long upper wick, indicating a potential reversal from an uptrend.
- Hanging Man: Similar to the hammer but occurs after an uptrend, signaling a potential bearish reversal.
Advanced Candlestick Patterns
For more experienced traders, advanced candlestick patterns provide deeper insights into market trends.
Engulfing Patterns
Engulfing patterns occur when a smaller candlestick is followed by a larger candlestick that completely engulfs the smaller one.
Bullish Engulfing
A bullish engulfing pattern occurs at the bottom of a downtrend and signals a potential upward reversal.
Bearish Engulfing
A bearish engulfing pattern appears at the top of an uptrend and suggests a potential downward reversal.
Morning Star and Evening Star
These patterns are three-candlestick formations that indicate strong trend reversals.
Morning Star
The morning star pattern consists of a bearish candle, a small indecisive candle, and a bullish candle, indicating a bullish reversal.
Evening Star
The evening star pattern includes a bullish candle, a small indecisive candle, and a bearish candle, suggesting a bearish reversal.
Incorporating Candlestick Charts into Your Trading Strategy
Candlestick charts are versatile and can be integrated into various trading strategies.
Combining with Other Indicators
Enhance the effectiveness of candlestick charts by combining them with other technical indicators.
Popular Indicators to Combine
- Moving Averages: Confirm trends and potential reversals.
- Relative Strength Index (RSI): Identify overbought or oversold conditions.
- Bollinger Bands: Measure market volatility and potential breakouts.
Setting Up Your Trading Platform
Most trading platforms offer candlestick charting options. Ensure you customize your charts to suit your trading style.
Customization Tips
- Time Frames: Choose appropriate time frames for your trading strategy.
- Color Schemes: Use distinct colors for bullish and bearish candles.
- Indicators: Add complementary indicators to your charts.
Common Mistakes to Avoid
Even with a robust understanding of candlestick charts, traders can make mistakes that affect their performance.
Over-reliance on Patterns
Relying solely on candlestick patterns without considering other factors can lead to false signals.
Diversify Analysis
Always use candlestick patterns in conjunction with other forms of analysis and market indicators.
Ignoring Market Context
Candlestick patterns can be misleading if not considered within the broader market context.
Comprehensive Analysis
Incorporate fundamental analysis and overall market trends to validate candlestick signals.
Conclusion
Candlestick charting, as introduced by Arthur A. Hill, offers a powerful tool for traders to understand and predict market movements. By mastering basic and advanced patterns, combining them with other technical indicators, and avoiding common pitfalls, traders can enhance their market analysis and trading performance. Whether you’re new to trading or an experienced trader, candlestick charts provide valuable insights that can guide your investment decisions.
Frequently Asked Questions:
- What is a candlestick chart?
A candlestick chart is a type of financial chart used to represent price movements over a specific period, showing the opening, closing, high, and low prices. - Why are candlestick charts popular among traders?
They provide visual clarity and help in identifying patterns that can predict future price movements. - What are some basic candlestick patterns?
Basic patterns include the hammer, inverted hammer, shooting star, and hanging man, which indicate potential market reversals. - Can candlestick charts be used with other technical indicators?
Yes, combining candlestick charts with indicators like moving averages, RSI, and Bollinger Bands enhances their effectiveness. - How can I avoid common mistakes when using candlestick charts?
Avoid over-relying on patterns and always consider the broader market context and other forms of analysis.
Be the first to review “Introduction to Candlestick (Article) with Arthur A.Hill”
You must be logged in to post a review.
Related products
Forex Trading
Original price was: $4,997.00.$27.00Current price is: $27.00.
Original price was: $1,200.00.$23.00Current price is: $23.00.
Forex Trading
Original price was: $2,997.00.$23.00Current price is: $23.00.
Original price was: $4,995.00.$15.00Current price is: $15.00.
Original price was: $450.00.$23.00Current price is: $23.00.
Forex Trading
Original price was: $850.00.$23.00Current price is: $23.00.
Original price was: $299.00.$8.00Current price is: $8.00.
Original price was: $1,849.00.$15.00Current price is: $15.00.
Original price was: $497.00.$11.00Current price is: $11.00.
Forex Trading
The Complete Guide to Multiple Time Frame Analysis & Reading Price Action with Aiman Almansoori
Original price was: $1,399.00.$13.00Current price is: $13.00.
Original price was: $895.00.$15.00Current price is: $15.00.
Forex Trading
Original price was: $249.00.$15.00Current price is: $15.00.

Forex Trading
Original price was: $499.00.$15.00Current price is: $15.00.

Original price was: $649.00.$20.00Current price is: $20.00.
Forex Trading
Original price was: $697.00.$5.00Current price is: $5.00.
Forex Trading
Original price was: $2,995.00.$31.00Current price is: $31.00.
Forex Trading
Original price was: $125.00.$17.00Current price is: $17.00.

Forex Trading
Original price was: $397.00.$31.00Current price is: $31.00.
Forex Trading
Original price was: $2,000.00.$23.00Current price is: $23.00.
Original price was: $497.00.$31.00Current price is: $31.00.

Reviews
There are no reviews yet.