-
×
 Ultimate Trading Course with Dodgy's Dungeon
1 × $8.00
Ultimate Trading Course with Dodgy's Dungeon
1 × $8.00 -
×
 ePass Platinum
1 × $31.00
ePass Platinum
1 × $31.00 -
×
 The Orderflow Masterclass with PrimeTrading
1 × $17.00
The Orderflow Masterclass with PrimeTrading
1 × $17.00 -
×
 The Naked Eye: Raw Data Analytics with Edgar Torres - Raw Data Analytics
1 × $8.00
The Naked Eye: Raw Data Analytics with Edgar Torres - Raw Data Analytics
1 × $8.00 -
×
 Active Beta Indexes with Khalid Ghayur
1 × $6.00
Active Beta Indexes with Khalid Ghayur
1 × $6.00 -
×
 Starter Guide to Investing Stocks, Crypto & Precious Metals with Ryan Hogue
1 × $5.00
Starter Guide to Investing Stocks, Crypto & Precious Metals with Ryan Hogue
1 × $5.00 -
×
 High Probability ETF Trading: 7 Professional Strategies To Improve Your ETF Trading with Larry Connors
1 × $6.00
High Probability ETF Trading: 7 Professional Strategies To Improve Your ETF Trading with Larry Connors
1 × $6.00 -
×
 A Complete Course in Option Trading Fundamentals with Joseph Frey
1 × $6.00
A Complete Course in Option Trading Fundamentals with Joseph Frey
1 × $6.00 -
×
 All About Bonds, Bond Mutual Funds & Bond ETFs (3rd Ed.) with Esme Faerber
1 × $6.00
All About Bonds, Bond Mutual Funds & Bond ETFs (3rd Ed.) with Esme Faerber
1 × $6.00 -
×
 Futures 101: An Introduction to Futures Contracts Class with Don Kaufman
1 × $6.00
Futures 101: An Introduction to Futures Contracts Class with Don Kaufman
1 × $6.00 -
×
 The Prop Trading Code with Brannigan Barrett - Axia Futures
1 × $23.00
The Prop Trading Code with Brannigan Barrett - Axia Futures
1 × $23.00 -
×
 Options Trading & Ultimate MasterClass With Tyrone Abela - FX Evolution
1 × $54.00
Options Trading & Ultimate MasterClass With Tyrone Abela - FX Evolution
1 × $54.00 -
×
 Investing with Exchange Traded Funds Made Easy with Marvin Appel
1 × $6.00
Investing with Exchange Traded Funds Made Easy with Marvin Appel
1 × $6.00 -
×
 Profit Generating System with Brian Williams
1 × $6.00
Profit Generating System with Brian Williams
1 × $6.00 -
×
 Options 201: Vertical and Calendar Spread Essentials 5 Part Class with Don Kaufman On Demand Replay
1 × $6.00
Options 201: Vertical and Calendar Spread Essentials 5 Part Class with Don Kaufman On Demand Replay
1 × $6.00 -
×
 AI For Traders with Trading Markets
1 × $31.00
AI For Traders with Trading Markets
1 × $31.00 -
×
 The Precision Profit Float Indicator (TS Code & Setups) with Steve Woods
1 × $6.00
The Precision Profit Float Indicator (TS Code & Setups) with Steve Woods
1 × $6.00 -
×
 0 DTE Options Trading Workshop with Aeromir Corporation
1 × $15.00
0 DTE Options Trading Workshop with Aeromir Corporation
1 × $15.00 -
×
 Best of the Best: Collars with Amy Meissner & Scott Ruble
1 × $15.00
Best of the Best: Collars with Amy Meissner & Scott Ruble
1 × $15.00 -
×
 Path to Profits By Scott Redler - T3 Live
1 × $6.00
Path to Profits By Scott Redler - T3 Live
1 × $6.00 -
×
 Computational Financial Mathematics with Mathematica
1 × $6.00
Computational Financial Mathematics with Mathematica
1 × $6.00 -
×
 How To Buy with Justin Mamis
1 × $6.00
How To Buy with Justin Mamis
1 × $6.00 -
×
 Matrix Spread Options Trading Course with Base Camp Trading
1 × $31.00
Matrix Spread Options Trading Course with Base Camp Trading
1 × $31.00 -
×
 Essentials in Quantitative Trading QT01 By HangukQuant's
1 × $23.00
Essentials in Quantitative Trading QT01 By HangukQuant's
1 × $23.00 -
×
 Simpler Options - Weekly Butterflies for Income
1 × $6.00
Simpler Options - Weekly Butterflies for Income
1 × $6.00 -
×
 Home Run Options Trading Course with Dave Aquino - Base Camp Trading
1 × $11.00
Home Run Options Trading Course with Dave Aquino - Base Camp Trading
1 × $11.00 -
×
 How to Analyze Multifamily Investment Opportunities with Symon He & Brandon Young
1 × $6.00
How to Analyze Multifamily Investment Opportunities with Symon He & Brandon Young
1 × $6.00 -
×
 Harnessing Explosive Market Turns - 3 DVD with Jeff Greenblatt
1 × $6.00
Harnessing Explosive Market Turns - 3 DVD with Jeff Greenblatt
1 × $6.00 -
×
 Selling Options For A Living Class with Don Kaufman
1 × $6.00
Selling Options For A Living Class with Don Kaufman
1 × $6.00 -
×
 5 Basic Elliott Wave Patterns + Technical Tools = Trading Success with Jeffrey Kennedy
1 × $15.00
5 Basic Elliott Wave Patterns + Technical Tools = Trading Success with Jeffrey Kennedy
1 × $15.00 -
×
 Simpler Traders - Ultimate Guide to Debit Spreads (PREMIUM)
1 × $39.00
Simpler Traders - Ultimate Guide to Debit Spreads (PREMIUM)
1 × $39.00 -
×
 Secrets of Investors on WallStreet (Audio) with Ken Fisher
1 × $6.00
Secrets of Investors on WallStreet (Audio) with Ken Fisher
1 × $6.00 -
×
 Forecast 2024 Clarification with Larry Williams
1 × $15.00
Forecast 2024 Clarification with Larry Williams
1 × $15.00 -
×
 TRADING NFX Course with Andrew NFX
1 × $5.00
TRADING NFX Course with Andrew NFX
1 × $5.00 -
×
 Options Education FULL Course 30+ Hours with Macrohedged
1 × $23.00
Options Education FULL Course 30+ Hours with Macrohedged
1 × $23.00 -
×
 Beginners Guide to Swing Trading Growth Stocks with Brandon Chapman
1 × $5.00
Beginners Guide to Swing Trading Growth Stocks with Brandon Chapman
1 × $5.00 -
×
 The Trading Blueprint with Brad Goh - The Trading Geek
1 × $5.00
The Trading Blueprint with Brad Goh - The Trading Geek
1 × $5.00 -
×
 Professional Chart Reading Bootcamp - 2 CDs
1 × $6.00
Professional Chart Reading Bootcamp - 2 CDs
1 × $6.00 -
×
 A Course in Trading with Donald Mack & Wetsel Market Bureau
1 × $6.00
A Course in Trading with Donald Mack & Wetsel Market Bureau
1 × $6.00 -
×
 Active Investment Management: Finding and Harnessing Investment Skill with Charles Jackson
1 × $6.00
Active Investment Management: Finding and Harnessing Investment Skill with Charles Jackson
1 × $6.00 -
×
 How to Find the Most Profitable Stocks with Mubarak Shah
1 × $6.00
How to Find the Most Profitable Stocks with Mubarak Shah
1 × $6.00 -
×
 Neural Networks in the Capital Markets with Apostolos Paul Refenes
1 × $6.00
Neural Networks in the Capital Markets with Apostolos Paul Refenes
1 × $6.00 -
×
 The Systematic Trader: Maximizing Trading Systems and Money Management with David Stendahl & John Boyer
1 × $6.00
The Systematic Trader: Maximizing Trading Systems and Money Management with David Stendahl & John Boyer
1 × $6.00 -
×
 The Practical Fractal with Bill Williams
1 × $6.00
The Practical Fractal with Bill Williams
1 × $6.00 -
×
 Fast Start Barter System with Bob Meyer
1 × $31.00
Fast Start Barter System with Bob Meyer
1 × $31.00 -
×
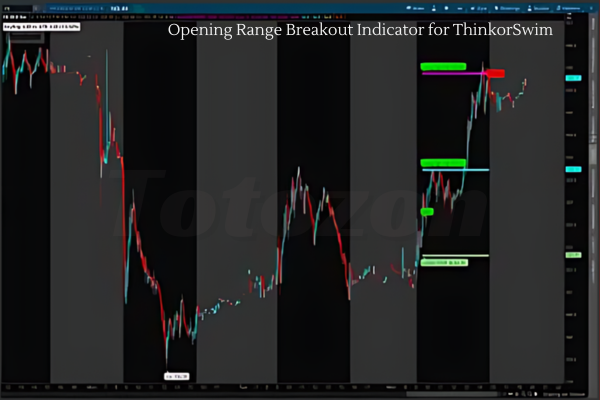 Opening Range Breakout Indicator for ThinkorSwim
1 × $6.00
Opening Range Breakout Indicator for ThinkorSwim
1 × $6.00 -
×
 Bond Market Course with The Macro Compass
1 × $15.00
Bond Market Course with The Macro Compass
1 × $15.00 -
×
 Simple Cyclical Analysis with Stan Erlich
1 × $6.00
Simple Cyclical Analysis with Stan Erlich
1 × $6.00 -
×
 Risk Stop Loss and Position Size with Daryl Guppy
1 × $6.00
Risk Stop Loss and Position Size with Daryl Guppy
1 × $6.00 -
×
 Candlestick Secrets For Profiting In Options
1 × $23.00
Candlestick Secrets For Profiting In Options
1 × $23.00 -
×
 Electronic Day Traders' Secrets: Learn From the Best of the Best DayTraders with Burton Friedfertig
1 × $6.00
Electronic Day Traders' Secrets: Learn From the Best of the Best DayTraders with Burton Friedfertig
1 × $6.00 -
×
 Mind & Markets. An Advanced Study Course of Stock Market Education (1951) with Bert Larson
1 × $6.00
Mind & Markets. An Advanced Study Course of Stock Market Education (1951) with Bert Larson
1 × $6.00 -
×
 Investment Fables with Aswath Damodaran
1 × $6.00
Investment Fables with Aswath Damodaran
1 × $6.00 -
×
 AG Trading Journal with Ace Gazette
1 × $6.00
AG Trading Journal with Ace Gazette
1 × $6.00 -
×
 Market Structure Matters with Haim Bodek
1 × $62.00
Market Structure Matters with Haim Bodek
1 × $62.00 -
×
 Compound Stock Earnings Advanced Charting (Video 1.19 GB)
1 × $15.00
Compound Stock Earnings Advanced Charting (Video 1.19 GB)
1 × $15.00 -
×
 Advanced Iron Condor Course in 2021
1 × $6.00
Advanced Iron Condor Course in 2021
1 × $6.00 -
×
 Day Trade to Win E-Course with John Paul
1 × $6.00
Day Trade to Win E-Course with John Paul
1 × $6.00 -
×
 Beat the Market with Edward O.Thorp
1 × $6.00
Beat the Market with Edward O.Thorp
1 × $6.00 -
×
 Dynamic Time and Price Analysis of Market Trends with Bruce Gilmore
1 × $6.00
Dynamic Time and Price Analysis of Market Trends with Bruce Gilmore
1 × $6.00 -
×
 Capital with Charles D.Ellis
1 × $6.00
Capital with Charles D.Ellis
1 × $6.00 -
×
 ICT Prodigy Trading Course – $650K in Payouts with Alex Solignani
1 × $15.00
ICT Prodigy Trading Course – $650K in Payouts with Alex Solignani
1 × $15.00 -
×
 How to Capture Big Profits from Explosive Markets with Glen Ring
1 × $6.00
How to Capture Big Profits from Explosive Markets with Glen Ring
1 × $6.00 -
×
 Butterfly and Condor Workshop with Aeromir
1 × $15.00
Butterfly and Condor Workshop with Aeromir
1 × $15.00 -
×
 Advanced Bond Trading Course
1 × $62.00
Advanced Bond Trading Course
1 × $62.00 -
×
 The Logical Trader: Applying a Method to the Madness with Mark Fisher
1 × $6.00
The Logical Trader: Applying a Method to the Madness with Mark Fisher
1 × $6.00 -
×
 Futures Trading Secrets Home Study Course 2008 with Bill McCready
1 × $6.00
Futures Trading Secrets Home Study Course 2008 with Bill McCready
1 × $6.00 -
×
 Advanced Iron Condors, Trading Concepts with Todd Mitchell
1 × $31.00
Advanced Iron Condors, Trading Concepts with Todd Mitchell
1 × $31.00 -
×
 E-mini Weekly Options Income with Peter Titus
1 × $15.00
E-mini Weekly Options Income with Peter Titus
1 × $15.00 -
×
 Crypto Trading Academy with Cheeky Investor - Aussie Day Trader
1 × $13.00
Crypto Trading Academy with Cheeky Investor - Aussie Day Trader
1 × $13.00 -
×
 Practical Speculation with Victor Niederhoffer, Laurel Kenner
1 × $6.00
Practical Speculation with Victor Niederhoffer, Laurel Kenner
1 × $6.00 -
×
 Scalp Strategy and Flipping Small Accounts with Opes Trading Group
1 × $5.00
Scalp Strategy and Flipping Small Accounts with Opes Trading Group
1 × $5.00 -
×
 Learn To Day-Trade the E-Mini S&P 500. Simple-as-123 with Marshall Jones
1 × $6.00
Learn To Day-Trade the E-Mini S&P 500. Simple-as-123 with Marshall Jones
1 × $6.00 -
×
 Forex Retracement Theory with CopperChips
1 × $6.00
Forex Retracement Theory with CopperChips
1 × $6.00 -
×
 $20 – 52k 20 pips a day challange with Rafał Zuchowicz - TopMasterTrader
1 × $5.00
$20 – 52k 20 pips a day challange with Rafał Zuchowicz - TopMasterTrader
1 × $5.00 -
×
 Geometry of Markets I with Bruce Gilmore
1 × $6.00
Geometry of Markets I with Bruce Gilmore
1 × $6.00 -
×
 8 Strategies for Day Trading
1 × $31.00
8 Strategies for Day Trading
1 × $31.00 -
×
 The Indices Orderflow Masterclass with The Forex Scalpers
1 × $23.00
The Indices Orderflow Masterclass with The Forex Scalpers
1 × $23.00 -
×
 Full Volume Forex Training Course with ThatFXTrader
1 × $5.00
Full Volume Forex Training Course with ThatFXTrader
1 × $5.00 -
×
 Put Option Strategies for Smarter Trading with Michael Thomsett
1 × $6.00
Put Option Strategies for Smarter Trading with Michael Thomsett
1 × $6.00 -
×
 Advanced Spread Trading with Guy Bower - MasterClass Trader
1 × $15.00
Advanced Spread Trading with Guy Bower - MasterClass Trader
1 × $15.00 -
×
 Forecast, Filings, & News with Jtrader
1 × $6.00
Forecast, Filings, & News with Jtrader
1 × $6.00 -
×
 Earnings Reaction Gaps Workshop with John Pocorobba
1 × $27.00
Earnings Reaction Gaps Workshop with John Pocorobba
1 × $27.00 -
×
 Forex Trading with Ed Ponsi
1 × $6.00
Forex Trading with Ed Ponsi
1 × $6.00 -
×
 SQX Mentorship with Tip Toe Hippo
1 × $23.00
SQX Mentorship with Tip Toe Hippo
1 × $23.00 -
×
 Superleverage The Only Sensible Way to Speculate with Steve Sarnoff
1 × $6.00
Superleverage The Only Sensible Way to Speculate with Steve Sarnoff
1 × $6.00 -
×
 Crystal Ball Pack PLUS bonus Live Trade By Pat Mitchell - Trick Trades
1 × $20.00
Crystal Ball Pack PLUS bonus Live Trade By Pat Mitchell - Trick Trades
1 × $20.00 -
×
 Investment Leadership & Portfolio Management with Brian Singer
1 × $6.00
Investment Leadership & Portfolio Management with Brian Singer
1 × $6.00 -
×
 HEDGED STRATEGY SERIES IN VOLATILE MARKETS – HEDGED CREDIT SPREADS - Dan Sheridan
1 × $6.00
HEDGED STRATEGY SERIES IN VOLATILE MARKETS – HEDGED CREDIT SPREADS - Dan Sheridan
1 × $6.00 -
×
 How I Trade Growth Stocks In Bull And Bear Markets
1 × $54.00
How I Trade Growth Stocks In Bull And Bear Markets
1 × $54.00 -
×
 Lifespan Investing with Clifford Pistolese
1 × $6.00
Lifespan Investing with Clifford Pistolese
1 × $6.00 -
×
 Profiting In Bull Or Bear Markets with George Dagnino
1 × $6.00
Profiting In Bull Or Bear Markets with George Dagnino
1 × $6.00 -
×
 NFTMastermind with Charting Wizards
1 × $5.00
NFTMastermind with Charting Wizards
1 × $5.00 -
×
 System Building Masterclass
1 × $31.00
System Building Masterclass
1 × $31.00 -
×
 Investing In KLSE Stocks and Futures With Japanese Candlestick with Fred Tam
1 × $6.00
Investing In KLSE Stocks and Futures With Japanese Candlestick with Fred Tam
1 × $6.00 -
×
 W. D Gann 's Square Of 9 Applied To Modern Markets with Sean Avidar - Hexatrade350
1 × $23.00
W. D Gann 's Square Of 9 Applied To Modern Markets with Sean Avidar - Hexatrade350
1 × $23.00 -
×
 ENG Renko Mastery with International Scalpers
1 × $10.00
ENG Renko Mastery with International Scalpers
1 × $10.00 -
×
 Pristine - Tom Willard – Creating The Ultimate Trading Psychology Using 3 Key Concepts
1 × $6.00
Pristine - Tom Willard – Creating The Ultimate Trading Psychology Using 3 Key Concepts
1 × $6.00 -
×
 Fundamentals of Forex Trading with Joshua Garrison
1 × $5.00
Fundamentals of Forex Trading with Joshua Garrison
1 × $5.00 -
×
 9-Pack of TOS Indicators
1 × $6.00
9-Pack of TOS Indicators
1 × $6.00 -
×
 The Orderflows Trade Opportunities Encyclopedia with Michael Valtos
1 × $8.00
The Orderflows Trade Opportunities Encyclopedia with Michael Valtos
1 × $8.00 -
×
 High Yield Investments I & II with Lance Spicer
1 × $6.00
High Yield Investments I & II with Lance Spicer
1 × $6.00 -
×
 The Dynamic Trading Master Course with Robert Miner
1 × $54.00
The Dynamic Trading Master Course with Robert Miner
1 × $54.00
 with Arthur A.Hill")
Introduction to Candlestick (Article) with Arthur A.Hill
$6.00
File Size: Coming soon!
Delivery Time: 1–12 hours
Media Type: Online Course
Content Proof: Watch Here!
You may check content proof of “Introduction to Candlestick (Article) with Arthur A.Hill” below:
 with Arthur A.Hill")
Introduction to Candlestick (Article) with Arthur A. Hill
Candlestick charting is an essential tool for traders and investors, providing a visual representation of price movements. Arthur A. Hill, a renowned expert in technical analysis, offers a comprehensive introduction to candlestick charts, making them accessible to beginners and valuable for experienced traders. Let’s explore the basics of candlestick charting and how it can enhance your trading strategy.
What is a Candlestick Chart?
A candlestick chart is a type of financial chart used to describe price movements of a security, derivative, or currency.
Components of a Candlestick
- Body: The thick part of the candlestick, showing the opening and closing prices.
- Wicks/Shadows: The thin lines above and below the body, indicating the highest and lowest prices during the period.
- Color: Traditionally, a green or white body indicates a closing price higher than the opening price, while a red or black body indicates a closing price lower than the opening price.
History of Candlestick Charting
Candlestick charting originated in Japan over 300 years ago, developed by rice traders to track market prices and daily supply and demand.
Evolution of Candlestick Charts
Over the centuries, candlestick charting has evolved and gained popularity worldwide, becoming a staple in technical analysis.
Introduction to Western Markets
Candlestick charts were introduced to the Western financial markets in the late 20th century and quickly became popular among traders.
Advantages of Candlestick Charts
Candlestick charts offer several advantages over traditional bar charts and line charts.
Visual Clarity
Candlestick charts provide a clear and concise representation of price movements, making it easier to interpret market trends.
Immediate Insight
The color-coded bodies and wicks offer immediate insight into market sentiment and price direction.
Pattern Recognition
Candlestick charts are excellent for identifying patterns that can predict future price movements.
Common Candlestick Patterns
- Doji: Indicates indecision in the market.
- Hammer: Suggests a potential reversal from a downtrend.
- Engulfing: A strong signal of a potential trend reversal.
Basic Candlestick Patterns
Understanding basic candlestick patterns is crucial for any trader looking to use this charting method effectively.
Bullish Patterns
Bullish patterns indicate potential upward price movements.
Hammer and Inverted Hammer
- Hammer: A candlestick with a small body and a long lower wick, indicating potential reversal from a downtrend.
- Inverted Hammer: Similar to the hammer but with a long upper wick, suggesting a potential bullish reversal.
Bearish Patterns
Bearish patterns suggest potential downward price movements.
Shooting Star and Hanging Man
- Shooting Star: A candlestick with a small body and a long upper wick, indicating a potential reversal from an uptrend.
- Hanging Man: Similar to the hammer but occurs after an uptrend, signaling a potential bearish reversal.
Advanced Candlestick Patterns
For more experienced traders, advanced candlestick patterns provide deeper insights into market trends.
Engulfing Patterns
Engulfing patterns occur when a smaller candlestick is followed by a larger candlestick that completely engulfs the smaller one.
Bullish Engulfing
A bullish engulfing pattern occurs at the bottom of a downtrend and signals a potential upward reversal.
Bearish Engulfing
A bearish engulfing pattern appears at the top of an uptrend and suggests a potential downward reversal.
Morning Star and Evening Star
These patterns are three-candlestick formations that indicate strong trend reversals.
Morning Star
The morning star pattern consists of a bearish candle, a small indecisive candle, and a bullish candle, indicating a bullish reversal.
Evening Star
The evening star pattern includes a bullish candle, a small indecisive candle, and a bearish candle, suggesting a bearish reversal.
Incorporating Candlestick Charts into Your Trading Strategy
Candlestick charts are versatile and can be integrated into various trading strategies.
Combining with Other Indicators
Enhance the effectiveness of candlestick charts by combining them with other technical indicators.
Popular Indicators to Combine
- Moving Averages: Confirm trends and potential reversals.
- Relative Strength Index (RSI): Identify overbought or oversold conditions.
- Bollinger Bands: Measure market volatility and potential breakouts.
Setting Up Your Trading Platform
Most trading platforms offer candlestick charting options. Ensure you customize your charts to suit your trading style.
Customization Tips
- Time Frames: Choose appropriate time frames for your trading strategy.
- Color Schemes: Use distinct colors for bullish and bearish candles.
- Indicators: Add complementary indicators to your charts.
Common Mistakes to Avoid
Even with a robust understanding of candlestick charts, traders can make mistakes that affect their performance.
Over-reliance on Patterns
Relying solely on candlestick patterns without considering other factors can lead to false signals.
Diversify Analysis
Always use candlestick patterns in conjunction with other forms of analysis and market indicators.
Ignoring Market Context
Candlestick patterns can be misleading if not considered within the broader market context.
Comprehensive Analysis
Incorporate fundamental analysis and overall market trends to validate candlestick signals.
Conclusion
Candlestick charting, as introduced by Arthur A. Hill, offers a powerful tool for traders to understand and predict market movements. By mastering basic and advanced patterns, combining them with other technical indicators, and avoiding common pitfalls, traders can enhance their market analysis and trading performance. Whether you’re new to trading or an experienced trader, candlestick charts provide valuable insights that can guide your investment decisions.
Frequently Asked Questions:
- What is a candlestick chart?
A candlestick chart is a type of financial chart used to represent price movements over a specific period, showing the opening, closing, high, and low prices. - Why are candlestick charts popular among traders?
They provide visual clarity and help in identifying patterns that can predict future price movements. - What are some basic candlestick patterns?
Basic patterns include the hammer, inverted hammer, shooting star, and hanging man, which indicate potential market reversals. - Can candlestick charts be used with other technical indicators?
Yes, combining candlestick charts with indicators like moving averages, RSI, and Bollinger Bands enhances their effectiveness. - How can I avoid common mistakes when using candlestick charts?
Avoid over-relying on patterns and always consider the broader market context and other forms of analysis.
Be the first to review “Introduction to Candlestick (Article) with Arthur A.Hill”
You must be logged in to post a review.
Related products
Original price was: $1,200.00.$23.00Current price is: $23.00.
Original price was: $799.00.$15.00Current price is: $15.00.

Original price was: $695.00.$41.00Current price is: $41.00.

Forex Trading
Original price was: $2,000.00.$23.00Current price is: $23.00.
Original price was: $895.00.$15.00Current price is: $15.00.
Original price was: $2,120.00.$15.00Current price is: $15.00.
Original price was: $450.00.$23.00Current price is: $23.00.
Forex Trading
Original price was: $249.00.$15.00Current price is: $15.00.
Forex Trading
Original price was: $999.00.$15.00Current price is: $15.00.
Original price was: $649.00.$20.00Current price is: $20.00.
Original price was: $139.00.$23.00Current price is: $23.00.
Original price was: $997.00.$13.00Current price is: $13.00.

Forex Trading
Original price was: $1,098.00.$39.00Current price is: $39.00.

Forex Trading
Quantamentals – The Next Great Forefront Of Trading and Investing with Trading Markets
Original price was: $1,495.00.$8.00Current price is: $8.00.
Forex Trading
Original price was: $799.00.$15.00Current price is: $15.00.
Forex Trading
Original price was: $499.00.$15.00Current price is: $15.00.
Original price was: $197.00.$5.00Current price is: $5.00.
Forex Trading
Original price was: $500.00.$5.00Current price is: $5.00.
Original price was: $497.00.$11.00Current price is: $11.00.
Original price was: $1,800.00.$54.00Current price is: $54.00.

Reviews
There are no reviews yet.