-
×
 Swing Trader Pro with Top Trade Tools
1 × $54.00
Swing Trader Pro with Top Trade Tools
1 × $54.00 -
×
 How To Develop A Winning Trading System That Fits You Home Study + Audio - 2020 with Van Tharp
1 × $62.00
How To Develop A Winning Trading System That Fits You Home Study + Audio - 2020 with Van Tharp
1 × $62.00 -
×
 High Probability ETF Trading: 7 Professional Strategies To Improve Your ETF Trading with Larry Connors
1 × $6.00
High Probability ETF Trading: 7 Professional Strategies To Improve Your ETF Trading with Larry Connors
1 × $6.00 -
×
 The Aftermath + Jack Savage Extras (How To Trade Gold) with FXSavages
1 × $6.00
The Aftermath + Jack Savage Extras (How To Trade Gold) with FXSavages
1 × $6.00 -
×
 Get to know the VIX Index (aka The Fear Index)
1 × $15.00
Get to know the VIX Index (aka The Fear Index)
1 × $15.00 -
×
 Algo Trading Strategies 2017 with Autotrading Academy
1 × $6.00
Algo Trading Strategies 2017 with Autotrading Academy
1 × $6.00 -
×
 Kicker Signals with Stephen W.Bigalow
1 × $6.00
Kicker Signals with Stephen W.Bigalow
1 × $6.00 -
×
 0 DTE Options Trading Workshop with Aeromir Corporation
1 × $15.00
0 DTE Options Trading Workshop with Aeromir Corporation
1 × $15.00 -
×
 The A14 Weekly Option Strategy Workshop with Amy Meissner
1 × $23.00
The A14 Weekly Option Strategy Workshop with Amy Meissner
1 × $23.00 -
×
 How To Read The Market Professionally with TradeSmart
1 × $27.00
How To Read The Market Professionally with TradeSmart
1 × $27.00 -
×
 Getting Started in Value Investing with Charles Mizrahi
1 × $6.00
Getting Started in Value Investing with Charles Mizrahi
1 × $6.00 -
×
 Trading 3SMA System with Hector DeVille
1 × $6.00
Trading 3SMA System with Hector DeVille
1 × $6.00 -
×
 Trading For A Living Course with Yvan Byeajee - Trading Composure
1 × $6.00
Trading For A Living Course with Yvan Byeajee - Trading Composure
1 × $6.00 -
×
 Increase Your Net Worth In 2 Hours A Week with Jerremy Newsome - Real Life Trading
1 × $17.00
Increase Your Net Worth In 2 Hours A Week with Jerremy Newsome - Real Life Trading
1 × $17.00 -
×
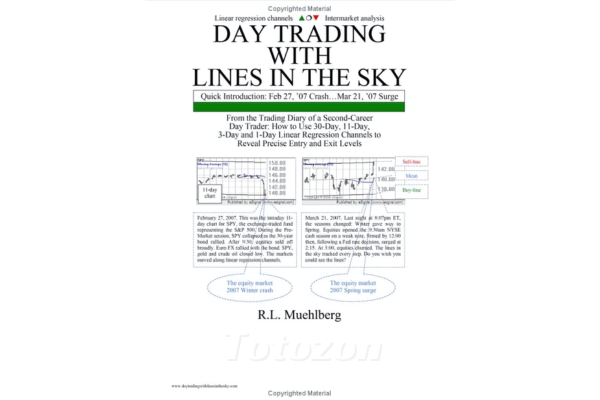 Day Trading with Lines in the Sky By R.L.Muehlberg
1 × $6.00
Day Trading with Lines in the Sky By R.L.Muehlberg
1 × $6.00 -
×
 Market Masters. How Traders Think Trade And Invest with Jake Bernstein
1 × $6.00
Market Masters. How Traders Think Trade And Invest with Jake Bernstein
1 × $6.00 -
×
 Startup Trading Masterclass with Jack Gleason
1 × $93.00
Startup Trading Masterclass with Jack Gleason
1 × $93.00 -
×
 Quantitative Trading: How to Build Your Own Algorithmic Trading Business (1st Edition) with Ernest Chan
1 × $6.00
Quantitative Trading: How to Build Your Own Algorithmic Trading Business (1st Edition) with Ernest Chan
1 × $6.00 -
×
 CBOT Seminar on Market Profile (101 & 102) with Alex Benjamin
1 × $6.00
CBOT Seminar on Market Profile (101 & 102) with Alex Benjamin
1 × $6.00 -
×
 Smart Money Concepts with MFX Trading
1 × $13.00
Smart Money Concepts with MFX Trading
1 × $13.00 -
×
 Master Forex Fundamentals
1 × $15.00
Master Forex Fundamentals
1 × $15.00 -
×
 A Working Man's Forex Position Trading System 2010 with Alan Benefield
1 × $6.00
A Working Man's Forex Position Trading System 2010 with Alan Benefield
1 × $6.00 -
×
 Electronic Day Traders' Secrets: Learn From the Best of the Best DayTraders with Burton Friedfertig
1 × $6.00
Electronic Day Traders' Secrets: Learn From the Best of the Best DayTraders with Burton Friedfertig
1 × $6.00 -
×
 Quantum Swing Trader
1 × $6.00
Quantum Swing Trader
1 × $6.00 -
×
 The Trading Blueprint with Brad Goh - The Trading Geek
1 × $5.00
The Trading Blueprint with Brad Goh - The Trading Geek
1 × $5.00 -
×
 Studies in Stock Speculation (Volume I & II) with H.J.Wolf
1 × $6.00
Studies in Stock Speculation (Volume I & II) with H.J.Wolf
1 × $6.00 -
×
 Game-Maker Forex Trading System
1 × $6.00
Game-Maker Forex Trading System
1 × $6.00 -
×
 Profitable Patterns for Stock Trading with Larry Pesavento
1 × $6.00
Profitable Patterns for Stock Trading with Larry Pesavento
1 × $6.00 -
×
 PRO COURSE Order Flow Strategy with Gova Trading Academy
1 × $5.00
PRO COURSE Order Flow Strategy with Gova Trading Academy
1 × $5.00 -
×
 Bond Market Course with The Macro Compass
1 × $15.00
Bond Market Course with The Macro Compass
1 × $15.00 -
×
 Self-Paced Course – Advanced Financial Statements Analysis 2024
1 × $27.00
Self-Paced Course – Advanced Financial Statements Analysis 2024
1 × $27.00 -
×
 Learn To Profit From The Forex Market with FX Hustle
1 × $6.00
Learn To Profit From The Forex Market with FX Hustle
1 × $6.00 -
×
 The Complete Turtle Trader with Michael Covel
1 × $6.00
The Complete Turtle Trader with Michael Covel
1 × $6.00 -
×
 SQX Mentorship with Tip Toe Hippo
1 × $23.00
SQX Mentorship with Tip Toe Hippo
1 × $23.00 -
×
 Profit Generating System with Brian Williams
1 × $6.00
Profit Generating System with Brian Williams
1 × $6.00 -
×
 The EAP Training Program (Apr 2019)
1 × $6.00
The EAP Training Program (Apr 2019)
1 × $6.00 -
×
 The Indices Orderflow Masterclass with The Forex Scalpers
1 × $23.00
The Indices Orderflow Masterclass with The Forex Scalpers
1 × $23.00 -
×
 The Prop Trading Code with Brannigan Barrett - Axia Futures
1 × $23.00
The Prop Trading Code with Brannigan Barrett - Axia Futures
1 × $23.00 -
×
 Profit Trading VIX Options Course with Don Kaufman
1 × $6.00
Profit Trading VIX Options Course with Don Kaufman
1 × $6.00 -
×
 Day Trading For 50 Years PDF with Michael Jenkins
1 × $6.00
Day Trading For 50 Years PDF with Michael Jenkins
1 × $6.00 -
×
 The Art And Science Of Trading with Adam Grimes
1 × $6.00
The Art And Science Of Trading with Adam Grimes
1 × $6.00 -
×
 Equities with Peter Martin
1 × $6.00
Equities with Peter Martin
1 × $6.00 -
×
 Four Dimensional Stock Market Structures & Cycles with Bradley Cowan
1 × $6.00
Four Dimensional Stock Market Structures & Cycles with Bradley Cowan
1 × $6.00 -
×
 How to Trade Forex & Cryptocurrency with Bitraged
1 × $5.00
How to Trade Forex & Cryptocurrency with Bitraged
1 × $5.00 -
×
 Trading With an Edge with Bruce Gilmore
1 × $6.00
Trading With an Edge with Bruce Gilmore
1 × $6.00 -
×
 The Naked Eye: Raw Data Analytics with Edgar Torres - Raw Data Analytics
1 × $8.00
The Naked Eye: Raw Data Analytics with Edgar Torres - Raw Data Analytics
1 × $8.00 -
×
 ICT Trading Models with The Prop Trader
1 × $5.00
ICT Trading Models with The Prop Trader
1 × $5.00 -
×
 Price Analysis Webinar with Carolyn Boroden
1 × $6.00
Price Analysis Webinar with Carolyn Boroden
1 × $6.00 -
×
 The Illustrated Guide to Technical Analysis Signals and Phrases with Constance Brown
1 × $6.00
The Illustrated Guide to Technical Analysis Signals and Phrases with Constance Brown
1 × $6.00 -
×
 Picking the Best Stocks & Strategies for every Option Trade with James Bittman
1 × $6.00
Picking the Best Stocks & Strategies for every Option Trade with James Bittman
1 × $6.00 -
×
 Capital Asset Investment with Anthony F.Herbst
1 × $6.00
Capital Asset Investment with Anthony F.Herbst
1 × $6.00 -
×
 Forex Millionaire Course with Willis University
1 × $6.00
Forex Millionaire Course with Willis University
1 × $6.00 -
×
 Team Bull Trading Academy
1 × $5.00
Team Bull Trading Academy
1 × $5.00 -
×
 Options Trading & Ultimate MasterClass With Tyrone Abela - FX Evolution
1 × $54.00
Options Trading & Ultimate MasterClass With Tyrone Abela - FX Evolution
1 × $54.00 -
×
 Research And Trade Like The Pros with Lex Van Dam & James Helliwell
1 × $15.00
Research And Trade Like The Pros with Lex Van Dam & James Helliwell
1 × $15.00 -
×
 Scalp Strategy and Flipping Small Accounts with Opes Trading Group
1 × $5.00
Scalp Strategy and Flipping Small Accounts with Opes Trading Group
1 × $5.00 -
×
 Trading for a Bright Future with Martin Cole
1 × $6.00
Trading for a Bright Future with Martin Cole
1 × $6.00 -
×
 Natural Language Processing in Trading with Dr. Terry Benzschawel
1 × $31.00
Natural Language Processing in Trading with Dr. Terry Benzschawel
1 × $31.00 -
×
 Access All Areas with Marwood Research
1 × $54.00
Access All Areas with Marwood Research
1 × $54.00 -
×
 Commodity Speculation for Beginners with Charles Huff, Barbara Marinacci
1 × $6.00
Commodity Speculation for Beginners with Charles Huff, Barbara Marinacci
1 × $6.00 -
×
 Principles of Artificial Neural Networks (2nd Ed.) with Daniel Graupe
1 × $6.00
Principles of Artificial Neural Networks (2nd Ed.) with Daniel Graupe
1 × $6.00 -
×
 Practical Applications of Candlestick Charts with Gary Wagner
1 × $6.00
Practical Applications of Candlestick Charts with Gary Wagner
1 × $6.00 -
×
 3 Short Selling Strategies - Trading Strategy Bundles – Quantified Strategies
1 × $39.00
3 Short Selling Strategies - Trading Strategy Bundles – Quantified Strategies
1 × $39.00 -
×
 Essentials in Quantitative Trading QT01 By HangukQuant's
1 × $23.00
Essentials in Quantitative Trading QT01 By HangukQuant's
1 × $23.00 -
×
 Commodities Rising: The Reality Behind the Hype and How To Really Profit in the Commodities Market - Jeffrey Christian
1 × $6.00
Commodities Rising: The Reality Behind the Hype and How To Really Profit in the Commodities Market - Jeffrey Christian
1 × $6.00 -
×
 TraderSumo Academy Course
1 × $13.00
TraderSumo Academy Course
1 × $13.00 -
×
 Futures Trading (German)
1 × $6.00
Futures Trading (German)
1 × $6.00 -
×
 Strike Zone Strategy 2.0 Elite Package with Joe Rokop
1 × $39.00
Strike Zone Strategy 2.0 Elite Package with Joe Rokop
1 × $39.00 -
×
 Create Your Own Hedge Fund with Mark Wolfinger
1 × $6.00
Create Your Own Hedge Fund with Mark Wolfinger
1 × $6.00 -
×
 Fierce 10 On Demand Coaching Program with High Performance Trading
1 × $5.00
Fierce 10 On Demand Coaching Program with High Performance Trading
1 × $5.00 -
×
 Fibonacci Ratios with Pattern Recognition - Larry Pesavento & Steven Shapiro
1 × $6.00
Fibonacci Ratios with Pattern Recognition - Larry Pesavento & Steven Shapiro
1 × $6.00 -
×
 Option Greeks Class with Don Kaufman
1 × $6.00
Option Greeks Class with Don Kaufman
1 × $6.00 -
×
 Harmonic Vibrations with Larry Pesavento
1 × $6.00
Harmonic Vibrations with Larry Pesavento
1 × $6.00 -
×
 The Orderflows Trade Opportunities Encyclopedia with Michael Valtos
1 × $8.00
The Orderflows Trade Opportunities Encyclopedia with Michael Valtos
1 × $8.00 -
×
 Compass Trading System with Right Line Trading
1 × $39.00
Compass Trading System with Right Line Trading
1 × $39.00 -
×
 AstuceFX Mentorship 2023
1 × $27.00
AstuceFX Mentorship 2023
1 × $27.00 -
×
 The Compleat DayTrader I & II with Jack Bernstein
1 × $6.00
The Compleat DayTrader I & II with Jack Bernstein
1 × $6.00 -
×
 RiskDoctor RD2 – Intermediate Course to Options Trading the RiskDoctor Way - Charles Cottle
1 × $6.00
RiskDoctor RD2 – Intermediate Course to Options Trading the RiskDoctor Way - Charles Cottle
1 × $6.00 -
×
 Signals
1 × $6.00
Signals
1 × $6.00 -
×
 Neural Networks in the Capital Markets with Apostolos Paul Refenes
1 × $6.00
Neural Networks in the Capital Markets with Apostolos Paul Refenes
1 × $6.00 -
×
 DAY TRADING COURSE 2018
1 × $6.00
DAY TRADING COURSE 2018
1 × $6.00 -
×
 Forex Wave Theory: A Technical Analysis for Spot and Futures Curency Traders - James Bickford
1 × $6.00
Forex Wave Theory: A Technical Analysis for Spot and Futures Curency Traders - James Bickford
1 × $6.00 -
×
 Change Happens. Do You Profit Or Does Someone Else (Traders Expo Las Vegas Dec 2005) by Tobin Smith
1 × $6.00
Change Happens. Do You Profit Or Does Someone Else (Traders Expo Las Vegas Dec 2005) by Tobin Smith
1 × $6.00 -
×
 Secret Day - Swing Trading Strategy For Stock, Forex, Crypto with Value Stocks
1 × $5.00
Secret Day - Swing Trading Strategy For Stock, Forex, Crypto with Value Stocks
1 × $5.00 -
×
 Stupid Trader – Play Safe!
1 × $6.00
Stupid Trader – Play Safe!
1 × $6.00 -
×
 3_8’s to Wealth (Audio 84 MB+ WorkBooks) with Darlene Nelson
1 × $6.00
3_8’s to Wealth (Audio 84 MB+ WorkBooks) with Darlene Nelson
1 × $6.00 -
×
 A Course in Trading with Donald Mack & Wetsel Market Bureau
1 × $6.00
A Course in Trading with Donald Mack & Wetsel Market Bureau
1 × $6.00 -
×
 Range Trading with D.Singleton
1 × $6.00
Range Trading with D.Singleton
1 × $6.00 -
×
 Trading For Busy People with Josias Kere
1 × $6.00
Trading For Busy People with Josias Kere
1 × $6.00 -
×
 How to Trade a Vertical Market
1 × $93.00
How to Trade a Vertical Market
1 × $93.00 -
×
 Financial Astrology Course with Brian James Sklenka
1 × $6.00
Financial Astrology Course with Brian James Sklenka
1 × $6.00 -
×
 Algo Trading Masterclass with Ali Casey - StatOasis
1 × $23.00
Algo Trading Masterclass with Ali Casey - StatOasis
1 × $23.00 -
×
 STERLING SUHR’S ADVANCED FOREX BANK TRADING COURSE (DAYTRADING FOREX LIVE COURSE) 2017
1 × $15.00
STERLING SUHR’S ADVANCED FOREX BANK TRADING COURSE (DAYTRADING FOREX LIVE COURSE) 2017
1 × $15.00 -
×
 WondaFX Signature Strategy with WondaFX
1 × $5.00
WondaFX Signature Strategy with WondaFX
1 × $5.00 -
×
 Essential Skills for Consistency in Trading Class with Don Kaufman
1 × $6.00
Essential Skills for Consistency in Trading Class with Don Kaufman
1 × $6.00 -
×
 AI For Traders with Trading Markets
1 × $31.00
AI For Traders with Trading Markets
1 × $31.00 -
×
 Profits In PJs - Profitably Selling Stock Options for Passive Income with Cam Tucker
1 × $6.00
Profits In PJs - Profitably Selling Stock Options for Passive Income with Cam Tucker
1 × $6.00 -
×
 A Really Friendly Guide to Wavelets with C.Vallens
1 × $6.00
A Really Friendly Guide to Wavelets with C.Vallens
1 × $6.00 -
×
 PFAZoneSuite [Trading Indicator] 2017
1 × $109.00
PFAZoneSuite [Trading Indicator] 2017
1 × $109.00 -
×
 A Comparison of Popular Trading Systems (2nd Ed.) with Lars Kestner
1 × $6.00
A Comparison of Popular Trading Systems (2nd Ed.) with Lars Kestner
1 × $6.00 -
×
 Foundation of Successful Trading - 2 DVDs and Bonus Gann Time Factor 2 DVDs
1 × $31.00
Foundation of Successful Trading - 2 DVDs and Bonus Gann Time Factor 2 DVDs
1 × $31.00 -
×
 Crypto Trading Academy with Cheeky Investor - Aussie Day Trader
1 × $13.00
Crypto Trading Academy with Cheeky Investor - Aussie Day Trader
1 × $13.00
 with Arthur A.Hill")
Introduction to Candlestick (Article) with Arthur A.Hill
$6.00
File Size: Coming soon!
Delivery Time: 1–12 hours
Media Type: Online Course
Content Proof: Watch Here!
You may check content proof of “Introduction to Candlestick (Article) with Arthur A.Hill” below:
 with Arthur A.Hill")
Introduction to Candlestick (Article) with Arthur A. Hill
Candlestick charting is an essential tool for traders and investors, providing a visual representation of price movements. Arthur A. Hill, a renowned expert in technical analysis, offers a comprehensive introduction to candlestick charts, making them accessible to beginners and valuable for experienced traders. Let’s explore the basics of candlestick charting and how it can enhance your trading strategy.
What is a Candlestick Chart?
A candlestick chart is a type of financial chart used to describe price movements of a security, derivative, or currency.
Components of a Candlestick
- Body: The thick part of the candlestick, showing the opening and closing prices.
- Wicks/Shadows: The thin lines above and below the body, indicating the highest and lowest prices during the period.
- Color: Traditionally, a green or white body indicates a closing price higher than the opening price, while a red or black body indicates a closing price lower than the opening price.
History of Candlestick Charting
Candlestick charting originated in Japan over 300 years ago, developed by rice traders to track market prices and daily supply and demand.
Evolution of Candlestick Charts
Over the centuries, candlestick charting has evolved and gained popularity worldwide, becoming a staple in technical analysis.
Introduction to Western Markets
Candlestick charts were introduced to the Western financial markets in the late 20th century and quickly became popular among traders.
Advantages of Candlestick Charts
Candlestick charts offer several advantages over traditional bar charts and line charts.
Visual Clarity
Candlestick charts provide a clear and concise representation of price movements, making it easier to interpret market trends.
Immediate Insight
The color-coded bodies and wicks offer immediate insight into market sentiment and price direction.
Pattern Recognition
Candlestick charts are excellent for identifying patterns that can predict future price movements.
Common Candlestick Patterns
- Doji: Indicates indecision in the market.
- Hammer: Suggests a potential reversal from a downtrend.
- Engulfing: A strong signal of a potential trend reversal.
Basic Candlestick Patterns
Understanding basic candlestick patterns is crucial for any trader looking to use this charting method effectively.
Bullish Patterns
Bullish patterns indicate potential upward price movements.
Hammer and Inverted Hammer
- Hammer: A candlestick with a small body and a long lower wick, indicating potential reversal from a downtrend.
- Inverted Hammer: Similar to the hammer but with a long upper wick, suggesting a potential bullish reversal.
Bearish Patterns
Bearish patterns suggest potential downward price movements.
Shooting Star and Hanging Man
- Shooting Star: A candlestick with a small body and a long upper wick, indicating a potential reversal from an uptrend.
- Hanging Man: Similar to the hammer but occurs after an uptrend, signaling a potential bearish reversal.
Advanced Candlestick Patterns
For more experienced traders, advanced candlestick patterns provide deeper insights into market trends.
Engulfing Patterns
Engulfing patterns occur when a smaller candlestick is followed by a larger candlestick that completely engulfs the smaller one.
Bullish Engulfing
A bullish engulfing pattern occurs at the bottom of a downtrend and signals a potential upward reversal.
Bearish Engulfing
A bearish engulfing pattern appears at the top of an uptrend and suggests a potential downward reversal.
Morning Star and Evening Star
These patterns are three-candlestick formations that indicate strong trend reversals.
Morning Star
The morning star pattern consists of a bearish candle, a small indecisive candle, and a bullish candle, indicating a bullish reversal.
Evening Star
The evening star pattern includes a bullish candle, a small indecisive candle, and a bearish candle, suggesting a bearish reversal.
Incorporating Candlestick Charts into Your Trading Strategy
Candlestick charts are versatile and can be integrated into various trading strategies.
Combining with Other Indicators
Enhance the effectiveness of candlestick charts by combining them with other technical indicators.
Popular Indicators to Combine
- Moving Averages: Confirm trends and potential reversals.
- Relative Strength Index (RSI): Identify overbought or oversold conditions.
- Bollinger Bands: Measure market volatility and potential breakouts.
Setting Up Your Trading Platform
Most trading platforms offer candlestick charting options. Ensure you customize your charts to suit your trading style.
Customization Tips
- Time Frames: Choose appropriate time frames for your trading strategy.
- Color Schemes: Use distinct colors for bullish and bearish candles.
- Indicators: Add complementary indicators to your charts.
Common Mistakes to Avoid
Even with a robust understanding of candlestick charts, traders can make mistakes that affect their performance.
Over-reliance on Patterns
Relying solely on candlestick patterns without considering other factors can lead to false signals.
Diversify Analysis
Always use candlestick patterns in conjunction with other forms of analysis and market indicators.
Ignoring Market Context
Candlestick patterns can be misleading if not considered within the broader market context.
Comprehensive Analysis
Incorporate fundamental analysis and overall market trends to validate candlestick signals.
Conclusion
Candlestick charting, as introduced by Arthur A. Hill, offers a powerful tool for traders to understand and predict market movements. By mastering basic and advanced patterns, combining them with other technical indicators, and avoiding common pitfalls, traders can enhance their market analysis and trading performance. Whether you’re new to trading or an experienced trader, candlestick charts provide valuable insights that can guide your investment decisions.
Frequently Asked Questions:
- What is a candlestick chart?
A candlestick chart is a type of financial chart used to represent price movements over a specific period, showing the opening, closing, high, and low prices. - Why are candlestick charts popular among traders?
They provide visual clarity and help in identifying patterns that can predict future price movements. - What are some basic candlestick patterns?
Basic patterns include the hammer, inverted hammer, shooting star, and hanging man, which indicate potential market reversals. - Can candlestick charts be used with other technical indicators?
Yes, combining candlestick charts with indicators like moving averages, RSI, and Bollinger Bands enhances their effectiveness. - How can I avoid common mistakes when using candlestick charts?
Avoid over-relying on patterns and always consider the broader market context and other forms of analysis.
Be the first to review “Introduction to Candlestick (Article) with Arthur A.Hill”
You must be logged in to post a review.
Related products

Original price was: $497.00.$11.00Current price is: $11.00.
Forex Trading
Original price was: $1,898.00.$10.00Current price is: $10.00.

Forex Trading
Original price was: $125.00.$17.00Current price is: $17.00.

Original price was: $139.00.$23.00Current price is: $23.00.

Original price was: $700.00.$39.00Current price is: $39.00.
Forex Trading
Original price was: $499.00.$15.00Current price is: $15.00.

Original price was: $895.00.$15.00Current price is: $15.00.
Forex Trading
Original price was: $2,997.00.$23.00Current price is: $23.00.

Original price was: $1,849.00.$15.00Current price is: $15.00.

Forex Trading
The Complete Guide to Multiple Time Frame Analysis & Reading Price Action with Aiman Almansoori
Original price was: $1,399.00.$13.00Current price is: $13.00.

Original price was: $497.00.$31.00Current price is: $31.00.

Forex Trading
Original price was: $797.00.$10.00Current price is: $10.00.

Original price was: $4,995.00.$15.00Current price is: $15.00.

Original price was: $2,120.00.$15.00Current price is: $15.00.

Forex Trading
Original price was: $239.00.$8.00Current price is: $8.00.
Original price was: $1,800.00.$54.00Current price is: $54.00.
Original price was: $1,200.00.$23.00Current price is: $23.00.
Forex Trading
Original price was: $2,000.00.$23.00Current price is: $23.00.

Forex Trading
Original price was: $799.00.$15.00Current price is: $15.00.
Original price was: $997.00.$13.00Current price is: $13.00.

Reviews
There are no reviews yet.