-
×
 Crypto Trading Cyber Security for Bitcoin & Altcoin Holders with Zlatin Georgiev
1 × $5.00
Crypto Trading Cyber Security for Bitcoin & Altcoin Holders with Zlatin Georgiev
1 × $5.00 -
×
 How To Read The Market Professionally with TradeSmart
1 × $27.00
How To Read The Market Professionally with TradeSmart
1 × $27.00 -
×
 X-Factor Day-Trading
1 × $5.00
X-Factor Day-Trading
1 × $5.00 -
×
 Candlestick and Pivot Point Trading Triggers with John Person
1 × $6.00
Candlestick and Pivot Point Trading Triggers with John Person
1 × $6.00 -
×
 Order flow self-study training program with iMFtracker
1 × $10.00
Order flow self-study training program with iMFtracker
1 × $10.00 -
×
 The Orderflow Masterclass with PrimeTrading
1 × $17.00
The Orderflow Masterclass with PrimeTrading
1 × $17.00 -
×
 Crypto Trading Academy with Cheeky Investor - Aussie Day Trader
1 × $13.00
Crypto Trading Academy with Cheeky Investor - Aussie Day Trader
1 × $13.00 -
×
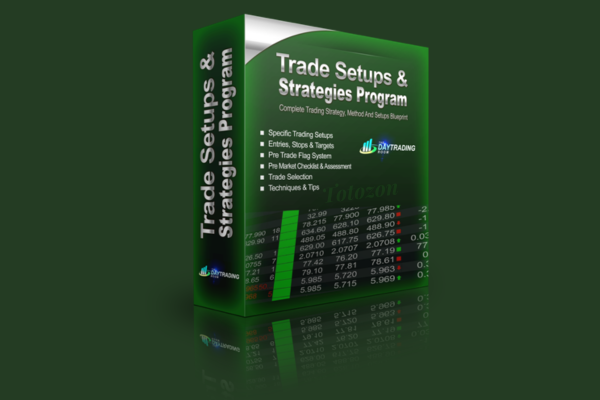 Trade Setups And Strategies Program with The Daytrading Room
1 × $23.00
Trade Setups And Strategies Program with The Daytrading Room
1 × $23.00 -
×
 Forecast 2024 Clarification with Larry Williams
1 × $15.00
Forecast 2024 Clarification with Larry Williams
1 × $15.00 -
×
 Trading Non-Farm Payroll Report
1 × $6.00
Trading Non-Farm Payroll Report
1 × $6.00 -
×
 Futures Trading Secrets Home Study with Bill McCready
1 × $6.00
Futures Trading Secrets Home Study with Bill McCready
1 × $6.00 -
×
 Access All Areas with Marwood Research
1 × $54.00
Access All Areas with Marwood Research
1 × $54.00 -
×
 Spread Trading E-Trading Stagionale (Italian) with Joe Ross
1 × $6.00
Spread Trading E-Trading Stagionale (Italian) with Joe Ross
1 × $6.00 -
×
 Compass Trading System with Right Line Trading
1 × $39.00
Compass Trading System with Right Line Trading
1 × $39.00 -
×
 Fierce 10 On Demand Coaching Program with High Performance Trading
1 × $5.00
Fierce 10 On Demand Coaching Program with High Performance Trading
1 × $5.00 -
×
 Capital Asset Investment with Anthony F.Herbst
1 × $6.00
Capital Asset Investment with Anthony F.Herbst
1 × $6.00 -
×
 Bond Market Course with The Macro Compass
1 × $15.00
Bond Market Course with The Macro Compass
1 × $15.00 -
×
 Simple Smart Forex Renko Program with Nikos Mermigas
1 × $10.00
Simple Smart Forex Renko Program with Nikos Mermigas
1 × $10.00 -
×
 A Litle Keltner, a Litle Wycoff and of lot of Street Smarts with Linda Raschke
1 × $6.00
A Litle Keltner, a Litle Wycoff and of lot of Street Smarts with Linda Raschke
1 × $6.00 -
×
 Kicker Signals with Stephen W.Bigalow
1 × $6.00
Kicker Signals with Stephen W.Bigalow
1 × $6.00 -
×
 Scalp Trading Mini Course with Jayson Casper
1 × $23.00
Scalp Trading Mini Course with Jayson Casper
1 × $23.00 -
×
 Advanced GET 8.0 EOD
1 × $6.00
Advanced GET 8.0 EOD
1 × $6.00 -
×
 Handbook of Integral Equations with Andrei D.Polyanin, Alexander V.Manzhirov
1 × $6.00
Handbook of Integral Equations with Andrei D.Polyanin, Alexander V.Manzhirov
1 × $6.00 -
×
 Traders Forge with Ryan Litchfield
1 × $6.00
Traders Forge with Ryan Litchfield
1 × $6.00 -
×
 High Probability Trading Using Elliott Wave And Fibonacci Analysis withVic Patel - Forex Training Group
1 × $10.00
High Probability Trading Using Elliott Wave And Fibonacci Analysis withVic Patel - Forex Training Group
1 × $10.00 -
×
 Just What I Said: Bloomberg Economics Columnist Takes on Bonds, Banks, Budgets, and Bubbles with Caroline Baum
1 × $6.00
Just What I Said: Bloomberg Economics Columnist Takes on Bonds, Banks, Budgets, and Bubbles with Caroline Baum
1 × $6.00 -
×
 Global Product with John Stark
1 × $6.00
Global Product with John Stark
1 × $6.00 -
×
 Crystal Ball Pack PLUS bonus Live Trade By Pat Mitchell - Trick Trades
1 × $20.00
Crystal Ball Pack PLUS bonus Live Trade By Pat Mitchell - Trick Trades
1 × $20.00 -
×
 San Jose Options - Iron Condor & Butterfly Options Trading Videos
1 × $15.00
San Jose Options - Iron Condor & Butterfly Options Trading Videos
1 × $15.00 -
×
 Forex Project Advanced Course with Tyler Crowell
1 × $5.00
Forex Project Advanced Course with Tyler Crowell
1 × $5.00 -
×
 Day Trader Course
1 × $6.00
Day Trader Course
1 × $6.00 -
×
 The A14 Weekly Option Strategy Workshop with Amy Meissner
1 × $23.00
The A14 Weekly Option Strategy Workshop with Amy Meissner
1 × $23.00 -
×
 The Trading Blueprint with Brad Goh - The Trading Geek
1 × $5.00
The Trading Blueprint with Brad Goh - The Trading Geek
1 × $5.00 -
×
 Pablo Order Flow Education with Pablo
1 × $6.00
Pablo Order Flow Education with Pablo
1 × $6.00 -
×
 An Introduction to Option Trading Success with James Bittman
1 × $6.00
An Introduction to Option Trading Success with James Bittman
1 × $6.00 -
×
 Self-Mastery Course with Steven Cruz
1 × $62.00
Self-Mastery Course with Steven Cruz
1 × $62.00 -
×
 Hedge Fund of Funds Investing with Joseph Nicholas
1 × $6.00
Hedge Fund of Funds Investing with Joseph Nicholas
1 × $6.00 -
×
 Futures Trading Secrets Home Study Course 2008 with Bill McCready
1 × $6.00
Futures Trading Secrets Home Study Course 2008 with Bill McCready
1 × $6.00 -
×
 Algo Trading Masterclass with Ali Casey - StatOasis
1 × $23.00
Algo Trading Masterclass with Ali Casey - StatOasis
1 × $23.00 -
×
 Option Trading: Pricing and Volatility Strategies and Techniques with Euan Sinclair
1 × $6.00
Option Trading: Pricing and Volatility Strategies and Techniques with Euan Sinclair
1 × $6.00 -
×
 Matrix Spread Options Trading Course with Base Camp Trading
1 × $31.00
Matrix Spread Options Trading Course with Base Camp Trading
1 × $31.00 -
×
 Mastering Risk Modeling with Excel by Alastair Day
1 × $6.00
Mastering Risk Modeling with Excel by Alastair Day
1 × $6.00 -
×
 The Bull Hunter with Dan Denning
1 × $6.00
The Bull Hunter with Dan Denning
1 × $6.00 -
×
 Stock Market Rules (2nd Ed.) with Michael Sheimo
1 × $6.00
Stock Market Rules (2nd Ed.) with Michael Sheimo
1 × $6.00 -
×
 The Practical Handbook of Genetic Algorithms with Lance Chambers
1 × $6.00
The Practical Handbook of Genetic Algorithms with Lance Chambers
1 × $6.00 -
×
 China & the World Trading System with Deborah Cass, Brett Williams & George Barker
1 × $6.00
China & the World Trading System with Deborah Cass, Brett Williams & George Barker
1 × $6.00 -
×
 Larry Connors Professional Day Trading for Success Program
1 × $62.00
Larry Connors Professional Day Trading for Success Program
1 × $62.00 -
×
 Measuring Risk in Complex Stochastic Systems with J.Franke, W. Hardle, G. Stahl
1 × $6.00
Measuring Risk in Complex Stochastic Systems with J.Franke, W. Hardle, G. Stahl
1 × $6.00 -
×
 Mastering Amibroker Formula Language
1 × $15.00
Mastering Amibroker Formula Language
1 × $15.00 -
×
 Confidence Game. How a Hadge Fund Manager Called Wall Street’s Bluff with Christine Richard
1 × $6.00
Confidence Game. How a Hadge Fund Manager Called Wall Street’s Bluff with Christine Richard
1 × $6.00 -
×
 Evolutionary Decision Trees for Stock Index Options and Futures Arbitrage by S.Markose, E.Tsang,H.Er
1 × $6.00
Evolutionary Decision Trees for Stock Index Options and Futures Arbitrage by S.Markose, E.Tsang,H.Er
1 × $6.00 -
×
 Inside the House of Money (2006) with Steven Drobny
1 × $6.00
Inside the House of Money (2006) with Steven Drobny
1 × $6.00 -
×
 White Phoenix’s The Smart (Money) Approach to Trading with Jayson Casper
1 × $39.00
White Phoenix’s The Smart (Money) Approach to Trading with Jayson Casper
1 × $39.00 -
×
 Pattern Cycles with Alan Farley
1 × $6.00
Pattern Cycles with Alan Farley
1 × $6.00 -
×
 Foundations of Technical Analysis (Article) with Andrew W.Lo
1 × $6.00
Foundations of Technical Analysis (Article) with Andrew W.Lo
1 × $6.00 -
×
 Artificial Intelligence with Larry Pesavento
1 × $6.00
Artificial Intelligence with Larry Pesavento
1 × $6.00 -
×
 The Psychology of Investing with John Nofsinger
1 × $6.00
The Psychology of Investing with John Nofsinger
1 × $6.00 -
×
 Activedaytrader - Workshop: Unusual Options
1 × $6.00
Activedaytrader - Workshop: Unusual Options
1 × $6.00 -
×
 Learn Investing & Trading with Danny Devan
1 × $23.00
Learn Investing & Trading with Danny Devan
1 × $23.00 -
×
 Market Analysis Companion for Metastock with Martin Pring
1 × $6.00
Market Analysis Companion for Metastock with Martin Pring
1 × $6.00 -
×
 The Naked Eye: Raw Data Analytics with Edgar Torres - Raw Data Analytics
1 × $8.00
The Naked Eye: Raw Data Analytics with Edgar Torres - Raw Data Analytics
1 × $8.00 -
×
 Keynes & The Market with Justyn Walsh
1 × $6.00
Keynes & The Market with Justyn Walsh
1 × $6.00 -
×
 Follow the Fed to Investment Success with Douglas Roberts
1 × $6.00
Follow the Fed to Investment Success with Douglas Roberts
1 × $6.00 -
×
 Active Trading Course Notes with Alan Hull
1 × $6.00
Active Trading Course Notes with Alan Hull
1 × $6.00 -
×
 Essentials in Quantitative Trading QT01 By HangukQuant's
1 × $23.00
Essentials in Quantitative Trading QT01 By HangukQuant's
1 × $23.00 -
×
 Secrets of Investors on WallStreet (Audio) with Ken Fisher
1 × $6.00
Secrets of Investors on WallStreet (Audio) with Ken Fisher
1 × $6.00 -
×
 Master The Markets 2.0 with French Trader
1 × $6.00
Master The Markets 2.0 with French Trader
1 × $6.00 -
×
 The Offshore Money Book with Arnold Cornez
1 × $6.00
The Offshore Money Book with Arnold Cornez
1 × $6.00 -
×
 Commitment Workshop for Traders by Adrienne Laris Toghraie
1 × $6.00
Commitment Workshop for Traders by Adrienne Laris Toghraie
1 × $6.00 -
×
 Dynamic Time and Price Analysis of Market Trends with Bruce Gilmore
1 × $6.00
Dynamic Time and Price Analysis of Market Trends with Bruce Gilmore
1 × $6.00 -
×
 The Geography of Money with Benjamin J.Cohen
1 × $6.00
The Geography of Money with Benjamin J.Cohen
1 × $6.00 -
×
 The Handbook of Pairs Trading with Douglas Ehrman
1 × $6.00
The Handbook of Pairs Trading with Douglas Ehrman
1 × $6.00 -
×
 CFA Level 1 - Schweser Study Notes 2006 (schweser.com)
1 × $6.00
CFA Level 1 - Schweser Study Notes 2006 (schweser.com)
1 × $6.00 -
×
 Seasonality. Systems, Strategies & Signals
1 × $6.00
Seasonality. Systems, Strategies & Signals
1 × $6.00 -
×
 Investing In KLSE Stocks and Futures With Japanese Candlestick with Fred Tam
1 × $6.00
Investing In KLSE Stocks and Futures With Japanese Candlestick with Fred Tam
1 × $6.00 -
×
 Creating the Optimal Trade for Explosive Profits with George A.Fontanills
1 × $6.00
Creating the Optimal Trade for Explosive Profits with George A.Fontanills
1 × $6.00 -
×
 Advanced Options Trading: Approaches, Tools, and Techniques for Professionals Traders with Kevin Kraus
1 × $6.00
Advanced Options Trading: Approaches, Tools, and Techniques for Professionals Traders with Kevin Kraus
1 × $6.00 -
×
 Advanced AmiBroker Coding with Matt Radtke & Connors Research
1 × $23.00
Advanced AmiBroker Coding with Matt Radtke & Connors Research
1 × $23.00 -
×
 Get to know the VIX Index (aka The Fear Index)
1 × $15.00
Get to know the VIX Index (aka The Fear Index)
1 × $15.00 -
×
 Developing Mindfulness: The Observer of Thought with Traders State Of Mind
1 × $6.00
Developing Mindfulness: The Observer of Thought with Traders State Of Mind
1 × $6.00 -
×
 Short-Term Trading with Precision Timing - Jack Bernstein
1 × $6.00
Short-Term Trading with Precision Timing - Jack Bernstein
1 × $6.00 -
×
 The Sweep Show with Scott Pulcini Trader
1 × $23.00
The Sweep Show with Scott Pulcini Trader
1 × $23.00 -
×
 VIP - One on One Coursework with Talkin Options
1 × $15.00
VIP - One on One Coursework with Talkin Options
1 × $15.00 -
×
 AI For Traders with Trading Markets
1 × $31.00
AI For Traders with Trading Markets
1 × $31.00 -
×
 Equities with Peter Martin
1 × $6.00
Equities with Peter Martin
1 × $6.00 -
×
 Day Trading For 50 Years PDF with Michael Jenkins
1 × $6.00
Day Trading For 50 Years PDF with Michael Jenkins
1 × $6.00 -
×
 Advanced Pattern Recognition with John Cameron
1 × $23.00
Advanced Pattern Recognition with John Cameron
1 × $23.00 -
×
 How To Write High Converting Copy with Tej Dosa
1 × $6.00
How To Write High Converting Copy with Tej Dosa
1 × $6.00 -
×
 Dominate Stocks 2020 with J. Bravo
1 × $6.00
Dominate Stocks 2020 with J. Bravo
1 × $6.00 -
×
 $20 – 52k 20 pips a day challange with Rafał Zuchowicz - TopMasterTrader
1 × $5.00
$20 – 52k 20 pips a day challange with Rafał Zuchowicz - TopMasterTrader
1 × $5.00 -
×
 ABCs of Trading and Tech Analysis (Online Investor Expo, Las Vegas 2000) with Tom Bierovic
1 × $6.00
ABCs of Trading and Tech Analysis (Online Investor Expo, Las Vegas 2000) with Tom Bierovic
1 × $6.00 -
×
 Does a Holy Grail Really Exist with John Hayden
1 × $6.00
Does a Holy Grail Really Exist with John Hayden
1 × $6.00 -
×
 Trading for a Living with Alexander Elder
1 × $6.00
Trading for a Living with Alexander Elder
1 × $6.00 -
×
 Gann Wheel 1.2.15 (globalviewtech.com)
1 × $6.00
Gann Wheel 1.2.15 (globalviewtech.com)
1 × $6.00 -
×
 The Loyalty Effect with Frederick Reichheld
1 × $6.00
The Loyalty Effect with Frederick Reichheld
1 × $6.00 -
×
 The Market Geometry Basic Seminar DVD with Market Geometry
1 × $31.00
The Market Geometry Basic Seminar DVD with Market Geometry
1 × $31.00 -
×
 Optimize Funding Program 2023 with Solo Network Courses
1 × $13.00
Optimize Funding Program 2023 with Solo Network Courses
1 × $13.00 -
×
 Superleverage The Only Sensible Way to Speculate with Steve Sarnoff
1 × $6.00
Superleverage The Only Sensible Way to Speculate with Steve Sarnoff
1 × $6.00 -
×
 CFA Level 2 - Sample Item Sets 2003
1 × $6.00
CFA Level 2 - Sample Item Sets 2003
1 × $6.00 -
×
 7 Figures Forex Course
1 × $15.00
7 Figures Forex Course
1 × $15.00 -
×
 Street-Smart Chart Reading – Volume 2 – Digging Deeper with Donald G.Worden
1 × $6.00
Street-Smart Chart Reading – Volume 2 – Digging Deeper with Donald G.Worden
1 × $6.00 -
×
 Secret Weapon to Trading Options on ETF's Class with Don Kaufman
1 × $6.00
Secret Weapon to Trading Options on ETF's Class with Don Kaufman
1 × $6.00 -
×
 The Cash Flow Bootcamp with John Macgregor
1 × $233.00
The Cash Flow Bootcamp with John Macgregor
1 × $233.00 -
×
 Quarterly Theory with Trader Daye
1 × $20.00
Quarterly Theory with Trader Daye
1 × $20.00 -
×
 Investing with Exchange Traded Funds Made Easy with Marvin Appel
1 × $6.00
Investing with Exchange Traded Funds Made Easy with Marvin Appel
1 × $6.00 -
×
 Trading For A Living Course with Yvan Byeajee - Trading Composure
1 × $6.00
Trading For A Living Course with Yvan Byeajee - Trading Composure
1 × $6.00 -
×
 4 Day Trading Bootcamp
1 × $31.00
4 Day Trading Bootcamp
1 × $31.00 -
×
 AnkhFX Academy Course
1 × $17.00
AnkhFX Academy Course
1 × $17.00 -
×
 The Handbook of Technical Analysis: A Comprehensive Guide to Analytical Methods, Trading Systems and Technical Indicators with Darrell R. Jobman
1 × $6.00
The Handbook of Technical Analysis: A Comprehensive Guide to Analytical Methods, Trading Systems and Technical Indicators with Darrell R. Jobman
1 × $6.00 -
×
 Master Class Recording 2019 with Oil Trading Academy
1 × $17.00
Master Class Recording 2019 with Oil Trading Academy
1 × $17.00 -
×
 Sun Tzu and the Art of War for Traders with Dean Lundell
1 × $6.00
Sun Tzu and the Art of War for Traders with Dean Lundell
1 × $6.00 -
×
 Forex Mentor 2007 with Peter Bain
1 × $6.00
Forex Mentor 2007 with Peter Bain
1 × $6.00 -
×
 Volatility Position Risk Management with Cynthia Kase
1 × $6.00
Volatility Position Risk Management with Cynthia Kase
1 × $6.00 -
×
 Trading Short TermSame Day Trades Sep 2023 with Dan Sheridan & Mark Fenton - Sheridan Options Mentoring
1 × $31.00
Trading Short TermSame Day Trades Sep 2023 with Dan Sheridan & Mark Fenton - Sheridan Options Mentoring
1 × $31.00 -
×
 ICT Prodigy Trading Course – $650K in Payouts with Alex Solignani
1 × $15.00
ICT Prodigy Trading Course – $650K in Payouts with Alex Solignani
1 × $15.00 -
×
 A Seminar On Ocean Theory Home Study Trading Course with Pat Raffalovich
1 × $6.00
A Seminar On Ocean Theory Home Study Trading Course with Pat Raffalovich
1 × $6.00 -
×
 Trading With Venus
1 × $31.00
Trading With Venus
1 × $31.00 -
×
 How I Trade Growth Stocks In Bull And Bear Markets
1 × $54.00
How I Trade Growth Stocks In Bull And Bear Markets
1 × $54.00 -
×
 Altucher’s Top 1% Advisory Newsletter 2016 with James Altucher
1 × $6.00
Altucher’s Top 1% Advisory Newsletter 2016 with James Altucher
1 × $6.00 -
×
 Derivates Demystified
1 × $6.00
Derivates Demystified
1 × $6.00 -
×
 The Inner Circle Seminar
1 × $15.00
The Inner Circle Seminar
1 × $15.00 -
×
 Investing Smart. How to Pick Stocks with Investors Business Daily By Dhun H.Sethna
1 × $4.00
Investing Smart. How to Pick Stocks with Investors Business Daily By Dhun H.Sethna
1 × $4.00 -
×
 Knowing Where the Energy is Coming From with Charles Drummond
1 × $6.00
Knowing Where the Energy is Coming From with Charles Drummond
1 × $6.00 -
×
 Programming in Python For Traders with Trading Markets
1 × $15.00
Programming in Python For Traders with Trading Markets
1 × $15.00 -
×
 Daytrade (Italian) with Guiuseppe Migliorino
1 × $6.00
Daytrade (Italian) with Guiuseppe Migliorino
1 × $6.00 -
×
 TRADING NFX Course with Andrew NFX
1 × $5.00
TRADING NFX Course with Andrew NFX
1 × $5.00 -
×
 Advanced Trading Strategies with Larry Connors
1 × $6.00
Advanced Trading Strategies with Larry Connors
1 × $6.00 -
×
 What is Strategy with Michael E.Porter
1 × $6.00
What is Strategy with Michael E.Porter
1 × $6.00
 with Arthur A.Hill")
Introduction to Candlestick (Article) with Arthur A.Hill
$6.00
File Size: Coming soon!
Delivery Time: 1–12 hours
Media Type: Online Course
Content Proof: Watch Here!
You may check content proof of “Introduction to Candlestick (Article) with Arthur A.Hill” below:
 with Arthur A.Hill")
Introduction to Candlestick (Article) with Arthur A. Hill
Candlestick charting is an essential tool for traders and investors, providing a visual representation of price movements. Arthur A. Hill, a renowned expert in technical analysis, offers a comprehensive introduction to candlestick charts, making them accessible to beginners and valuable for experienced traders. Let’s explore the basics of candlestick charting and how it can enhance your trading strategy.
What is a Candlestick Chart?
A candlestick chart is a type of financial chart used to describe price movements of a security, derivative, or currency.
Components of a Candlestick
- Body: The thick part of the candlestick, showing the opening and closing prices.
- Wicks/Shadows: The thin lines above and below the body, indicating the highest and lowest prices during the period.
- Color: Traditionally, a green or white body indicates a closing price higher than the opening price, while a red or black body indicates a closing price lower than the opening price.
History of Candlestick Charting
Candlestick charting originated in Japan over 300 years ago, developed by rice traders to track market prices and daily supply and demand.
Evolution of Candlestick Charts
Over the centuries, candlestick charting has evolved and gained popularity worldwide, becoming a staple in technical analysis.
Introduction to Western Markets
Candlestick charts were introduced to the Western financial markets in the late 20th century and quickly became popular among traders.
Advantages of Candlestick Charts
Candlestick charts offer several advantages over traditional bar charts and line charts.
Visual Clarity
Candlestick charts provide a clear and concise representation of price movements, making it easier to interpret market trends.
Immediate Insight
The color-coded bodies and wicks offer immediate insight into market sentiment and price direction.
Pattern Recognition
Candlestick charts are excellent for identifying patterns that can predict future price movements.
Common Candlestick Patterns
- Doji: Indicates indecision in the market.
- Hammer: Suggests a potential reversal from a downtrend.
- Engulfing: A strong signal of a potential trend reversal.
Basic Candlestick Patterns
Understanding basic candlestick patterns is crucial for any trader looking to use this charting method effectively.
Bullish Patterns
Bullish patterns indicate potential upward price movements.
Hammer and Inverted Hammer
- Hammer: A candlestick with a small body and a long lower wick, indicating potential reversal from a downtrend.
- Inverted Hammer: Similar to the hammer but with a long upper wick, suggesting a potential bullish reversal.
Bearish Patterns
Bearish patterns suggest potential downward price movements.
Shooting Star and Hanging Man
- Shooting Star: A candlestick with a small body and a long upper wick, indicating a potential reversal from an uptrend.
- Hanging Man: Similar to the hammer but occurs after an uptrend, signaling a potential bearish reversal.
Advanced Candlestick Patterns
For more experienced traders, advanced candlestick patterns provide deeper insights into market trends.
Engulfing Patterns
Engulfing patterns occur when a smaller candlestick is followed by a larger candlestick that completely engulfs the smaller one.
Bullish Engulfing
A bullish engulfing pattern occurs at the bottom of a downtrend and signals a potential upward reversal.
Bearish Engulfing
A bearish engulfing pattern appears at the top of an uptrend and suggests a potential downward reversal.
Morning Star and Evening Star
These patterns are three-candlestick formations that indicate strong trend reversals.
Morning Star
The morning star pattern consists of a bearish candle, a small indecisive candle, and a bullish candle, indicating a bullish reversal.
Evening Star
The evening star pattern includes a bullish candle, a small indecisive candle, and a bearish candle, suggesting a bearish reversal.
Incorporating Candlestick Charts into Your Trading Strategy
Candlestick charts are versatile and can be integrated into various trading strategies.
Combining with Other Indicators
Enhance the effectiveness of candlestick charts by combining them with other technical indicators.
Popular Indicators to Combine
- Moving Averages: Confirm trends and potential reversals.
- Relative Strength Index (RSI): Identify overbought or oversold conditions.
- Bollinger Bands: Measure market volatility and potential breakouts.
Setting Up Your Trading Platform
Most trading platforms offer candlestick charting options. Ensure you customize your charts to suit your trading style.
Customization Tips
- Time Frames: Choose appropriate time frames for your trading strategy.
- Color Schemes: Use distinct colors for bullish and bearish candles.
- Indicators: Add complementary indicators to your charts.
Common Mistakes to Avoid
Even with a robust understanding of candlestick charts, traders can make mistakes that affect their performance.
Over-reliance on Patterns
Relying solely on candlestick patterns without considering other factors can lead to false signals.
Diversify Analysis
Always use candlestick patterns in conjunction with other forms of analysis and market indicators.
Ignoring Market Context
Candlestick patterns can be misleading if not considered within the broader market context.
Comprehensive Analysis
Incorporate fundamental analysis and overall market trends to validate candlestick signals.
Conclusion
Candlestick charting, as introduced by Arthur A. Hill, offers a powerful tool for traders to understand and predict market movements. By mastering basic and advanced patterns, combining them with other technical indicators, and avoiding common pitfalls, traders can enhance their market analysis and trading performance. Whether you’re new to trading or an experienced trader, candlestick charts provide valuable insights that can guide your investment decisions.
Frequently Asked Questions:
- What is a candlestick chart?
A candlestick chart is a type of financial chart used to represent price movements over a specific period, showing the opening, closing, high, and low prices. - Why are candlestick charts popular among traders?
They provide visual clarity and help in identifying patterns that can predict future price movements. - What are some basic candlestick patterns?
Basic patterns include the hammer, inverted hammer, shooting star, and hanging man, which indicate potential market reversals. - Can candlestick charts be used with other technical indicators?
Yes, combining candlestick charts with indicators like moving averages, RSI, and Bollinger Bands enhances their effectiveness. - How can I avoid common mistakes when using candlestick charts?
Avoid over-relying on patterns and always consider the broader market context and other forms of analysis.
Be the first to review “Introduction to Candlestick (Article) with Arthur A.Hill”
You must be logged in to post a review.
Related products

Forex Trading
Original price was: $2,997.00.$23.00Current price is: $23.00.

Forex Trading
Quantamentals – The Next Great Forefront Of Trading and Investing with Trading Markets
Original price was: $1,495.00.$8.00Current price is: $8.00.
Forex Trading
Original price was: $4,997.00.$27.00Current price is: $27.00.
Original price was: $649.00.$20.00Current price is: $20.00.
Original price was: $700.00.$39.00Current price is: $39.00.

Forex Trading
The Complete Guide to Multiple Time Frame Analysis & Reading Price Action with Aiman Almansoori
Original price was: $1,399.00.$13.00Current price is: $13.00.

Original price was: $4,995.00.$15.00Current price is: $15.00.

Original price was: $139.00.$23.00Current price is: $23.00.
Forex Trading
Original price was: $1,898.00.$10.00Current price is: $10.00.
Forex Trading
Original price was: $697.00.$5.00Current price is: $5.00.
Original price was: $997.00.$8.00Current price is: $8.00.

Forex Trading
Original price was: $550.00.$5.00Current price is: $5.00.

Forex Trading
Original price was: $239.00.$8.00Current price is: $8.00.
Forex Trading
Original price was: $249.00.$15.00Current price is: $15.00.
Original price was: $310.00.$23.00Current price is: $23.00.

Forex Trading
Original price was: $999.00.$15.00Current price is: $15.00.

Original price was: $299.00.$8.00Current price is: $8.00.

Original price was: $450.00.$23.00Current price is: $23.00.

Original price was: $1,800.00.$54.00Current price is: $54.00.
Forex Trading
Original price was: $2,995.00.$31.00Current price is: $31.00.

Reviews
There are no reviews yet.