-
×
 Market Profile Video with FutexLive
1 × $6.00
Market Profile Video with FutexLive
1 × $6.00 -
×
 Technical Timing Patterns
1 × $6.00
Technical Timing Patterns
1 × $6.00 -
×
 Matrix Spread Options Trading Course with Base Camp Trading
1 × $31.00
Matrix Spread Options Trading Course with Base Camp Trading
1 × $31.00 -
×
 A14 Weekly Options Strategy Workshop 2023 with Amy Meissner - Aeromir
1 × $23.00
A14 Weekly Options Strategy Workshop 2023 with Amy Meissner - Aeromir
1 × $23.00 -
×
 Equity Trader 101 Course with KeyStone Trading
1 × $6.00
Equity Trader 101 Course with KeyStone Trading
1 × $6.00 -
×
 Volatility and Timing with Jay Kaeppel – The Option Trader’s Guide to Probability
1 × $6.00
Volatility and Timing with Jay Kaeppel – The Option Trader’s Guide to Probability
1 × $6.00 -
×
 BSAPPS FX Course with Ben Barker
1 × $6.00
BSAPPS FX Course with Ben Barker
1 × $6.00 -
×
 An Introduction to Market Risk Measurement with Kevin Dowd
1 × $6.00
An Introduction to Market Risk Measurement with Kevin Dowd
1 × $6.00 -
×
 7 Steps to Success Trading Options Online with Larry Spears
1 × $4.00
7 Steps to Success Trading Options Online with Larry Spears
1 × $4.00 -
×
 Safety in the Market. Smarter Starter Pack 1st Edition
1 × $6.00
Safety in the Market. Smarter Starter Pack 1st Edition
1 × $6.00 -
×
 The Ultimate Trading Resource with Clayton Bell, Alex Viscusi & Ben Chaffee
1 × $6.00
The Ultimate Trading Resource with Clayton Bell, Alex Viscusi & Ben Chaffee
1 × $6.00 -
×
 Adx Mastery Complete Course
1 × $6.00
Adx Mastery Complete Course
1 × $6.00 -
×
 Big Boy Volume Spread Analysis + Advanced Price Action Mastery Course with Kai Sheng Chew
1 × $15.00
Big Boy Volume Spread Analysis + Advanced Price Action Mastery Course with Kai Sheng Chew
1 × $15.00 -
×
 W. D Gann 's Square Of 9 Applied To Modern Markets with Sean Avidar - Hexatrade350
1 × $23.00
W. D Gann 's Square Of 9 Applied To Modern Markets with Sean Avidar - Hexatrade350
1 × $23.00 -
×
 Emini Volume Break Out System
1 × $6.00
Emini Volume Break Out System
1 × $6.00 -
×
 Investment Science with David G.Luenberger
1 × $6.00
Investment Science with David G.Luenberger
1 × $6.00 -
×
 Fibsdontlie - Fibs Don’t Lie Advanced Course
1 × $15.00
Fibsdontlie - Fibs Don’t Lie Advanced Course
1 × $15.00 -
×
 CFA Level 2 - Sample Item Sets 2003
1 × $6.00
CFA Level 2 - Sample Item Sets 2003
1 × $6.00 -
×
 Computational Financial Mathematics with Mathematica
1 × $6.00
Computational Financial Mathematics with Mathematica
1 × $6.00 -
×
 Ezaih Academy 2024 Mentorship with Ezaih
1 × $54.00
Ezaih Academy 2024 Mentorship with Ezaih
1 × $54.00 -
×
 How Do You Read Charts? A Guide to Classic Price Pattern Recognition Class with Professor Jeff Bierman
1 × $6.00
How Do You Read Charts? A Guide to Classic Price Pattern Recognition Class with Professor Jeff Bierman
1 × $6.00 -
×
 Forex Education Trading System (Video 469 MB)
1 × $23.00
Forex Education Trading System (Video 469 MB)
1 × $23.00 -
×
 The Compleat DayTrader I & II with Jack Bernstein
1 × $6.00
The Compleat DayTrader I & II with Jack Bernstein
1 × $6.00 -
×
 Ahead of the Curve with Joseph Ellis
1 × $6.00
Ahead of the Curve with Joseph Ellis
1 × $6.00 -
×
 Traders Winning Edge with Adrienne Laris Toghraie
1 × $6.00
Traders Winning Edge with Adrienne Laris Toghraie
1 × $6.00 -
×
 Engineering Analysis: Interactive Methods and Programs with FORTRAN, QuickBASIC, MATLAB, and Mathematica with Yen-Ching Pao
1 × $6.00
Engineering Analysis: Interactive Methods and Programs with FORTRAN, QuickBASIC, MATLAB, and Mathematica with Yen-Ching Pao
1 × $6.00 -
×
 Algo Wizard Essentials Course with Srategy Quant
1 × $13.00
Algo Wizard Essentials Course with Srategy Quant
1 × $13.00 -
×
 The Management of Equity Investments with Dimitris Chorafas
1 × $6.00
The Management of Equity Investments with Dimitris Chorafas
1 × $6.00 -
×
 Professional Chart Reading Bootcamp - 2 CDs
1 × $6.00
Professional Chart Reading Bootcamp - 2 CDs
1 × $6.00 -
×
 Order flow self-study training program with iMFtracker
1 × $10.00
Order flow self-study training program with iMFtracker
1 × $10.00 -
×
 Blueprint to Extreme Reversals with Aiman Almansoori - Trading Terminal
1 × $8.00
Blueprint to Extreme Reversals with Aiman Almansoori - Trading Terminal
1 × $8.00 -
×
 Small Account Options Trading Workshop Package with Doc Severson
1 × $6.00
Small Account Options Trading Workshop Package with Doc Severson
1 × $6.00 -
×
 Fierce 10 On Demand Coaching Program with High Performance Trading
1 × $5.00
Fierce 10 On Demand Coaching Program with High Performance Trading
1 × $5.00 -
×
 Investment Madness with John Nofsinger
1 × $6.00
Investment Madness with John Nofsinger
1 × $6.00 -
×
 White Phoenix’s The Smart (Money) Approach to Trading with Jayson Casper
1 × $39.00
White Phoenix’s The Smart (Money) Approach to Trading with Jayson Casper
1 × $39.00 -
×
 Setups of a Winning Trader with Gareth Soloway
1 × $521.00
Setups of a Winning Trader with Gareth Soloway
1 × $521.00 -
×
 Advanced Options Trading: Approaches, Tools, and Techniques for Professionals Traders with Kevin Kraus
1 × $6.00
Advanced Options Trading: Approaches, Tools, and Techniques for Professionals Traders with Kevin Kraus
1 × $6.00 -
×
 Profit Before Work System with John Piper
1 × $6.00
Profit Before Work System with John Piper
1 × $6.00 -
×
 Professional Level Trading (IPLT) Online Video Series with Anton Kreil
1 × $6.00
Professional Level Trading (IPLT) Online Video Series with Anton Kreil
1 × $6.00 -
×
 High Probability Trading Using Elliott Wave And Fibonacci Analysis withVic Patel - Forex Training Group
1 × $10.00
High Probability Trading Using Elliott Wave And Fibonacci Analysis withVic Patel - Forex Training Group
1 × $10.00 -
×
 Harmonic Elliott Wave: The Case for Modification of R. N. Elliott's Impulsive Wave Structure with Ian Copsey
1 × $6.00
Harmonic Elliott Wave: The Case for Modification of R. N. Elliott's Impulsive Wave Structure with Ian Copsey
1 × $6.00 -
×
 Trade the OEX with Arthur Darack
1 × $6.00
Trade the OEX with Arthur Darack
1 × $6.00 -
×
 Advanced Options Concepts - Probability, Greeks, Simulation
1 × $6.00
Advanced Options Concepts - Probability, Greeks, Simulation
1 × $6.00 -
×
 The Prop Trading Code with Brannigan Barrett - Axia Futures
1 × $23.00
The Prop Trading Code with Brannigan Barrett - Axia Futures
1 × $23.00 -
×
 Capital Asset Investment with Anthony F.Herbst
1 × $6.00
Capital Asset Investment with Anthony F.Herbst
1 × $6.00 -
×
 The Adventures of the Cycle Hunter. The Analyst with Craig Bttlc
1 × $6.00
The Adventures of the Cycle Hunter. The Analyst with Craig Bttlc
1 × $6.00 -
×
 The Investors Guide to Active Asset Allocation with Martin Pring
1 × $6.00
The Investors Guide to Active Asset Allocation with Martin Pring
1 × $6.00 -
×
 How to Value & Sell your Business with Andrew Heslop
1 × $6.00
How to Value & Sell your Business with Andrew Heslop
1 × $6.00 -
×
 Royal Exchange Forex with Jan Teslar
1 × $6.00
Royal Exchange Forex with Jan Teslar
1 × $6.00 -
×
 Steady Compounding Investing Academy Course with Steady Compounding
1 × $55.00
Steady Compounding Investing Academy Course with Steady Compounding
1 × $55.00 -
×
 Steve Jobs. The Greatest Second Act in the History of Business with Young Simon
1 × $6.00
Steve Jobs. The Greatest Second Act in the History of Business with Young Simon
1 × $6.00 -
×
 Crystal Ball Pack PLUS bonus Live Trade By Pat Mitchell - Trick Trades
1 × $20.00
Crystal Ball Pack PLUS bonus Live Trade By Pat Mitchell - Trick Trades
1 × $20.00 -
×
 Investing with Exchange Traded Funds Made Easy with Marvin Appel
1 × $6.00
Investing with Exchange Traded Funds Made Easy with Marvin Appel
1 × $6.00 -
×
 0 DTE Options Trading Workshop with Aeromir Corporation
1 × $15.00
0 DTE Options Trading Workshop with Aeromir Corporation
1 × $15.00 -
×
 Marder Videos Reports 2019-2022 with Kevin Marder
1 × $104.00
Marder Videos Reports 2019-2022 with Kevin Marder
1 × $104.00 -
×
 Kicker Signals with Stephen W.Bigalow
1 × $6.00
Kicker Signals with Stephen W.Bigalow
1 × $6.00 -
×
 Bond Market Course with The Macro Compass
1 × $15.00
Bond Market Course with The Macro Compass
1 × $15.00 -
×
 The Precision Profit Float Indicator (TS Code & Setups) with Steve Woods
1 × $6.00
The Precision Profit Float Indicator (TS Code & Setups) with Steve Woods
1 × $6.00 -
×
 Compass Trading System with Right Line Trading
1 × $39.00
Compass Trading System with Right Line Trading
1 × $39.00 -
×
 S&P Market Timing Course For E-mini & Options Traders
1 × $6.00
S&P Market Timing Course For E-mini & Options Traders
1 × $6.00 -
×
 Evolution Course with Kevin Trades
1 × $15.00
Evolution Course with Kevin Trades
1 × $15.00 -
×
 The Master Indicator 2023 with Lance Ippolito
1 × $101.00
The Master Indicator 2023 with Lance Ippolito
1 × $101.00 -
×
 Forecast 2024 Clarification with Larry Williams
1 × $15.00
Forecast 2024 Clarification with Larry Williams
1 × $15.00 -
×
 Forex Trading Education Program (Apr-June 2010) with Jimmy Young
1 × $6.00
Forex Trading Education Program (Apr-June 2010) with Jimmy Young
1 × $6.00 -
×
 Active Beta Indexes with Khalid Ghayur
1 × $6.00
Active Beta Indexes with Khalid Ghayur
1 × $6.00 -
×
 Master Trader with InvestingSimple
1 × $15.00
Master Trader with InvestingSimple
1 × $15.00 -
×
 How To Read The Trend (Recorded Session) with TradeSmart
1 × $31.00
How To Read The Trend (Recorded Session) with TradeSmart
1 × $31.00 -
×
 TradeCraft: Your Path to Peak Performance Trading By Adam Grimes
1 × $15.00
TradeCraft: Your Path to Peak Performance Trading By Adam Grimes
1 × $15.00 -
×
 The Orderflow Masterclass with PrimeTrading
1 × $17.00
The Orderflow Masterclass with PrimeTrading
1 × $17.00 -
×
 Supply and Demand Video Course with JamesFXS
1 × $13.00
Supply and Demand Video Course with JamesFXS
1 × $13.00 -
×
 Futures Trading Secrets Home Study with Bill McCready
1 × $6.00
Futures Trading Secrets Home Study with Bill McCready
1 × $6.00 -
×
 ICT Prodigy Trading Course – $650K in Payouts with Alex Solignani
1 × $15.00
ICT Prodigy Trading Course – $650K in Payouts with Alex Solignani
1 × $15.00 -
×
 Quantifiable Edges – Gold Subscription with Rob Hanna
1 × $54.00
Quantifiable Edges – Gold Subscription with Rob Hanna
1 × $54.00 -
×
 Price Action Manual (2nd Ed.) with Bruce Gilmore
1 × $6.00
Price Action Manual (2nd Ed.) with Bruce Gilmore
1 × $6.00 -
×
 Stock Market Strategies That Work with Jack Bernstein
1 × $6.00
Stock Market Strategies That Work with Jack Bernstein
1 × $6.00 -
×
 Market Masters. How Traders Think Trade And Invest with Jake Bernstein
1 × $6.00
Market Masters. How Traders Think Trade And Invest with Jake Bernstein
1 × $6.00 -
×
 SQX Mentorship with Tip Toe Hippo
1 × $23.00
SQX Mentorship with Tip Toe Hippo
1 × $23.00 -
×
 The Logical Trader: Applying a Method to the Madness with Mark Fisher
1 × $6.00
The Logical Trader: Applying a Method to the Madness with Mark Fisher
1 × $6.00 -
×
 All About Stock Market Strategies: The Easy Way To Get Started (All About Series) with David Brown
1 × $6.00
All About Stock Market Strategies: The Easy Way To Get Started (All About Series) with David Brown
1 × $6.00 -
×
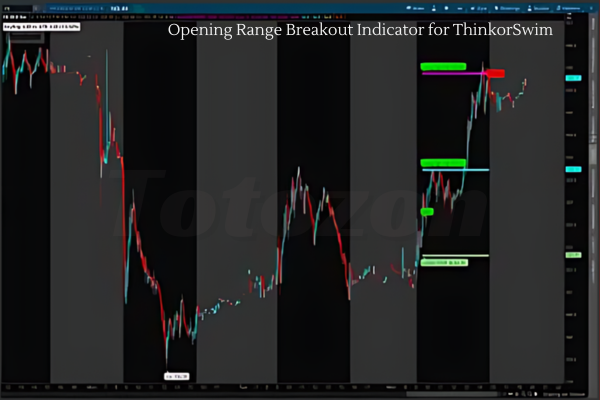 Opening Range Breakout Indicator for ThinkorSwim
1 × $6.00
Opening Range Breakout Indicator for ThinkorSwim
1 × $6.00 -
×
 Knowing Where the Energy is Coming From with Charles Drummond
1 × $6.00
Knowing Where the Energy is Coming From with Charles Drummond
1 × $6.00 -
×
 8 Strategies for Day Trading
1 × $31.00
8 Strategies for Day Trading
1 × $31.00 -
×
 Master Commodities Course
1 × $6.00
Master Commodities Course
1 × $6.00 -
×
 Pattern Picking with Charles Drummond
1 × $6.00
Pattern Picking with Charles Drummond
1 × $6.00 -
×
 Trading for a Bright Future with Martin Cole
1 × $6.00
Trading for a Bright Future with Martin Cole
1 × $6.00 -
×
 3 Steps To Supply/Demand + 3 Steps To Market Profile 10% Off Combined Price
1 × $23.00
3 Steps To Supply/Demand + 3 Steps To Market Profile 10% Off Combined Price
1 × $23.00 -
×
 The City Traders Course with Andrew Lockwood
1 × $10.00
The City Traders Course with Andrew Lockwood
1 × $10.00 -
×
 Advanced Scalping Techniques Home Study Course with Sami Abusaad - T3Live
1 × $31.00
Advanced Scalping Techniques Home Study Course with Sami Abusaad - T3Live
1 × $31.00 -
×
 WondaFX Signature Strategy with WondaFX
1 × $5.00
WondaFX Signature Strategy with WondaFX
1 × $5.00 -
×
 Essentials in Quantitative Trading QT01 By HangukQuant's
1 × $23.00
Essentials in Quantitative Trading QT01 By HangukQuant's
1 × $23.00 -
×
 Scalp Strategy and Flipping Small Accounts with Opes Trading Group
1 × $5.00
Scalp Strategy and Flipping Small Accounts with Opes Trading Group
1 × $5.00 -
×
 Advanced Technical Strategies Home Study Course with T3 LIVE
1 × $31.00
Advanced Technical Strategies Home Study Course with T3 LIVE
1 × $31.00 -
×
 A Working Man's Forex Position Trading System 2010 with Alan Benefield
1 × $6.00
A Working Man's Forex Position Trading System 2010 with Alan Benefield
1 × $6.00 -
×
 A PLAN TO MAKE $4K MONTHLY ON $20K with Dan Sheridan - Sheridan Options Mentoring
1 × $15.00
A PLAN TO MAKE $4K MONTHLY ON $20K with Dan Sheridan - Sheridan Options Mentoring
1 × $15.00 -
×
 European Members - March 2023 with Stockbee
1 × $5.00
European Members - March 2023 with Stockbee
1 × $5.00 -
×
 Investment Leadership & Portfolio Management with Brian Singer
1 × $6.00
Investment Leadership & Portfolio Management with Brian Singer
1 × $6.00 -
×
 Hedge Funds for Dummies
1 × $6.00
Hedge Funds for Dummies
1 × $6.00 -
×
 Selling Options For A Living Class with Don Kaufman
1 × $6.00
Selling Options For A Living Class with Don Kaufman
1 × $6.00 -
×
 Investment Performance Measurement with Bruce Feibel
1 × $6.00
Investment Performance Measurement with Bruce Feibel
1 × $6.00 -
×
 $20 – 52k 20 pips a day challange with Rafał Zuchowicz - TopMasterTrader
1 × $5.00
$20 – 52k 20 pips a day challange with Rafał Zuchowicz - TopMasterTrader
1 × $5.00 -
×
 Stock Market Winners with Maria Crawford Scott, John Bajkowski
1 × $6.00
Stock Market Winners with Maria Crawford Scott, John Bajkowski
1 × $6.00 -
×
 Dan Sheridan Delta Force
1 × $6.00
Dan Sheridan Delta Force
1 × $6.00 -
×
 Mastering Daily Option Trading with Option Pit
1 × $93.00
Mastering Daily Option Trading with Option Pit
1 × $93.00 -
×
 Advanced Ichimoku Kinkō Hyō - Ichimoku Cloud Strategy with Rafał Zuchowicz - TopMasterTrader
1 × $17.00
Advanced Ichimoku Kinkō Hyō - Ichimoku Cloud Strategy with Rafał Zuchowicz - TopMasterTrader
1 × $17.00 -
×
 Create Your Own Hedge Fund with Mark Wolfinger
1 × $6.00
Create Your Own Hedge Fund with Mark Wolfinger
1 × $6.00 -
×
 The Market Maker’s Edge with Josh Lukeman
1 × $6.00
The Market Maker’s Edge with Josh Lukeman
1 × $6.00 -
×
 How to Avoid Tax on Your Stock Market Profits with Lee Hadnum
1 × $6.00
How to Avoid Tax on Your Stock Market Profits with Lee Hadnum
1 × $6.00 -
×
 Trading The E-Minis for a Living with Don Miller
1 × $6.00
Trading The E-Minis for a Living with Don Miller
1 × $6.00 -
×
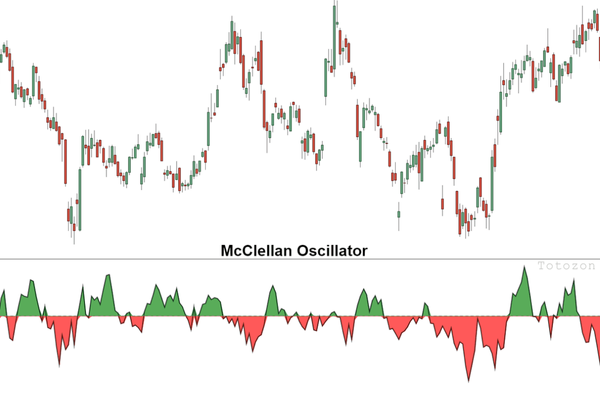 The McClellan Oscillator and Other Tools for with Tom McClellan
1 × $6.00
The McClellan Oscillator and Other Tools for with Tom McClellan
1 × $6.00 -
×
 Letal Forex System with Alex Seeni
1 × $6.00
Letal Forex System with Alex Seeni
1 × $6.00 -
×
 Trading Short TermSame Day Trades Sep 2023 with Dan Sheridan & Mark Fenton - Sheridan Options Mentoring
1 × $31.00
Trading Short TermSame Day Trades Sep 2023 with Dan Sheridan & Mark Fenton - Sheridan Options Mentoring
1 × $31.00 -
×
 Algo Trading Masterclass with Ali Casey - StatOasis
1 × $23.00
Algo Trading Masterclass with Ali Casey - StatOasis
1 × $23.00 -
×
 Dynamic Trading Indicators with Mark W.Helweg, David C.Stendahl
1 × $6.00
Dynamic Trading Indicators with Mark W.Helweg, David C.Stendahl
1 × $6.00 -
×
 Home Run Options Trading Course with Dave Aquino - Base Camp Trading
1 × $11.00
Home Run Options Trading Course with Dave Aquino - Base Camp Trading
1 × $11.00 -
×
 HandBook of Parametric and Nonparametric Statistical Procedures with David J.Sheskin
1 × $6.00
HandBook of Parametric and Nonparametric Statistical Procedures with David J.Sheskin
1 × $6.00 -
×
 The Practical Fractal with Bill Williams
1 × $6.00
The Practical Fractal with Bill Williams
1 × $6.00 -
×
 How You Can Be Right While the Crowd Loses with Jack Bernstein
1 × $6.00
How You Can Be Right While the Crowd Loses with Jack Bernstein
1 × $6.00 -
×
 Larry Williams Newsletters (1994-1997)
1 × $6.00
Larry Williams Newsletters (1994-1997)
1 × $6.00 -
×
 Crypto Trading Academy with Cheeky Investor - Aussie Day Trader
1 × $13.00
Crypto Trading Academy with Cheeky Investor - Aussie Day Trader
1 × $13.00 -
×
 Best of the Best: Collars with Amy Meissner & Scott Ruble
1 × $15.00
Best of the Best: Collars with Amy Meissner & Scott Ruble
1 × $15.00 -
×
 How To Read The Market Professionally with TradeSmart
1 × $27.00
How To Read The Market Professionally with TradeSmart
1 × $27.00 -
×
 Mastertrader – Mastering Swing Trading
1 × $31.00
Mastertrader – Mastering Swing Trading
1 × $31.00 -
×
 The Beginners Guide to Commodities Investing with Brian & Gayle Rice
1 × $6.00
The Beginners Guide to Commodities Investing with Brian & Gayle Rice
1 × $6.00 -
×
 FOREX Master Blueprint 2010 - 1 DVD + Manual with Forexmentor Frank Paul
1 × $6.00
FOREX Master Blueprint 2010 - 1 DVD + Manual with Forexmentor Frank Paul
1 × $6.00 -
×
 Quantum Stone Capital
1 × $15.00
Quantum Stone Capital
1 × $15.00 -
×
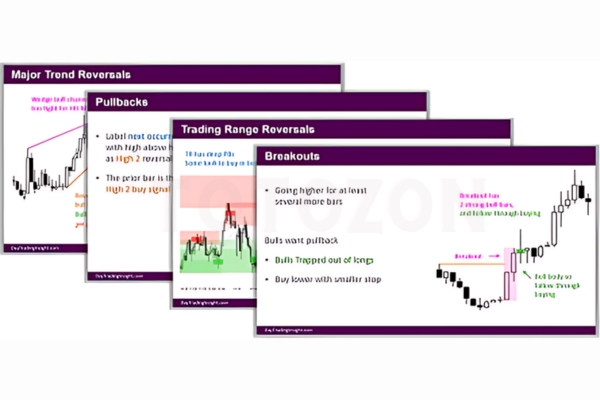 Day Trading Insight with Al Brooks
1 × $10.00
Day Trading Insight with Al Brooks
1 × $10.00 -
×
 Diary of an Internet Trader with Alpesh Patel
1 × $6.00
Diary of an Internet Trader with Alpesh Patel
1 × $6.00 -
×
 Learn To Fish Part III - How To Swing Trade for Consistent Gains with Daniel
1 × $15.00
Learn To Fish Part III - How To Swing Trade for Consistent Gains with Daniel
1 × $15.00 -
×
 Fibonacci Ratios with Pattern Recognition - Larry Pesavento & Steven Shapiro
1 × $6.00
Fibonacci Ratios with Pattern Recognition - Larry Pesavento & Steven Shapiro
1 × $6.00 -
×
 KP Trading Room w/ Paladin and JadeCapFX
1 × $5.00
KP Trading Room w/ Paladin and JadeCapFX
1 × $5.00 -
×
 Naked Forex: High-Probability Techniques for Trading Without Indicators (2012) with Alex Nekritin & Walter Peters
1 × $6.00
Naked Forex: High-Probability Techniques for Trading Without Indicators (2012) with Alex Nekritin & Walter Peters
1 × $6.00 -
×
 The Adventures of the Cycle Hunter. The Cyclist with Craig Bttlc
1 × $6.00
The Adventures of the Cycle Hunter. The Cyclist with Craig Bttlc
1 × $6.00 -
×
 Peter Borish Online Trader Program
1 × $15.00
Peter Borish Online Trader Program
1 × $15.00 -
×
 RSI Basic with Andrew Cardwell
1 × $54.00
RSI Basic with Andrew Cardwell
1 × $54.00 -
×
 How To Invest Better
1 × $6.00
How To Invest Better
1 × $6.00 -
×
 Trading Against the Crowd with John Summa
1 × $6.00
Trading Against the Crowd with John Summa
1 × $6.00 -
×
 The Indices Orderflow Masterclass with The Forex Scalpers
1 × $23.00
The Indices Orderflow Masterclass with The Forex Scalpers
1 × $23.00 -
×
 The Fundamentals of Options Trading Basis with Joseph Frey
1 × $6.00
The Fundamentals of Options Trading Basis with Joseph Frey
1 × $6.00 -
×
 Advanced Spread Trading with Guy Bower - MasterClass Trader
1 × $15.00
Advanced Spread Trading with Guy Bower - MasterClass Trader
1 × $15.00 -
×
 A Grand Supercycle Top Webinar with Steven Hochberg
1 × $6.00
A Grand Supercycle Top Webinar with Steven Hochberg
1 × $6.00 -
×
 Market Mindfields. Dancing with Gorilla
1 × $6.00
Market Mindfields. Dancing with Gorilla
1 × $6.00 -
×
 Euro Trading Course with Bkforex
1 × $6.00
Euro Trading Course with Bkforex
1 × $6.00 -
×
 Simpler Traders - Ultimate Guide to Debit Spreads (PREMIUM)
1 × $39.00
Simpler Traders - Ultimate Guide to Debit Spreads (PREMIUM)
1 × $39.00 -
×
 Deep Dive Butterfly Trading Strategy Class with SJG Trades
1 × $41.00
Deep Dive Butterfly Trading Strategy Class with SJG Trades
1 × $41.00 -
×
 The Orderflows Trade Opportunities Encyclopedia with Michael Valtos
1 × $8.00
The Orderflows Trade Opportunities Encyclopedia with Michael Valtos
1 × $8.00 -
×
 The Offshore Money Book with Arnold Cornez
1 × $6.00
The Offshore Money Book with Arnold Cornez
1 × $6.00 -
×
 AbleTrend with John Wang & Grace Wang
1 × $6.00
AbleTrend with John Wang & Grace Wang
1 × $6.00 -
×
 The Naked Eye: Raw Data Analytics with Edgar Torres - Raw Data Analytics
1 × $8.00
The Naked Eye: Raw Data Analytics with Edgar Torres - Raw Data Analytics
1 × $8.00 -
×
 Profit.ly - Bitcoin Basics
1 × $6.00
Profit.ly - Bitcoin Basics
1 × $6.00 -
×
 Futures 101: An Introduction to Futures Contracts Class with Don Kaufman
1 × $6.00
Futures 101: An Introduction to Futures Contracts Class with Don Kaufman
1 × $6.00 -
×
 Quantamentals - The Next Great Forefront Of Trading and Investing with Trading Markets
1 × $8.00
Quantamentals - The Next Great Forefront Of Trading and Investing with Trading Markets
1 × $8.00 -
×
 Advanced Iron Condor Course in 2021
1 × $6.00
Advanced Iron Condor Course in 2021
1 × $6.00 -
×
 FXStreet Unrecorded Webinars Sept & Oct, 2011 with Sam Seiden
1 × $6.00
FXStreet Unrecorded Webinars Sept & Oct, 2011 with Sam Seiden
1 × $6.00 -
×
 Ultimate Trading Course with Dodgy's Dungeon
1 × $8.00
Ultimate Trading Course with Dodgy's Dungeon
1 × $8.00 -
×
 Profit in the Futures Markets! with Jack Bernstein
1 × $6.00
Profit in the Futures Markets! with Jack Bernstein
1 × $6.00 -
×
 Krautgap By John Piper
1 × $6.00
Krautgap By John Piper
1 × $6.00 -
×
 Trading Economic Data System with CopperChips
1 × $6.00
Trading Economic Data System with CopperChips
1 × $6.00
 with Arthur A.Hill")
Introduction to Candlestick (Article) with Arthur A.Hill
$6.00
File Size: Coming soon!
Delivery Time: 1–12 hours
Media Type: Online Course
Content Proof: Watch Here!
You may check content proof of “Introduction to Candlestick (Article) with Arthur A.Hill” below:
 with Arthur A.Hill")
Introduction to Candlestick (Article) with Arthur A. Hill
Candlestick charting is an essential tool for traders and investors, providing a visual representation of price movements. Arthur A. Hill, a renowned expert in technical analysis, offers a comprehensive introduction to candlestick charts, making them accessible to beginners and valuable for experienced traders. Let’s explore the basics of candlestick charting and how it can enhance your trading strategy.
What is a Candlestick Chart?
A candlestick chart is a type of financial chart used to describe price movements of a security, derivative, or currency.
Components of a Candlestick
- Body: The thick part of the candlestick, showing the opening and closing prices.
- Wicks/Shadows: The thin lines above and below the body, indicating the highest and lowest prices during the period.
- Color: Traditionally, a green or white body indicates a closing price higher than the opening price, while a red or black body indicates a closing price lower than the opening price.
History of Candlestick Charting
Candlestick charting originated in Japan over 300 years ago, developed by rice traders to track market prices and daily supply and demand.
Evolution of Candlestick Charts
Over the centuries, candlestick charting has evolved and gained popularity worldwide, becoming a staple in technical analysis.
Introduction to Western Markets
Candlestick charts were introduced to the Western financial markets in the late 20th century and quickly became popular among traders.
Advantages of Candlestick Charts
Candlestick charts offer several advantages over traditional bar charts and line charts.
Visual Clarity
Candlestick charts provide a clear and concise representation of price movements, making it easier to interpret market trends.
Immediate Insight
The color-coded bodies and wicks offer immediate insight into market sentiment and price direction.
Pattern Recognition
Candlestick charts are excellent for identifying patterns that can predict future price movements.
Common Candlestick Patterns
- Doji: Indicates indecision in the market.
- Hammer: Suggests a potential reversal from a downtrend.
- Engulfing: A strong signal of a potential trend reversal.
Basic Candlestick Patterns
Understanding basic candlestick patterns is crucial for any trader looking to use this charting method effectively.
Bullish Patterns
Bullish patterns indicate potential upward price movements.
Hammer and Inverted Hammer
- Hammer: A candlestick with a small body and a long lower wick, indicating potential reversal from a downtrend.
- Inverted Hammer: Similar to the hammer but with a long upper wick, suggesting a potential bullish reversal.
Bearish Patterns
Bearish patterns suggest potential downward price movements.
Shooting Star and Hanging Man
- Shooting Star: A candlestick with a small body and a long upper wick, indicating a potential reversal from an uptrend.
- Hanging Man: Similar to the hammer but occurs after an uptrend, signaling a potential bearish reversal.
Advanced Candlestick Patterns
For more experienced traders, advanced candlestick patterns provide deeper insights into market trends.
Engulfing Patterns
Engulfing patterns occur when a smaller candlestick is followed by a larger candlestick that completely engulfs the smaller one.
Bullish Engulfing
A bullish engulfing pattern occurs at the bottom of a downtrend and signals a potential upward reversal.
Bearish Engulfing
A bearish engulfing pattern appears at the top of an uptrend and suggests a potential downward reversal.
Morning Star and Evening Star
These patterns are three-candlestick formations that indicate strong trend reversals.
Morning Star
The morning star pattern consists of a bearish candle, a small indecisive candle, and a bullish candle, indicating a bullish reversal.
Evening Star
The evening star pattern includes a bullish candle, a small indecisive candle, and a bearish candle, suggesting a bearish reversal.
Incorporating Candlestick Charts into Your Trading Strategy
Candlestick charts are versatile and can be integrated into various trading strategies.
Combining with Other Indicators
Enhance the effectiveness of candlestick charts by combining them with other technical indicators.
Popular Indicators to Combine
- Moving Averages: Confirm trends and potential reversals.
- Relative Strength Index (RSI): Identify overbought or oversold conditions.
- Bollinger Bands: Measure market volatility and potential breakouts.
Setting Up Your Trading Platform
Most trading platforms offer candlestick charting options. Ensure you customize your charts to suit your trading style.
Customization Tips
- Time Frames: Choose appropriate time frames for your trading strategy.
- Color Schemes: Use distinct colors for bullish and bearish candles.
- Indicators: Add complementary indicators to your charts.
Common Mistakes to Avoid
Even with a robust understanding of candlestick charts, traders can make mistakes that affect their performance.
Over-reliance on Patterns
Relying solely on candlestick patterns without considering other factors can lead to false signals.
Diversify Analysis
Always use candlestick patterns in conjunction with other forms of analysis and market indicators.
Ignoring Market Context
Candlestick patterns can be misleading if not considered within the broader market context.
Comprehensive Analysis
Incorporate fundamental analysis and overall market trends to validate candlestick signals.
Conclusion
Candlestick charting, as introduced by Arthur A. Hill, offers a powerful tool for traders to understand and predict market movements. By mastering basic and advanced patterns, combining them with other technical indicators, and avoiding common pitfalls, traders can enhance their market analysis and trading performance. Whether you’re new to trading or an experienced trader, candlestick charts provide valuable insights that can guide your investment decisions.
Frequently Asked Questions:
- What is a candlestick chart?
A candlestick chart is a type of financial chart used to represent price movements over a specific period, showing the opening, closing, high, and low prices. - Why are candlestick charts popular among traders?
They provide visual clarity and help in identifying patterns that can predict future price movements. - What are some basic candlestick patterns?
Basic patterns include the hammer, inverted hammer, shooting star, and hanging man, which indicate potential market reversals. - Can candlestick charts be used with other technical indicators?
Yes, combining candlestick charts with indicators like moving averages, RSI, and Bollinger Bands enhances their effectiveness. - How can I avoid common mistakes when using candlestick charts?
Avoid over-relying on patterns and always consider the broader market context and other forms of analysis.
Be the first to review “Introduction to Candlestick (Article) with Arthur A.Hill”
You must be logged in to post a review.
Related products
Forex Trading
Original price was: $850.00.$23.00Current price is: $23.00.
Original price was: $450.00.$23.00Current price is: $23.00.
Original price was: $1,200.00.$23.00Current price is: $23.00.
Forex Trading
Original price was: $499.00.$15.00Current price is: $15.00.
Forex Trading
Original price was: $2,000.00.$23.00Current price is: $23.00.

Original price was: $310.00.$23.00Current price is: $23.00.
Forex Trading
Original price was: $2,997.00.$23.00Current price is: $23.00.
Original price was: $700.00.$39.00Current price is: $39.00.

Forex Trading
Original price was: $697.00.$5.00Current price is: $5.00.
Original price was: $997.00.$13.00Current price is: $13.00.
Original price was: $299.00.$8.00Current price is: $8.00.
Original price was: $197.00.$5.00Current price is: $5.00.
Forex Trading
Original price was: $397.00.$31.00Current price is: $31.00.

Forex Trading
Original price was: $500.00.$5.00Current price is: $5.00.

Original price was: $1,800.00.$54.00Current price is: $54.00.
Forex Trading
Original price was: $797.00.$10.00Current price is: $10.00.
Forex Trading
Original price was: $550.00.$5.00Current price is: $5.00.
Original price was: $997.00.$8.00Current price is: $8.00.
Original price was: $895.00.$15.00Current price is: $15.00.
Forex Trading
Original price was: $4,997.00.$27.00Current price is: $27.00.

Reviews
There are no reviews yet.