-
×
 Trading Non-Farm Payroll Report
1 × $6.00
Trading Non-Farm Payroll Report
1 × $6.00 -
×
 Handbook on the Knowledge Economy with David Rooney
1 × $6.00
Handbook on the Knowledge Economy with David Rooney
1 × $6.00 -
×
 The Janus Factor with Gary Anderson
1 × $6.00
The Janus Factor with Gary Anderson
1 × $6.00 -
×
 Computational Financial Mathematics with Mathematica
1 × $6.00
Computational Financial Mathematics with Mathematica
1 × $6.00 -
×
 Crypto Trading Academy with Cheeky Investor - Aussie Day Trader
1 × $13.00
Crypto Trading Academy with Cheeky Investor - Aussie Day Trader
1 × $13.00 -
×
 Steve Jobs. The Greatest Second Act in the History of Business with Young Simon
1 × $6.00
Steve Jobs. The Greatest Second Act in the History of Business with Young Simon
1 × $6.00 -
×
 Professional Level Trading (IPLT) Online Video Series with Anton Kreil
1 × $6.00
Professional Level Trading (IPLT) Online Video Series with Anton Kreil
1 × $6.00 -
×
 Superleverage The Only Sensible Way to Speculate with Steve Sarnoff
1 × $6.00
Superleverage The Only Sensible Way to Speculate with Steve Sarnoff
1 × $6.00 -
×
 The A14 Weekly Option Strategy Workshop with Amy Meissner
1 × $23.00
The A14 Weekly Option Strategy Workshop with Amy Meissner
1 × $23.00 -
×
 Advanced Swing Trading with John Crane
1 × $6.00
Advanced Swing Trading with John Crane
1 × $6.00 -
×
 The Best (Public) Trading Methods I’ve Found for Futures & Equities with Perry J.Kaufman
1 × $6.00
The Best (Public) Trading Methods I’ve Found for Futures & Equities with Perry J.Kaufman
1 × $6.00 -
×
 Bollinger Bands Trading Strategies That Work
1 × $6.00
Bollinger Bands Trading Strategies That Work
1 × $6.00 -
×
 The STRAT Execution Basics with Jermaine McGruder
1 × $31.00
The STRAT Execution Basics with Jermaine McGruder
1 × $31.00 -
×
 Forex Mentor - FX Winning Strategies
1 × $15.00
Forex Mentor - FX Winning Strategies
1 × $15.00 -
×
 Offensive & Defensive Strengths of Stocks, Groups & Sectors Gary Anderson
1 × $6.00
Offensive & Defensive Strengths of Stocks, Groups & Sectors Gary Anderson
1 × $6.00 -
×
 Art & Science of Trend Trading Class with Jeff Bierman
1 × $6.00
Art & Science of Trend Trading Class with Jeff Bierman
1 × $6.00 -
×
 A Comparison of Twelve Technical Trading Systems with Louis Lukac
1 × $6.00
A Comparison of Twelve Technical Trading Systems with Louis Lukac
1 × $6.00 -
×
 Essentials in Quantitative Trading QT01 By HangukQuant's
1 × $23.00
Essentials in Quantitative Trading QT01 By HangukQuant's
1 × $23.00 -
×
 Foundational Chart Analysis Series: Support / Resistance Techniques of Professional Traders 6 DVD Home Study Course
1 × $54.00
Foundational Chart Analysis Series: Support / Resistance Techniques of Professional Traders 6 DVD Home Study Course
1 × $54.00 -
×
 5-Step-Trading Stocks I and II with Lex Van Dam
1 × $4.00
5-Step-Trading Stocks I and II with Lex Van Dam
1 × $4.00 -
×
 Opening Bell Income Strategy with Todd Mitchell
1 × $54.00
Opening Bell Income Strategy with Todd Mitchell
1 × $54.00 -
×
 Limitless FX Academy Course
1 × $5.00
Limitless FX Academy Course
1 × $5.00 -
×
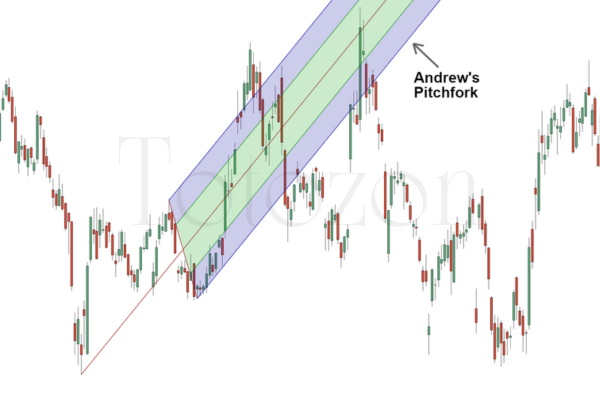 Andrews Pitchfork Basic
1 × $6.00
Andrews Pitchfork Basic
1 × $6.00 -
×
 Scalp Strategy and Flipping Small Accounts with Opes Trading Group
1 × $5.00
Scalp Strategy and Flipping Small Accounts with Opes Trading Group
1 × $5.00 -
×
 Commodities Rising: The Reality Behind the Hype and How To Really Profit in the Commodities Market - Jeffrey Christian
1 × $6.00
Commodities Rising: The Reality Behind the Hype and How To Really Profit in the Commodities Market - Jeffrey Christian
1 × $6.00 -
×
 Forex Avenger Trading System with David Curran
1 × $6.00
Forex Avenger Trading System with David Curran
1 × $6.00 -
×
 Forecast 2024 Clarification with Larry Williams
1 × $15.00
Forecast 2024 Clarification with Larry Williams
1 × $15.00 -
×
 Right Line Trading IndicatorSuite (May 2015)
1 × $31.00
Right Line Trading IndicatorSuite (May 2015)
1 × $31.00 -
×
 Forex Breakthrough Academy
1 × $31.00
Forex Breakthrough Academy
1 × $31.00 -
×
 Tenkei Trading Techniques Programme with Wilson P.Williams
1 × $6.00
Tenkei Trading Techniques Programme with Wilson P.Williams
1 × $6.00 -
×
 Alternative Beta Strategies & Hedge Fund Replication with Lars Jaeger & Jeffrey Pease
1 × $6.00
Alternative Beta Strategies & Hedge Fund Replication with Lars Jaeger & Jeffrey Pease
1 × $6.00 -
×
 Create Your Own ETF Hedge Fund: A Do-It-Yourself ETF Strategy for Private Wealth Management with David Fry
1 × $6.00
Create Your Own ETF Hedge Fund: A Do-It-Yourself ETF Strategy for Private Wealth Management with David Fry
1 × $6.00 -
×
 Sovereign Man Confidential
1 × $6.00
Sovereign Man Confidential
1 × $6.00 -
×
 ICT Prodigy Trading Course – $650K in Payouts with Alex Solignani
1 × $15.00
ICT Prodigy Trading Course – $650K in Payouts with Alex Solignani
1 × $15.00 -
×
 The Any Hour Trading System with Markets Mastered
1 × $6.00
The Any Hour Trading System with Markets Mastered
1 × $6.00 -
×
 Future Energy with Bill Paul
1 × $6.00
Future Energy with Bill Paul
1 × $6.00 -
×
 Trading With DiNapoli Levels
1 × $6.00
Trading With DiNapoli Levels
1 × $6.00 -
×
 Simpler Options - Weekly Butterflies for Income
1 × $6.00
Simpler Options - Weekly Butterflies for Income
1 × $6.00 -
×
 Advanced Course with Dimitri Wallace - Gold Minds Global
1 × $6.00
Advanced Course with Dimitri Wallace - Gold Minds Global
1 × $6.00 -
×
 The Indices Orderflow Masterclass with The Forex Scalpers
1 × $23.00
The Indices Orderflow Masterclass with The Forex Scalpers
1 × $23.00 -
×
 Market Stalkers Level 3 - Intraday Trading University
1 × $8.00
Market Stalkers Level 3 - Intraday Trading University
1 × $8.00 -
×
 Online Course - Why Wave Analysis Belongs in Every Trader's Toolbox with Jeffrey Kennedy - Elliott Wave
1 × $15.00
Online Course - Why Wave Analysis Belongs in Every Trader's Toolbox with Jeffrey Kennedy - Elliott Wave
1 × $15.00 -
×
 Day Trading Options Guide PDF with Matt Diamond
1 × $23.00
Day Trading Options Guide PDF with Matt Diamond
1 × $23.00 -
×
 Superstructure Trading - 5 DVDs + Manual + 1 BONUS DVD 2010 Live Trading Webinars with Ken Chow
1 × $6.00
Superstructure Trading - 5 DVDs + Manual + 1 BONUS DVD 2010 Live Trading Webinars with Ken Chow
1 × $6.00 -
×
 Matrix Spread Options Trading Course with Base Camp Trading
1 × $31.00
Matrix Spread Options Trading Course with Base Camp Trading
1 × $31.00 -
×
 Butterfly and Condor Workshop with Aeromir
1 × $15.00
Butterfly and Condor Workshop with Aeromir
1 × $15.00 -
×
![Robert Miner-Complete Price Tutorial Series [5 Videos (AVI)] img](https://www.totozon.com/wp-content/uploads/2024/05/Robert-Miner-Complete-Price-Tutorial-Series-5-Videos-AVI-img.png) Robert Miner-Complete Price Tutorial Series [5 Videos (AVI)]
1 × $6.00
Robert Miner-Complete Price Tutorial Series [5 Videos (AVI)]
1 × $6.00 -
×
 Activedaytrader - Workshop: Unusual Options
1 × $6.00
Activedaytrader - Workshop: Unusual Options
1 × $6.00 -
×
 The Investors Guide to Active Asset Allocation with Martin Pring
1 × $6.00
The Investors Guide to Active Asset Allocation with Martin Pring
1 × $6.00 -
×
 Core Strategy Program + Extended Learning Track with Ota Courses
1 × $124.00
Core Strategy Program + Extended Learning Track with Ota Courses
1 × $124.00 -
×
 The Orderflow Masterclass with PrimeTrading
1 × $17.00
The Orderflow Masterclass with PrimeTrading
1 × $17.00 -
×
 Investing Online for Dummies (5th Edition) with Kathleen Sindell
1 × $6.00
Investing Online for Dummies (5th Edition) with Kathleen Sindell
1 × $6.00 -
×
 Options Foundations Class
1 × $23.00
Options Foundations Class
1 × $23.00 -
×
 The Banker’s Edge Webinar & Extras
1 × $6.00
The Banker’s Edge Webinar & Extras
1 × $6.00 -
×
 High Probability ETF Trading: 7 Professional Strategies To Improve Your ETF Trading with Larry Connors
1 × $6.00
High Probability ETF Trading: 7 Professional Strategies To Improve Your ETF Trading with Larry Connors
1 × $6.00 -
×
 The Streetsmart Guide to Timing the Stock Market with Colin Alexander
1 × $6.00
The Streetsmart Guide to Timing the Stock Market with Colin Alexander
1 × $6.00 -
×
 Lessons 1-30 & Tradestation Code with Charles Drummond
1 × $6.00
Lessons 1-30 & Tradestation Code with Charles Drummond
1 × $6.00 -
×
 The Random Character of Interest Rates with Joseph Murphy
1 × $6.00
The Random Character of Interest Rates with Joseph Murphy
1 × $6.00 -
×
 Cyclic Analysis. A BreakThrough in Transaction Timing with Cyclitec Services
1 × $6.00
Cyclic Analysis. A BreakThrough in Transaction Timing with Cyclitec Services
1 × $6.00 -
×
 Kaizen On-Demand By Candle Charts
1 × $6.00
Kaizen On-Demand By Candle Charts
1 × $6.00 -
×
 Compass Trading System with Right Line Trading
1 × $39.00
Compass Trading System with Right Line Trading
1 × $39.00 -
×
 The Market Maker’s Edge with Josh Lukeman
1 × $6.00
The Market Maker’s Edge with Josh Lukeman
1 × $6.00 -
×
 The Complete Guide to Multiple Time Frame Analysis & Reading Price Action with Aiman Almansoori
1 × $13.00
The Complete Guide to Multiple Time Frame Analysis & Reading Price Action with Aiman Almansoori
1 × $13.00 -
×
 Predicting Market Trends with Alan S.Farley
1 × $6.00
Predicting Market Trends with Alan S.Farley
1 × $6.00 -
×
 Boomer Quick Profits Day Trading Course
1 × $23.00
Boomer Quick Profits Day Trading Course
1 × $23.00 -
×
 TRADING NFX Course with Andrew NFX
1 × $5.00
TRADING NFX Course with Andrew NFX
1 × $5.00 -
×
 The Cycles and The Codes with Myles Wilson-Walker
1 × $15.00
The Cycles and The Codes with Myles Wilson-Walker
1 × $15.00 -
×
 Ultimate Trading Course with Dodgy's Dungeon
1 × $8.00
Ultimate Trading Course with Dodgy's Dungeon
1 × $8.00 -
×
 The Prop Trading Code with Brannigan Barrett - Axia Futures
1 × $23.00
The Prop Trading Code with Brannigan Barrett - Axia Futures
1 × $23.00 -
×
 Mastering Momentum Gaps with Toni Hansen
1 × $6.00
Mastering Momentum Gaps with Toni Hansen
1 × $6.00 -
×
 How to Value & Sell your Business with Andrew Heslop
1 × $6.00
How to Value & Sell your Business with Andrew Heslop
1 × $6.00 -
×
 How to avoid the GAP
1 × $6.00
How to avoid the GAP
1 × $6.00 -
×
 Volatility Position Risk Management with Cynthia Kase
1 × $6.00
Volatility Position Risk Management with Cynthia Kase
1 × $6.00 -
×
 Forex Trading Course with Mike Norman
1 × $17.00
Forex Trading Course with Mike Norman
1 × $17.00 -
×
 The Great Depression with David Burg
1 × $6.00
The Great Depression with David Burg
1 × $6.00 -
×
 The Offshore Money Book with Arnold Cornez
1 × $6.00
The Offshore Money Book with Arnold Cornez
1 × $6.00 -
×
 Advances in International Investments: Traditional and Alternative Approaches with Hung-Gay Fung, Xiaoqing Eleanor Xu & Jot Yau
1 × $6.00
Advances in International Investments: Traditional and Alternative Approaches with Hung-Gay Fung, Xiaoqing Eleanor Xu & Jot Yau
1 × $6.00 -
×
 Monetary Mechanics Course 2024 with The Macro Compass
1 × $139.00
Monetary Mechanics Course 2024 with The Macro Compass
1 × $139.00 -
×
 Quantamentals - The Next Great Forefront Of Trading and Investing with Trading Markets
1 × $8.00
Quantamentals - The Next Great Forefront Of Trading and Investing with Trading Markets
1 × $8.00 -
×
 Short Term Trading. Integrated Pithfork Analysis with Dr. Mircea Dologa
1 × $6.00
Short Term Trading. Integrated Pithfork Analysis with Dr. Mircea Dologa
1 × $6.00 -
×
 FX Savages Courses Collection
1 × $7.00
FX Savages Courses Collection
1 × $7.00 -
×
 The Crash of 1997 (Article) with Hans Hannula
1 × $6.00
The Crash of 1997 (Article) with Hans Hannula
1 × $6.00 -
×
 David Weis Stock Market Update Nightly Report 2014-2019
1 × $20.00
David Weis Stock Market Update Nightly Report 2014-2019
1 × $20.00 -
×
 Investing in Corporate Bonds and Credit Risk with Frank Hagenstein
1 × $6.00
Investing in Corporate Bonds and Credit Risk with Frank Hagenstein
1 × $6.00 -
×
 Market Masters. How Traders Think Trade And Invest with Jake Bernstein
1 × $6.00
Market Masters. How Traders Think Trade And Invest with Jake Bernstein
1 × $6.00 -
×
 Oportunities in Forex Calendar Trading Patterns with Anduril Analytics
1 × $6.00
Oportunities in Forex Calendar Trading Patterns with Anduril Analytics
1 × $6.00 -
×
 LARGE CAP MOMENTUM STRATEGY with Nick Radge
1 × $179.00
LARGE CAP MOMENTUM STRATEGY with Nick Radge
1 × $179.00 -
×
 How To Read The Market Professionally with TradeSmart
1 × $27.00
How To Read The Market Professionally with TradeSmart
1 × $27.00 -
×
 SOAP. Served On A Platter CD with David Elliott
1 × $6.00
SOAP. Served On A Platter CD with David Elliott
1 × $6.00 -
×
 Forex Trading Education Program (Apr-June 2010) with Jimmy Young
1 × $6.00
Forex Trading Education Program (Apr-June 2010) with Jimmy Young
1 × $6.00 -
×
 Penny Stock Mastery
1 × $31.00
Penny Stock Mastery
1 × $31.00 -
×
 HEDGED STRATEGY SERIES IN VOLATILE MARKETS – HEDGED CREDIT SPREADS - Dan Sheridan
1 × $6.00
HEDGED STRATEGY SERIES IN VOLATILE MARKETS – HEDGED CREDIT SPREADS - Dan Sheridan
1 × $6.00 -
×
 Complete Guide to Online Stock Market Investing (2nd Edition) with Alexander Davidson
1 × $6.00
Complete Guide to Online Stock Market Investing (2nd Edition) with Alexander Davidson
1 × $6.00 -
×
 Deep Dive Butterfly Trading Strategy Class with SJG Trades
1 × $41.00
Deep Dive Butterfly Trading Strategy Class with SJG Trades
1 × $41.00 -
×
 Investment Illusions with Martin S.Fridson
1 × $6.00
Investment Illusions with Martin S.Fridson
1 × $6.00 -
×
 Ron Wagner - Creating a Profitable Trading & Investing Plan + Techniques to Perfect Your Intraday GAP
1 × $6.00
Ron Wagner - Creating a Profitable Trading & Investing Plan + Techniques to Perfect Your Intraday GAP
1 × $6.00 -
×
 Forex Libra Code Software
1 × $31.00
Forex Libra Code Software
1 × $31.00 -
×
 Master The Art of Technical Analysis with Raul Gonzalez
1 × $31.00
Master The Art of Technical Analysis with Raul Gonzalez
1 × $31.00 -
×
 Power Index Method for Profitable Futures Trading with Harold Goldberg
1 × $6.00
Power Index Method for Profitable Futures Trading with Harold Goldberg
1 × $6.00 -
×
 WealthFRX Trading Mastery Course 2.0
1 × $5.00
WealthFRX Trading Mastery Course 2.0
1 × $5.00 -
×
 The HV7 Option Trading System with Amy Meissner – Aeromir
1 × $8.00
The HV7 Option Trading System with Amy Meissner – Aeromir
1 × $8.00 -
×
 Your Next Great Stock: How to Screen the Market for Tomorrow's Top Performers with Jack Hough
1 × $6.00
Your Next Great Stock: How to Screen the Market for Tomorrow's Top Performers with Jack Hough
1 × $6.00 -
×
 Wyckoff Unleashed Official Online Course (2018) with Wyckoffsmi
1 × $23.00
Wyckoff Unleashed Official Online Course (2018) with Wyckoffsmi
1 × $23.00 -
×
 Fibonacci – CCI Workshop Recording Series (2006 & 2008)
1 × $6.00
Fibonacci – CCI Workshop Recording Series (2006 & 2008)
1 × $6.00 -
×
 The Naked Eye: Raw Data Analytics with Edgar Torres - Raw Data Analytics
1 × $8.00
The Naked Eye: Raw Data Analytics with Edgar Torres - Raw Data Analytics
1 × $8.00
 with Arthur A.Hill")
Introduction to Candlestick (Article) with Arthur A.Hill
$6.00
File Size: Coming soon!
Delivery Time: 1–12 hours
Media Type: Online Course
Content Proof: Watch Here!
You may check content proof of “Introduction to Candlestick (Article) with Arthur A.Hill” below:
 with Arthur A.Hill")
Introduction to Candlestick (Article) with Arthur A. Hill
Candlestick charting is an essential tool for traders and investors, providing a visual representation of price movements. Arthur A. Hill, a renowned expert in technical analysis, offers a comprehensive introduction to candlestick charts, making them accessible to beginners and valuable for experienced traders. Let’s explore the basics of candlestick charting and how it can enhance your trading strategy.
What is a Candlestick Chart?
A candlestick chart is a type of financial chart used to describe price movements of a security, derivative, or currency.
Components of a Candlestick
- Body: The thick part of the candlestick, showing the opening and closing prices.
- Wicks/Shadows: The thin lines above and below the body, indicating the highest and lowest prices during the period.
- Color: Traditionally, a green or white body indicates a closing price higher than the opening price, while a red or black body indicates a closing price lower than the opening price.
History of Candlestick Charting
Candlestick charting originated in Japan over 300 years ago, developed by rice traders to track market prices and daily supply and demand.
Evolution of Candlestick Charts
Over the centuries, candlestick charting has evolved and gained popularity worldwide, becoming a staple in technical analysis.
Introduction to Western Markets
Candlestick charts were introduced to the Western financial markets in the late 20th century and quickly became popular among traders.
Advantages of Candlestick Charts
Candlestick charts offer several advantages over traditional bar charts and line charts.
Visual Clarity
Candlestick charts provide a clear and concise representation of price movements, making it easier to interpret market trends.
Immediate Insight
The color-coded bodies and wicks offer immediate insight into market sentiment and price direction.
Pattern Recognition
Candlestick charts are excellent for identifying patterns that can predict future price movements.
Common Candlestick Patterns
- Doji: Indicates indecision in the market.
- Hammer: Suggests a potential reversal from a downtrend.
- Engulfing: A strong signal of a potential trend reversal.
Basic Candlestick Patterns
Understanding basic candlestick patterns is crucial for any trader looking to use this charting method effectively.
Bullish Patterns
Bullish patterns indicate potential upward price movements.
Hammer and Inverted Hammer
- Hammer: A candlestick with a small body and a long lower wick, indicating potential reversal from a downtrend.
- Inverted Hammer: Similar to the hammer but with a long upper wick, suggesting a potential bullish reversal.
Bearish Patterns
Bearish patterns suggest potential downward price movements.
Shooting Star and Hanging Man
- Shooting Star: A candlestick with a small body and a long upper wick, indicating a potential reversal from an uptrend.
- Hanging Man: Similar to the hammer but occurs after an uptrend, signaling a potential bearish reversal.
Advanced Candlestick Patterns
For more experienced traders, advanced candlestick patterns provide deeper insights into market trends.
Engulfing Patterns
Engulfing patterns occur when a smaller candlestick is followed by a larger candlestick that completely engulfs the smaller one.
Bullish Engulfing
A bullish engulfing pattern occurs at the bottom of a downtrend and signals a potential upward reversal.
Bearish Engulfing
A bearish engulfing pattern appears at the top of an uptrend and suggests a potential downward reversal.
Morning Star and Evening Star
These patterns are three-candlestick formations that indicate strong trend reversals.
Morning Star
The morning star pattern consists of a bearish candle, a small indecisive candle, and a bullish candle, indicating a bullish reversal.
Evening Star
The evening star pattern includes a bullish candle, a small indecisive candle, and a bearish candle, suggesting a bearish reversal.
Incorporating Candlestick Charts into Your Trading Strategy
Candlestick charts are versatile and can be integrated into various trading strategies.
Combining with Other Indicators
Enhance the effectiveness of candlestick charts by combining them with other technical indicators.
Popular Indicators to Combine
- Moving Averages: Confirm trends and potential reversals.
- Relative Strength Index (RSI): Identify overbought or oversold conditions.
- Bollinger Bands: Measure market volatility and potential breakouts.
Setting Up Your Trading Platform
Most trading platforms offer candlestick charting options. Ensure you customize your charts to suit your trading style.
Customization Tips
- Time Frames: Choose appropriate time frames for your trading strategy.
- Color Schemes: Use distinct colors for bullish and bearish candles.
- Indicators: Add complementary indicators to your charts.
Common Mistakes to Avoid
Even with a robust understanding of candlestick charts, traders can make mistakes that affect their performance.
Over-reliance on Patterns
Relying solely on candlestick patterns without considering other factors can lead to false signals.
Diversify Analysis
Always use candlestick patterns in conjunction with other forms of analysis and market indicators.
Ignoring Market Context
Candlestick patterns can be misleading if not considered within the broader market context.
Comprehensive Analysis
Incorporate fundamental analysis and overall market trends to validate candlestick signals.
Conclusion
Candlestick charting, as introduced by Arthur A. Hill, offers a powerful tool for traders to understand and predict market movements. By mastering basic and advanced patterns, combining them with other technical indicators, and avoiding common pitfalls, traders can enhance their market analysis and trading performance. Whether you’re new to trading or an experienced trader, candlestick charts provide valuable insights that can guide your investment decisions.
Frequently Asked Questions:
- What is a candlestick chart?
A candlestick chart is a type of financial chart used to represent price movements over a specific period, showing the opening, closing, high, and low prices. - Why are candlestick charts popular among traders?
They provide visual clarity and help in identifying patterns that can predict future price movements. - What are some basic candlestick patterns?
Basic patterns include the hammer, inverted hammer, shooting star, and hanging man, which indicate potential market reversals. - Can candlestick charts be used with other technical indicators?
Yes, combining candlestick charts with indicators like moving averages, RSI, and Bollinger Bands enhances their effectiveness. - How can I avoid common mistakes when using candlestick charts?
Avoid over-relying on patterns and always consider the broader market context and other forms of analysis.
Be the first to review “Introduction to Candlestick (Article) with Arthur A.Hill”
You must be logged in to post a review.
Related products
Original price was: $1,200.00.$23.00Current price is: $23.00.
Forex Trading
Original price was: $850.00.$23.00Current price is: $23.00.

Forex Trading
Original price was: $797.00.$10.00Current price is: $10.00.

Forex Trading
Original price was: $550.00.$5.00Current price is: $5.00.

Original price was: $1,800.00.$54.00Current price is: $54.00.
Original price was: $450.00.$23.00Current price is: $23.00.

Forex Trading
Original price was: $999.00.$15.00Current price is: $15.00.

Original price was: $299.00.$8.00Current price is: $8.00.

Original price was: $4,995.00.$15.00Current price is: $15.00.
Forex Trading
Original price was: $500.00.$5.00Current price is: $5.00.

Original price was: $799.00.$15.00Current price is: $15.00.

Original price was: $497.00.$11.00Current price is: $11.00.
Forex Trading
Original price was: $249.00.$15.00Current price is: $15.00.

Original price was: $649.00.$20.00Current price is: $20.00.
Original price was: $997.00.$8.00Current price is: $8.00.
Original price was: $497.00.$31.00Current price is: $31.00.
Original price was: $999.00.$5.00Current price is: $5.00.

Original price was: $139.00.$23.00Current price is: $23.00.
Forex Trading
Original price was: $125.00.$17.00Current price is: $17.00.

Forex Trading
Original price was: $499.00.$15.00Current price is: $15.00.

Reviews
There are no reviews yet.