-
×
 Beginner's Guide to Ratio Butterflys Class with Don Kaufman
1 × $6.00
Beginner's Guide to Ratio Butterflys Class with Don Kaufman
1 × $6.00 -
×
 Warrior Trading: Inside the Mind of an Elite Currency Trader with Clifford Bennett
1 × $6.00
Warrior Trading: Inside the Mind of an Elite Currency Trader with Clifford Bennett
1 × $6.00 -
×
 Options Mastery 32 DVDs
1 × $6.00
Options Mastery 32 DVDs
1 × $6.00 -
×
 How To Backtest Bootcamp
1 × $17.00
How To Backtest Bootcamp
1 × $17.00 -
×
 Vertex Investing Course
1 × $6.00
Vertex Investing Course
1 × $6.00 -
×
 Ichimokutrade - Elliot Wave 101
1 × $15.00
Ichimokutrade - Elliot Wave 101
1 × $15.00 -
×
 Virtual Intensive Trader Training
1 × $31.00
Virtual Intensive Trader Training
1 × $31.00 -
×
 The Naked Eye: Raw Data Analytics with Edgar Torres - Raw Data Analytics
1 × $8.00
The Naked Eye: Raw Data Analytics with Edgar Torres - Raw Data Analytics
1 × $8.00 -
×
 MT4 High Probability Forex Trading Method
1 × $6.00
MT4 High Probability Forex Trading Method
1 × $6.00 -
×
 Seven Trading Systems for The S&P Futures with David Bean
1 × $6.00
Seven Trading Systems for The S&P Futures with David Bean
1 × $6.00 -
×
 After Hour Trading Made Easy with Joe Duarte & Roland Burke
1 × $6.00
After Hour Trading Made Easy with Joe Duarte & Roland Burke
1 × $6.00 -
×
 How to Collect Income Being Short with Don Kaufman
1 × $6.00
How to Collect Income Being Short with Don Kaufman
1 × $6.00 -
×
 Vom Einsteiger zum Mastertrader 2.0 with Mehrwert Garantier
1 × $109.00
Vom Einsteiger zum Mastertrader 2.0 with Mehrwert Garantier
1 × $109.00 -
×
 Building Automated Trading Systems C++.NET with Benjamin Van Vliet
1 × $6.00
Building Automated Trading Systems C++.NET with Benjamin Van Vliet
1 × $6.00 -
×
 Trade with Precision Price Action Course Silver+Bronze By Nick McDonald
1 × $116.00
Trade with Precision Price Action Course Silver+Bronze By Nick McDonald
1 × $116.00 -
×
 Master Trader - Advander Management Strategies
1 × $39.00
Master Trader - Advander Management Strategies
1 × $39.00 -
×
 Market Forecasting. Stocks and Grain
1 × $6.00
Market Forecasting. Stocks and Grain
1 × $6.00 -
×
 Options Foundations Class
1 × $23.00
Options Foundations Class
1 × $23.00 -
×
 Fig Combo Course
1 × $5.00
Fig Combo Course
1 × $5.00 -
×
 Spread Trading E-Trading Stagionale (Italian) with Joe Ross
1 × $6.00
Spread Trading E-Trading Stagionale (Italian) with Joe Ross
1 × $6.00 -
×
 Activedaytrader - Workshop Options For Income
1 × $15.00
Activedaytrader - Workshop Options For Income
1 × $15.00 -
×
 The Inner Circle Seminar
1 × $15.00
The Inner Circle Seminar
1 × $15.00 -
×
 EFT – The Art of Delivery with Gary Craig
1 × $5.00
EFT – The Art of Delivery with Gary Craig
1 × $5.00 -
×
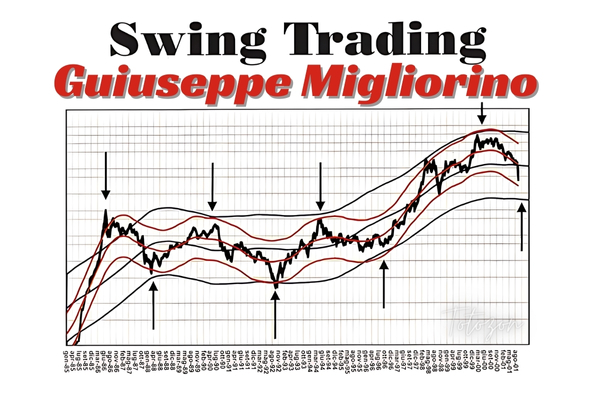 Swing Trading (Italian) with Guiuseppe Migliorino
1 × $6.00
Swing Trading (Italian) with Guiuseppe Migliorino
1 × $6.00 -
×
 The Complete Guide to Multiple Time Frame Analysis & Reading Price Action with Aiman Almansoori
1 × $13.00
The Complete Guide to Multiple Time Frame Analysis & Reading Price Action with Aiman Almansoori
1 × $13.00 -
×
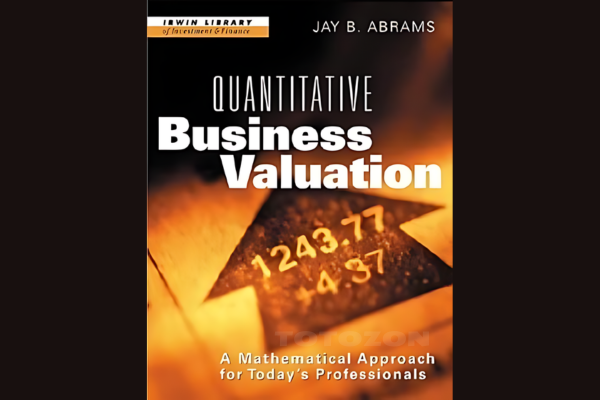 Quantitative Business Valuation with Jay Abrams
1 × $6.00
Quantitative Business Valuation with Jay Abrams
1 × $6.00 -
×
 Forecast 2024 Clarification with Larry Williams
1 × $15.00
Forecast 2024 Clarification with Larry Williams
1 × $15.00 -
×
 How To Flip All Those “Hard To Flip” Deals
1 × $6.00
How To Flip All Those “Hard To Flip” Deals
1 × $6.00 -
×
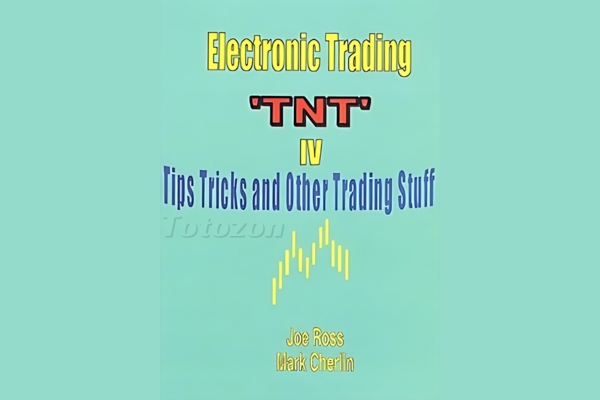 Electronic Trading "TNT" IV Tips Tricks and Other Trading Stuff with Joe Ross & Mark Cherlin
1 × $6.00
Electronic Trading "TNT" IV Tips Tricks and Other Trading Stuff with Joe Ross & Mark Cherlin
1 × $6.00 -
×
 Pablo Order Flow Education with Pablo
1 × $6.00
Pablo Order Flow Education with Pablo
1 × $6.00 -
×
 Market Controller Course with Controller FX
1 × $5.00
Market Controller Course with Controller FX
1 × $5.00 -
×
 WealthFRX Trading Mastery Course 2.0
1 × $5.00
WealthFRX Trading Mastery Course 2.0
1 × $5.00 -
×
 Module IV - Day Trading to Short Term Swing Trades with FX MindShift
1 × $6.00
Module IV - Day Trading to Short Term Swing Trades with FX MindShift
1 × $6.00 -
×
 Futures Trading Blueprint with Day Trader Next Door
1 × $5.00
Futures Trading Blueprint with Day Trader Next Door
1 × $5.00 -
×
 Forex Strategy Course with Angel Traders
1 × $6.00
Forex Strategy Course with Angel Traders
1 × $6.00 -
×
 Home Run Options Trading Course with Dave Aquino - Base Camp Trading
1 × $11.00
Home Run Options Trading Course with Dave Aquino - Base Camp Trading
1 × $11.00 -
×
 Lazy Emini Trader Master Class
1 × $15.00
Lazy Emini Trader Master Class
1 × $15.00 -
×
 War Room Technicals Vol. 4 with Pat Mitchell – Trick Trades
1 × $6.00
War Room Technicals Vol. 4 with Pat Mitchell – Trick Trades
1 × $6.00 -
×
 War Room Technicals Volume 2 with Pat Mitchell – Trick Trades
1 × $6.00
War Room Technicals Volume 2 with Pat Mitchell – Trick Trades
1 × $6.00 -
×
 Code 6 + 7 Course with Oil Trading Academy
1 × $41.00
Code 6 + 7 Course with Oil Trading Academy
1 × $41.00 -
×
 Trading Calendar Spreads with Option Pit
1 × $39.00
Trading Calendar Spreads with Option Pit
1 × $39.00 -
×
 Dan Sheridan 360 Degrees of Trading Class
1 × $6.00
Dan Sheridan 360 Degrees of Trading Class
1 × $6.00 -
×
 The Complete Guide to Option Selling, 2nd 2009 with James Cordier & Michael Gross
1 × $6.00
The Complete Guide to Option Selling, 2nd 2009 with James Cordier & Michael Gross
1 × $6.00 -
×
 AstroScan Regulus 4.1E newastro.net
1 × $6.00
AstroScan Regulus 4.1E newastro.net
1 × $6.00 -
×
 Handbook of Integral Equations with Andrei D.Polyanin, Alexander V.Manzhirov
1 × $6.00
Handbook of Integral Equations with Andrei D.Polyanin, Alexander V.Manzhirov
1 × $6.00 -
×
 Scalp Strategy and Flipping Small Accounts with Opes Trading Group
1 × $5.00
Scalp Strategy and Flipping Small Accounts with Opes Trading Group
1 × $5.00 -
×
 CrewFX Group Course Package with Language Of The Markets
1 × $6.00
CrewFX Group Course Package with Language Of The Markets
1 × $6.00 -
×
 The Next Big Short Class (Risk Twist Spreads) Class with Don Kaufman
1 × $6.00
The Next Big Short Class (Risk Twist Spreads) Class with Don Kaufman
1 × $6.00 -
×
 W. D Gann 's Square Of 9 Applied To Modern Markets with Sean Avidar - Hexatrade350
1 × $23.00
W. D Gann 's Square Of 9 Applied To Modern Markets with Sean Avidar - Hexatrade350
1 × $23.00 -
×
 Market Energy Trader with Top Trade Tools
1 × $5.00
Market Energy Trader with Top Trade Tools
1 × $5.00 -
×
 Yin Yang Forex Training Program
1 × $85.00
Yin Yang Forex Training Program
1 × $85.00 -
×
 Practical Speculation with Victor Niederhoffer, Laurel Kenner
1 × $6.00
Practical Speculation with Victor Niederhoffer, Laurel Kenner
1 × $6.00 -
×
 Inside the Minds Leading Wall Street Investors with Aspatore Books
1 × $6.00
Inside the Minds Leading Wall Street Investors with Aspatore Books
1 × $6.00 -
×
 Complete Series
1 × $31.00
Complete Series
1 × $31.00 -
×
 Double Your Capital In 30 Days(2016) with GFA Flips
1 × $5.00
Double Your Capital In 30 Days(2016) with GFA Flips
1 × $5.00 -
×
 Price Action Room - The Scalper’s Boot Camp
1 × $15.00
Price Action Room - The Scalper’s Boot Camp
1 × $15.00 -
×
 Long/Short Market Dynamics: Trading Strategies for Today's Markets with Clive Corcoran
1 × $6.00
Long/Short Market Dynamics: Trading Strategies for Today's Markets with Clive Corcoran
1 × $6.00 -
×
 The 4 Horsemen CD with David Elliott
1 × $6.00
The 4 Horsemen CD with David Elliott
1 × $6.00 -
×
 Backtrade Marathon NEW with Real Life Trading
1 × $23.00
Backtrade Marathon NEW with Real Life Trading
1 × $23.00 -
×
 Advanced Trader with Nikos Trading Academy
1 × $5.00
Advanced Trader with Nikos Trading Academy
1 × $5.00 -
×
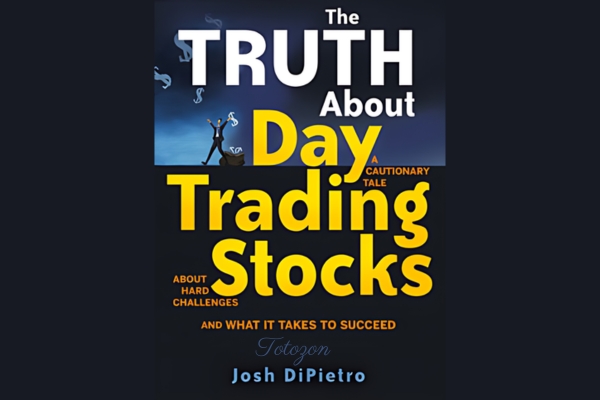 The Truth About Day Trading Stocks with Josh DiPietro
1 × $6.00
The Truth About Day Trading Stocks with Josh DiPietro
1 × $6.00 -
×
 Advanced Iron Condors, Trading Concepts with Todd Mitchell
1 × $31.00
Advanced Iron Condors, Trading Concepts with Todd Mitchell
1 × $31.00 -
×
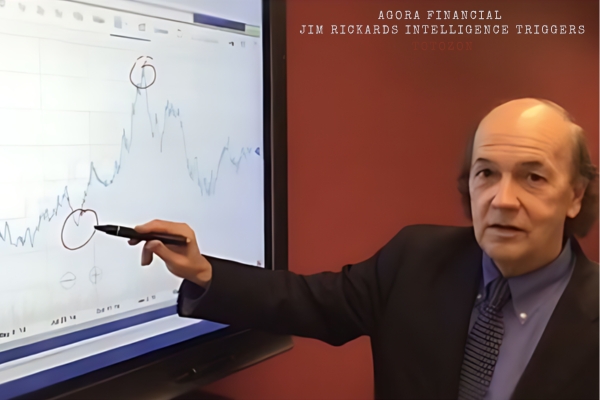 Jim Rickards Intelligence Triggers with Agora Financial
1 × $5.00
Jim Rickards Intelligence Triggers with Agora Financial
1 × $5.00 -
×
 WITS Turbo Seminars with Brian James Sklenka
1 × $6.00
WITS Turbo Seminars with Brian James Sklenka
1 × $6.00 -
×
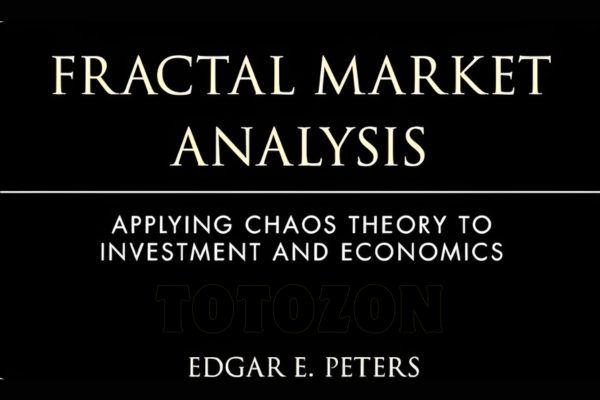 Fractal Market Analysis with Edgar Peters
1 × $6.00
Fractal Market Analysis with Edgar Peters
1 × $6.00 -
×
 Stock Market 101 with Sabrina Peterson
1 × $4.00
Stock Market 101 with Sabrina Peterson
1 × $4.00 -
×
 Monthly Income with Short Strangles, Dan's Way - Dan Sheridan - Sheridan Options Mentoring
1 × $69.00
Monthly Income with Short Strangles, Dan's Way - Dan Sheridan - Sheridan Options Mentoring
1 × $69.00 -
×
 FX GOAT NASDAQ COURSE 2.0
1 × $13.00
FX GOAT NASDAQ COURSE 2.0
1 × $13.00 -
×
 Short Swing Trading v6.0 with David Smith
1 × $6.00
Short Swing Trading v6.0 with David Smith
1 × $6.00 -
×
 Learn To Fish Part II - Generating Consistent Income Through Day Trading with Daniel
1 × $6.00
Learn To Fish Part II - Generating Consistent Income Through Day Trading with Daniel
1 × $6.00 -
×
 Master Time Factor & Forecasting with Mathematical Rules
1 × $6.00
Master Time Factor & Forecasting with Mathematical Rules
1 × $6.00 -
×
 Trading Floor Training
1 × $6.00
Trading Floor Training
1 × $6.00 -
×
 Futures Foundation Program with SMS Capital
1 × $101.00
Futures Foundation Program with SMS Capital
1 × $101.00 -
×
 Investing In Fixer-Uppers 2003 with Jay DeCima
1 × $6.00
Investing In Fixer-Uppers 2003 with Jay DeCima
1 × $6.00 -
×
 Learn To Fish Part III - How To Swing Trade for Consistent Gains with Daniel
1 × $15.00
Learn To Fish Part III - How To Swing Trade for Consistent Gains with Daniel
1 × $15.00 -
×
 Algo Trading Masterclass with Ali Casey - StatOasis
1 × $23.00
Algo Trading Masterclass with Ali Casey - StatOasis
1 × $23.00 -
×
 Day Trading with Lines in the Sky By R.L.Muehlberg
1 × $6.00
Day Trading with Lines in the Sky By R.L.Muehlberg
1 × $6.00 -
×
 IBD Advanced Buying Strategies Home Study Program
1 × $10.00
IBD Advanced Buying Strategies Home Study Program
1 × $10.00 -
×
 Becoming a Disciplined Trader: Techniques for Achieving Peak Trading Performance with Ari Kiev
1 × $6.00
Becoming a Disciplined Trader: Techniques for Achieving Peak Trading Performance with Ari Kiev
1 × $6.00 -
×
 Iron Condors in a Volatile Market 2022 with Dan Sheridan - Sheridan Options Mentoring
1 × $46.00
Iron Condors in a Volatile Market 2022 with Dan Sheridan - Sheridan Options Mentoring
1 × $46.00 -
×
 Price Action Trading Manual 2010
1 × $6.00
Price Action Trading Manual 2010
1 × $6.00 -
×
 Options, Futures & Other Derivatives . Solutions Manual
1 × $6.00
Options, Futures & Other Derivatives . Solutions Manual
1 × $6.00 -
×
 Activedaytrader - Elite Earnings Pusuit
1 × $54.00
Activedaytrader - Elite Earnings Pusuit
1 × $54.00 -
×
 Wyckoff 2.0: Structures, Volume Profile and Order Flow (Trading and Investing Course: Advanced Technical Analysis) by Rubén Villahermosa
1 × $5.00
Wyckoff 2.0: Structures, Volume Profile and Order Flow (Trading and Investing Course: Advanced Technical Analysis) by Rubén Villahermosa
1 × $5.00 -
×
 The Indices Orderflow Masterclass with The Forex Scalpers
1 × $23.00
The Indices Orderflow Masterclass with The Forex Scalpers
1 × $23.00 -
×
 The Heart Friendly Butterfly Options Trading System Four Part Video Series with Seth Freudberg
1 × $78.00
The Heart Friendly Butterfly Options Trading System Four Part Video Series with Seth Freudberg
1 × $78.00 -
×
 The Ultimate Forex Structure Course
1 × $31.00
The Ultimate Forex Structure Course
1 × $31.00 -
×
 Alternative Beta Strategies & Hedge Fund Replication with Lars Jaeger & Jeffrey Pease
1 × $6.00
Alternative Beta Strategies & Hedge Fund Replication with Lars Jaeger & Jeffrey Pease
1 × $6.00 -
×
 The Psychology Of Trading with Brett N.Steenbarger
1 × $6.00
The Psychology Of Trading with Brett N.Steenbarger
1 × $6.00 -
×
 Best of the Best: Collars with Amy Meissner & Scott Ruble
1 × $15.00
Best of the Best: Collars with Amy Meissner & Scott Ruble
1 × $15.00 -
×
 Carter FX 2.0 with CFX University
1 × $5.00
Carter FX 2.0 with CFX University
1 × $5.00 -
×
 Naked Put Selling Acquiring Blue Chip Stocks and Creating Cash Flow with Lee Lowell
1 × $6.00
Naked Put Selling Acquiring Blue Chip Stocks and Creating Cash Flow with Lee Lowell
1 × $6.00 -
×
 Street Smarts & TS Code with Larry Connors & Linda Bradford Rashcke
1 × $6.00
Street Smarts & TS Code with Larry Connors & Linda Bradford Rashcke
1 × $6.00 -
×
 How To Build An Automated Trading Robot In Excel with Peter Titus - Marwood Research
1 × $15.00
How To Build An Automated Trading Robot In Excel with Peter Titus - Marwood Research
1 × $15.00 -
×
 Detecting Trend Direction & Strength (Article) with Barbara Star
1 × $6.00
Detecting Trend Direction & Strength (Article) with Barbara Star
1 × $6.00 -
×
 Your Next Great Stock: How to Screen the Market for Tomorrow's Top Performers with Jack Hough
1 × $6.00
Your Next Great Stock: How to Screen the Market for Tomorrow's Top Performers with Jack Hough
1 × $6.00 -
×
 Day Trading Freedom Course & Members Area Videos
1 × $6.00
Day Trading Freedom Course & Members Area Videos
1 × $6.00 -
×
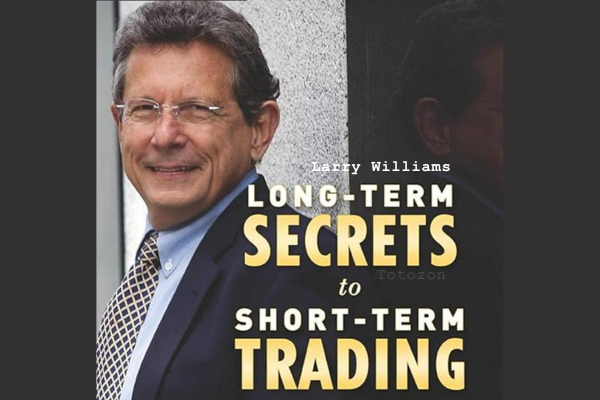 Secrets to Short Term Trading with Larry Williams
1 × $6.00
Secrets to Short Term Trading with Larry Williams
1 × $6.00 -
×
 Trading with Wave59 with Earik Beann
1 × $6.00
Trading with Wave59 with Earik Beann
1 × $6.00 -
×
 Gillen Predicts with Jack Gillen
1 × $6.00
Gillen Predicts with Jack Gillen
1 × $6.00 -
×
 Advanced Spread Trading with Guy Bower - MasterClass Trader
1 × $15.00
Advanced Spread Trading with Guy Bower - MasterClass Trader
1 × $15.00 -
×
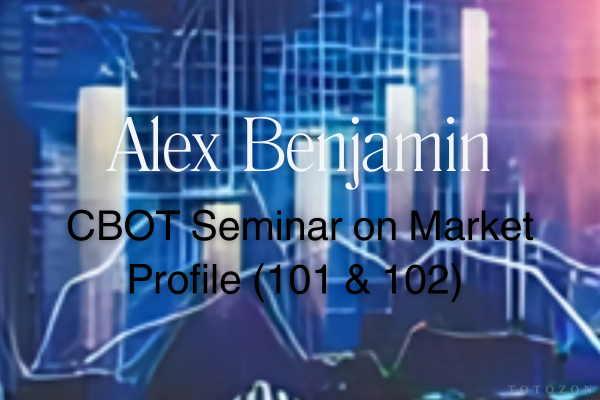 CBOT Seminar on Market Profile (101 & 102) with Alex Benjamin
1 × $6.00
CBOT Seminar on Market Profile (101 & 102) with Alex Benjamin
1 × $6.00 -
×
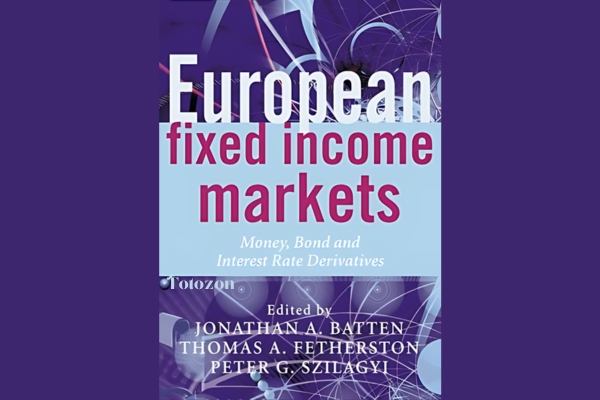 European Fixed Income Markets with Jonathan Batten
1 × $6.00
European Fixed Income Markets with Jonathan Batten
1 × $6.00 -
×
 Month 01 to 08 2018
1 × $62.00
Month 01 to 08 2018
1 × $62.00 -
×
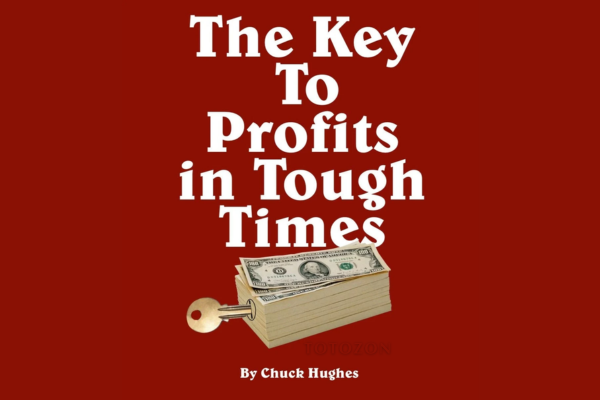 The Key to Profits in Tough Times
1 × $6.00
The Key to Profits in Tough Times
1 × $6.00
 with Arthur A.Hill")
Introduction to Candlestick (Article) with Arthur A.Hill
$6.00
File Size: Coming soon!
Delivery Time: 1–12 hours
Media Type: Online Course
Content Proof: Watch Here!
You may check content proof of “Introduction to Candlestick (Article) with Arthur A.Hill” below:
 with Arthur A.Hill")
Introduction to Candlestick (Article) with Arthur A. Hill
Candlestick charting is an essential tool for traders and investors, providing a visual representation of price movements. Arthur A. Hill, a renowned expert in technical analysis, offers a comprehensive introduction to candlestick charts, making them accessible to beginners and valuable for experienced traders. Let’s explore the basics of candlestick charting and how it can enhance your trading strategy.
What is a Candlestick Chart?
A candlestick chart is a type of financial chart used to describe price movements of a security, derivative, or currency.
Components of a Candlestick
- Body: The thick part of the candlestick, showing the opening and closing prices.
- Wicks/Shadows: The thin lines above and below the body, indicating the highest and lowest prices during the period.
- Color: Traditionally, a green or white body indicates a closing price higher than the opening price, while a red or black body indicates a closing price lower than the opening price.
History of Candlestick Charting
Candlestick charting originated in Japan over 300 years ago, developed by rice traders to track market prices and daily supply and demand.
Evolution of Candlestick Charts
Over the centuries, candlestick charting has evolved and gained popularity worldwide, becoming a staple in technical analysis.
Introduction to Western Markets
Candlestick charts were introduced to the Western financial markets in the late 20th century and quickly became popular among traders.
Advantages of Candlestick Charts
Candlestick charts offer several advantages over traditional bar charts and line charts.
Visual Clarity
Candlestick charts provide a clear and concise representation of price movements, making it easier to interpret market trends.
Immediate Insight
The color-coded bodies and wicks offer immediate insight into market sentiment and price direction.
Pattern Recognition
Candlestick charts are excellent for identifying patterns that can predict future price movements.
Common Candlestick Patterns
- Doji: Indicates indecision in the market.
- Hammer: Suggests a potential reversal from a downtrend.
- Engulfing: A strong signal of a potential trend reversal.
Basic Candlestick Patterns
Understanding basic candlestick patterns is crucial for any trader looking to use this charting method effectively.
Bullish Patterns
Bullish patterns indicate potential upward price movements.
Hammer and Inverted Hammer
- Hammer: A candlestick with a small body and a long lower wick, indicating potential reversal from a downtrend.
- Inverted Hammer: Similar to the hammer but with a long upper wick, suggesting a potential bullish reversal.
Bearish Patterns
Bearish patterns suggest potential downward price movements.
Shooting Star and Hanging Man
- Shooting Star: A candlestick with a small body and a long upper wick, indicating a potential reversal from an uptrend.
- Hanging Man: Similar to the hammer but occurs after an uptrend, signaling a potential bearish reversal.
Advanced Candlestick Patterns
For more experienced traders, advanced candlestick patterns provide deeper insights into market trends.
Engulfing Patterns
Engulfing patterns occur when a smaller candlestick is followed by a larger candlestick that completely engulfs the smaller one.
Bullish Engulfing
A bullish engulfing pattern occurs at the bottom of a downtrend and signals a potential upward reversal.
Bearish Engulfing
A bearish engulfing pattern appears at the top of an uptrend and suggests a potential downward reversal.
Morning Star and Evening Star
These patterns are three-candlestick formations that indicate strong trend reversals.
Morning Star
The morning star pattern consists of a bearish candle, a small indecisive candle, and a bullish candle, indicating a bullish reversal.
Evening Star
The evening star pattern includes a bullish candle, a small indecisive candle, and a bearish candle, suggesting a bearish reversal.
Incorporating Candlestick Charts into Your Trading Strategy
Candlestick charts are versatile and can be integrated into various trading strategies.
Combining with Other Indicators
Enhance the effectiveness of candlestick charts by combining them with other technical indicators.
Popular Indicators to Combine
- Moving Averages: Confirm trends and potential reversals.
- Relative Strength Index (RSI): Identify overbought or oversold conditions.
- Bollinger Bands: Measure market volatility and potential breakouts.
Setting Up Your Trading Platform
Most trading platforms offer candlestick charting options. Ensure you customize your charts to suit your trading style.
Customization Tips
- Time Frames: Choose appropriate time frames for your trading strategy.
- Color Schemes: Use distinct colors for bullish and bearish candles.
- Indicators: Add complementary indicators to your charts.
Common Mistakes to Avoid
Even with a robust understanding of candlestick charts, traders can make mistakes that affect their performance.
Over-reliance on Patterns
Relying solely on candlestick patterns without considering other factors can lead to false signals.
Diversify Analysis
Always use candlestick patterns in conjunction with other forms of analysis and market indicators.
Ignoring Market Context
Candlestick patterns can be misleading if not considered within the broader market context.
Comprehensive Analysis
Incorporate fundamental analysis and overall market trends to validate candlestick signals.
Conclusion
Candlestick charting, as introduced by Arthur A. Hill, offers a powerful tool for traders to understand and predict market movements. By mastering basic and advanced patterns, combining them with other technical indicators, and avoiding common pitfalls, traders can enhance their market analysis and trading performance. Whether you’re new to trading or an experienced trader, candlestick charts provide valuable insights that can guide your investment decisions.
Frequently Asked Questions:
- What is a candlestick chart?
A candlestick chart is a type of financial chart used to represent price movements over a specific period, showing the opening, closing, high, and low prices. - Why are candlestick charts popular among traders?
They provide visual clarity and help in identifying patterns that can predict future price movements. - What are some basic candlestick patterns?
Basic patterns include the hammer, inverted hammer, shooting star, and hanging man, which indicate potential market reversals. - Can candlestick charts be used with other technical indicators?
Yes, combining candlestick charts with indicators like moving averages, RSI, and Bollinger Bands enhances their effectiveness. - How can I avoid common mistakes when using candlestick charts?
Avoid over-relying on patterns and always consider the broader market context and other forms of analysis.
Be the first to review “Introduction to Candlestick (Article) with Arthur A.Hill”
You must be logged in to post a review.
Related products

Original price was: $700.00.$39.00Current price is: $39.00.

Original price was: $1,849.00.$15.00Current price is: $15.00.

Forex Trading
Original price was: $499.00.$15.00Current price is: $15.00.

Original price was: $299.00.$8.00Current price is: $8.00.

Original price was: $695.00.$41.00Current price is: $41.00.
Original price was: $799.00.$15.00Current price is: $15.00.

Forex Trading
Original price was: $2,995.00.$31.00Current price is: $31.00.

Forex Trading
Original price was: $239.00.$8.00Current price is: $8.00.
Original price was: $999.00.$5.00Current price is: $5.00.
Original price was: $497.00.$11.00Current price is: $11.00.

Original price was: $310.00.$23.00Current price is: $23.00.

Forex Trading
Original price was: $2,997.00.$23.00Current price is: $23.00.

Original price was: $2,120.00.$15.00Current price is: $15.00.

Original price was: $1,200.00.$23.00Current price is: $23.00.
Original price was: $895.00.$15.00Current price is: $15.00.

Forex Trading
Original price was: $125.00.$17.00Current price is: $17.00.

Forex Trading
Original price was: $4,997.00.$27.00Current price is: $27.00.

Forex Trading
Original price was: $999.00.$15.00Current price is: $15.00.

Original price was: $649.00.$20.00Current price is: $20.00.
Original price was: $450.00.$23.00Current price is: $23.00.

Reviews
There are no reviews yet.