-
×
 Quantamentals - The Next Great Forefront Of Trading and Investing with Trading Markets
1 × $8.00
Quantamentals - The Next Great Forefront Of Trading and Investing with Trading Markets
1 × $8.00 -
×
 The Trading Blueprint with Brad Goh - The Trading Geek
1 × $5.00
The Trading Blueprint with Brad Goh - The Trading Geek
1 × $5.00 -
×
 The Crypto Code with Joel Peterson - Adam Short
1 × $15.00
The Crypto Code with Joel Peterson - Adam Short
1 × $15.00 -
×
 Cash Flow Investing Course
1 × $20.00
Cash Flow Investing Course
1 × $20.00 -
×
 Butterfly and Condor Workshop with Aeromir
1 × $15.00
Butterfly and Condor Workshop with Aeromir
1 × $15.00 -
×
 Swing Trading Futures & Commodities with the COT
1 × $93.00
Swing Trading Futures & Commodities with the COT
1 × $93.00 -
×
 Practical Applications of Candlestick Charts with Gary Wagner
1 × $6.00
Practical Applications of Candlestick Charts with Gary Wagner
1 × $6.00 -
×
 Algo Trading Masterclass with Ali Casey - StatOasis
1 × $23.00
Algo Trading Masterclass with Ali Casey - StatOasis
1 × $23.00 -
×
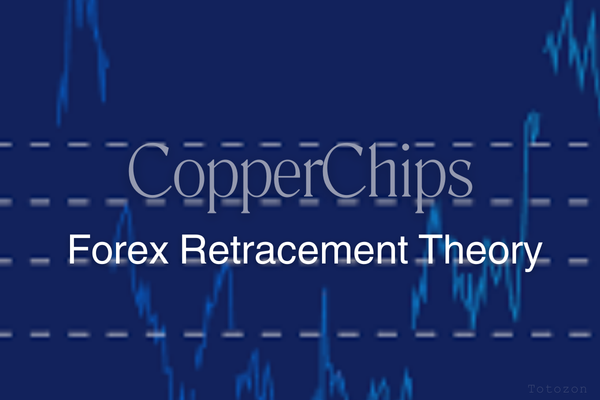 Forex Retracement Theory with CopperChips
1 × $6.00
Forex Retracement Theory with CopperChips
1 × $6.00 -
×
 8 Strategies for Day Trading
1 × $31.00
8 Strategies for Day Trading
1 × $31.00 -
×
 An Introduction to Capital Markets with Andrew M.Chisholm
1 × $6.00
An Introduction to Capital Markets with Andrew M.Chisholm
1 × $6.00 -
×
 ICT Prodigy Trading Course – $650K in Payouts with Alex Solignani
1 × $15.00
ICT Prodigy Trading Course – $650K in Payouts with Alex Solignani
1 × $15.00 -
×
 Forecast 2024 Clarification with Larry Williams
1 × $15.00
Forecast 2024 Clarification with Larry Williams
1 × $15.00 -
×
 CANDLESTICKS APPLIED with Steve Nison & Syl Desaulniers - Candle Charts
1 × $15.00
CANDLESTICKS APPLIED with Steve Nison & Syl Desaulniers - Candle Charts
1 × $15.00 -
×
 Trading For Busy People with Josias Kere
1 × $6.00
Trading For Busy People with Josias Kere
1 × $6.00 -
×
 Technical Analysis for Short-Term Traders
1 × $6.00
Technical Analysis for Short-Term Traders
1 × $6.00 -
×
 The Orderflow Masterclass with PrimeTrading
1 × $17.00
The Orderflow Masterclass with PrimeTrading
1 × $17.00 -
×
 Matrix Spread Options Trading Course with Base Camp Trading
1 × $31.00
Matrix Spread Options Trading Course with Base Camp Trading
1 × $31.00 -
×
![ACD Method [Video (6 MP4s)] with Mark Fisher](https://www.totozon.com/wp-content/uploads/2024/05/ACD-Method-Video-6-MP4s-with-Mark-Fisher.jpg) ACD Method [Video (6 MP4s)] with Mark Fisher
1 × $6.00
ACD Method [Video (6 MP4s)] with Mark Fisher
1 × $6.00 -
×
 5-Step-Trading Stocks II - Avoid Common Trading Mistakes - Online Course (April 2014)
1 × $23.00
5-Step-Trading Stocks II - Avoid Common Trading Mistakes - Online Course (April 2014)
1 × $23.00 -
×
 Compass Trading System with Right Line Trading
1 × $39.00
Compass Trading System with Right Line Trading
1 × $39.00 -
×
 The A14 Weekly Option Strategy Workshop with Amy Meissner
1 × $23.00
The A14 Weekly Option Strategy Workshop with Amy Meissner
1 × $23.00 -
×
 Bond Market Course with The Macro Compass
1 × $15.00
Bond Market Course with The Macro Compass
1 × $15.00 -
×
 Applications of Abstract Algebra with Maple - Richard E.Kline, Neil Sigmon, Ernst Stitzinger
1 × $6.00
Applications of Abstract Algebra with Maple - Richard E.Kline, Neil Sigmon, Ernst Stitzinger
1 × $6.00 -
×
 Trading Short TermSame Day Trades Sep 2023 with Dan Sheridan & Mark Fenton - Sheridan Options Mentoring
1 × $31.00
Trading Short TermSame Day Trades Sep 2023 with Dan Sheridan & Mark Fenton - Sheridan Options Mentoring
1 × $31.00 -
×
 Price Action Manual (2nd Ed.) with Bruce Gilmore
1 × $6.00
Price Action Manual (2nd Ed.) with Bruce Gilmore
1 × $6.00 -
×
 How to avoid the GAP
1 × $6.00
How to avoid the GAP
1 × $6.00 -
×
 Crystal Ball Pack PLUS bonus Live Trade By Pat Mitchell - Trick Trades
1 × $20.00
Crystal Ball Pack PLUS bonus Live Trade By Pat Mitchell - Trick Trades
1 × $20.00 -
×
 Volume Profile 2023 (Elite Pack) with Trader Dale
1 × $5.00
Volume Profile 2023 (Elite Pack) with Trader Dale
1 × $5.00 -
×
 Algo Trading Strategies 2017 with Autotrading Academy
1 × $6.00
Algo Trading Strategies 2017 with Autotrading Academy
1 × $6.00 -
×
 Trade the OEX with Arthur Darack
1 × $6.00
Trade the OEX with Arthur Darack
1 × $6.00 -
×
 Home Run Options Trading Course with Dave Aquino - Base Camp Trading
1 × $11.00
Home Run Options Trading Course with Dave Aquino - Base Camp Trading
1 × $11.00 -
×
 Fast Track Course with Tradelikerocket
1 × $233.00
Fast Track Course with Tradelikerocket
1 × $233.00 -
×
 W. D Gann 's Square Of 9 Applied To Modern Markets with Sean Avidar - Hexatrade350
1 × $23.00
W. D Gann 's Square Of 9 Applied To Modern Markets with Sean Avidar - Hexatrade350
1 × $23.00 -
×
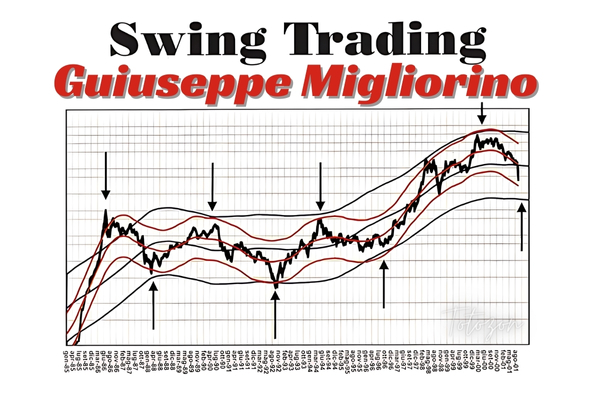 Swing Trading (Italian) with Guiuseppe Migliorino
1 × $6.00
Swing Trading (Italian) with Guiuseppe Migliorino
1 × $6.00 -
×
 Swift Trader, Perfecting the Art of DayTrading with Charles Kim
1 × $6.00
Swift Trader, Perfecting the Art of DayTrading with Charles Kim
1 × $6.00 -
×
 Scalp Strategy and Flipping Small Accounts with Opes Trading Group
1 × $5.00
Scalp Strategy and Flipping Small Accounts with Opes Trading Group
1 × $5.00 -
×
 Options Trading & Ultimate MasterClass With Tyrone Abela - FX Evolution
1 × $54.00
Options Trading & Ultimate MasterClass With Tyrone Abela - FX Evolution
1 × $54.00 -
×
 TradeCraft: Your Path to Peak Performance Trading By Adam Grimes
1 × $15.00
TradeCraft: Your Path to Peak Performance Trading By Adam Grimes
1 × $15.00 -
×
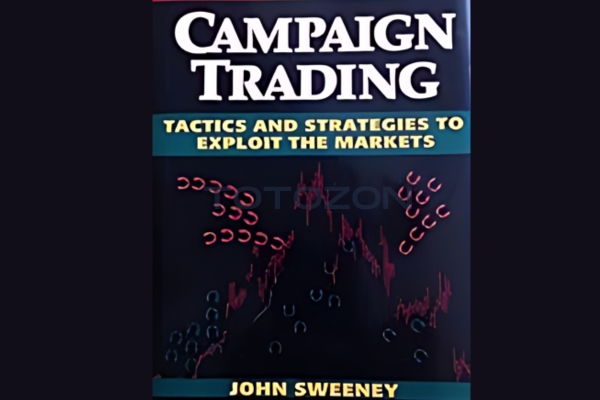 Campaign Trading with John Sweeney
1 × $6.00
Campaign Trading with John Sweeney
1 × $6.00 -
×
 High Probability Trading Using Elliott Wave And Fibonacci Analysis withVic Patel - Forex Training Group
1 × $10.00
High Probability Trading Using Elliott Wave And Fibonacci Analysis withVic Patel - Forex Training Group
1 × $10.00 -
×
 A+ Setups Big Caps Options with Jtrader
1 × $6.00
A+ Setups Big Caps Options with Jtrader
1 × $6.00 -
×
 Order flow self-study training program with iMFtracker
1 × $10.00
Order flow self-study training program with iMFtracker
1 × $10.00 -
×
 TRADING NFX Course with Andrew NFX
1 × $5.00
TRADING NFX Course with Andrew NFX
1 × $5.00 -
×
 The Naked Eye: Raw Data Analytics with Edgar Torres - Raw Data Analytics
1 × $8.00
The Naked Eye: Raw Data Analytics with Edgar Torres - Raw Data Analytics
1 × $8.00 -
×
 Daily Market Review 2009-2012 (Video 16 GB) with David Vallieres
1 × $6.00
Daily Market Review 2009-2012 (Video 16 GB) with David Vallieres
1 × $6.00 -
×
 Elite Gap Trading with Nick Santiago - InTheMoneyStocks
1 × $93.00
Elite Gap Trading with Nick Santiago - InTheMoneyStocks
1 × $93.00 -
×
 Crypto Trading Academy with Cheeky Investor - Aussie Day Trader
1 × $13.00
Crypto Trading Academy with Cheeky Investor - Aussie Day Trader
1 × $13.00 -
×
 Advanced Calculus with Applications in Statistics
1 × $6.00
Advanced Calculus with Applications in Statistics
1 × $6.00 -
×
 The Great Divergence: China, Europe, and the Making of the Modern World Economy with Kenneth Pomeranz
1 × $6.00
The Great Divergence: China, Europe, and the Making of the Modern World Economy with Kenneth Pomeranz
1 × $6.00 -
×
 White Phoenix’s The Smart (Money) Approach to Trading with Jayson Casper
1 × $39.00
White Phoenix’s The Smart (Money) Approach to Trading with Jayson Casper
1 × $39.00 -
×
 A Working Man's Forex Position Trading System 2010 with Alan Benefield
1 × $6.00
A Working Man's Forex Position Trading System 2010 with Alan Benefield
1 × $6.00 -
×
 The Noise Trader Approach to Finance (Article) with Andrei Schleifer, Laurence H.Summers
1 × $6.00
The Noise Trader Approach to Finance (Article) with Andrei Schleifer, Laurence H.Summers
1 × $6.00 -
×
 How to Avoid Tax on Your Stock Market Profits with Lee Hadnum
1 × $6.00
How to Avoid Tax on Your Stock Market Profits with Lee Hadnum
1 × $6.00 -
×
 A Course in Trading with Donald Mack & Wetsel Market Bureau
1 × $6.00
A Course in Trading with Donald Mack & Wetsel Market Bureau
1 × $6.00 -
×
 3 Technical Indicators to Help You Ride the Elliott Wave Trend with Chris Carolan
1 × $6.00
3 Technical Indicators to Help You Ride the Elliott Wave Trend with Chris Carolan
1 × $6.00 -
×
 Deep Dive Butterfly Trading Strategy Class with SJG Trades
1 × $41.00
Deep Dive Butterfly Trading Strategy Class with SJG Trades
1 × $41.00 -
×
 The Best Option Trading Course with David Jaffee - Best Stock Strategy
1 × $15.00
The Best Option Trading Course with David Jaffee - Best Stock Strategy
1 × $15.00 -
×
 Path to Profits By Scott Redler - T3 Live
1 × $6.00
Path to Profits By Scott Redler - T3 Live
1 × $6.00 -
×
 AI For Traders with Trading Markets
1 × $31.00
AI For Traders with Trading Markets
1 × $31.00 -
×
 $20 – 52k 20 pips a day challange with Rafał Zuchowicz - TopMasterTrader
1 × $5.00
$20 – 52k 20 pips a day challange with Rafał Zuchowicz - TopMasterTrader
1 × $5.00 -
×
 Technical Analysis for Long-Term Investors with Clay Allen
1 × $6.00
Technical Analysis for Long-Term Investors with Clay Allen
1 × $6.00 -
×
 Futures Trading Secrets Home Study with Bill McCready
1 × $6.00
Futures Trading Secrets Home Study with Bill McCready
1 × $6.00 -
×
 Advanced Course with Jtrader
1 × $6.00
Advanced Course with Jtrader
1 × $6.00 -
×
 Options Bootcamp with Sid Woolfolk
1 × $6.00
Options Bootcamp with Sid Woolfolk
1 × $6.00 -
×
 Generative AI for Asset Managers Workshop Recording with Ernest Chan
1 × $55.00
Generative AI for Asset Managers Workshop Recording with Ernest Chan
1 × $55.00 -
×
 Geometry of Markets I with Bruce Gilmore
1 × $6.00
Geometry of Markets I with Bruce Gilmore
1 × $6.00 -
×
 RSI Unleashed: Building a Comprehensive Trading Framework By Doc Severson
1 × $6.00
RSI Unleashed: Building a Comprehensive Trading Framework By Doc Severson
1 × $6.00 -
×
 How To Backtest Bootcamp
1 × $17.00
How To Backtest Bootcamp
1 × $17.00 -
×
 0 DTE Options Trading Workshop with Aeromir Corporation
1 × $15.00
0 DTE Options Trading Workshop with Aeromir Corporation
1 × $15.00 -
×
 Complete Day Trading Course with The Trading Floor
1 × $13.00
Complete Day Trading Course with The Trading Floor
1 × $13.00 -
×
 Advanced Strategies for Option Trading Success with James Bittman
1 × $6.00
Advanced Strategies for Option Trading Success with James Bittman
1 × $6.00 -
×
 WondaFX Signature Strategy with WondaFX
1 × $5.00
WondaFX Signature Strategy with WondaFX
1 × $5.00 -
×
 An Empirical Ananlysis of Stock Market Sentiment (Article) with Andrea Terzi
1 × $6.00
An Empirical Ananlysis of Stock Market Sentiment (Article) with Andrea Terzi
1 × $6.00 -
×
 Renko Profits Accelerator
1 × $15.00
Renko Profits Accelerator
1 × $15.00 -
×
 Option Greeks Class with Don Kaufman
1 × $6.00
Option Greeks Class with Don Kaufman
1 × $6.00 -
×
 Ultimate Trading Course with Dodgy's Dungeon
1 × $8.00
Ultimate Trading Course with Dodgy's Dungeon
1 × $8.00 -
×
 Sensitivity Analysis in Practice
1 × $6.00
Sensitivity Analysis in Practice
1 × $6.00 -
×
 Wyckoff Unleashed Official Online Course (2018) with Wyckoffsmi
1 × $23.00
Wyckoff Unleashed Official Online Course (2018) with Wyckoffsmi
1 × $23.00 -
×
 The Systematic Trader: Maximizing Trading Systems and Money Management with David Stendahl & John Boyer
1 × $6.00
The Systematic Trader: Maximizing Trading Systems and Money Management with David Stendahl & John Boyer
1 × $6.00 -
×
 Earnings Reaction Gaps Workshop with John Pocorobba
1 × $27.00
Earnings Reaction Gaps Workshop with John Pocorobba
1 × $27.00 -
×
 The All Put Flat Butterfly with Dan Sheridan - Sheridan Options Mentoring
1 × $6.00
The All Put Flat Butterfly with Dan Sheridan - Sheridan Options Mentoring
1 × $6.00 -
×
 The Logical Trader: Applying a Method to the Madness with Mark Fisher
1 × $6.00
The Logical Trader: Applying a Method to the Madness with Mark Fisher
1 × $6.00 -
×
 All About Market Timing with Leslie N.Masonson
1 × $6.00
All About Market Timing with Leslie N.Masonson
1 × $6.00 -
×
 Advanced Trading Course with Edney Pinheiro
1 × $5.00
Advanced Trading Course with Edney Pinheiro
1 × $5.00 -
×
 Using Median Lines as a Trading Tool with Greg Fisher
1 × $6.00
Using Median Lines as a Trading Tool with Greg Fisher
1 × $6.00 -
×
 5-Day Master Trader Program 2022 with Mark Minervini
1 × $31.00
5-Day Master Trader Program 2022 with Mark Minervini
1 × $31.00 -
×
 Advanced Spread Trading with Guy Bower - MasterClass Trader
1 × $15.00
Advanced Spread Trading with Guy Bower - MasterClass Trader
1 × $15.00 -
×
 Five Trading Trends of 2005 with Dan Denning
1 × $6.00
Five Trading Trends of 2005 with Dan Denning
1 × $6.00 -
×
 Quantitative Trading and Money Management, Revised Edition (5th Edition) with Fred Gehm
1 × $6.00
Quantitative Trading and Money Management, Revised Edition (5th Edition) with Fred Gehm
1 × $6.00 -
×
 Pattern Recognition: A Fundamental Introduction to Japanese Candlestick Charting Techniques Class with Jeff Bierman
1 × $6.00
Pattern Recognition: A Fundamental Introduction to Japanese Candlestick Charting Techniques Class with Jeff Bierman
1 × $6.00 -
×
 Advanced Trader with Nikos Trading Academy
1 × $5.00
Advanced Trader with Nikos Trading Academy
1 × $5.00 -
×
 Day Trading For 50 Years PDF with Michael Jenkins
1 × $6.00
Day Trading For 50 Years PDF with Michael Jenkins
1 × $6.00 -
×
 Amibroker CBT Intensive Course with Matt Radtke
1 × $31.00
Amibroker CBT Intensive Course with Matt Radtke
1 × $31.00 -
×
 How To Read The Market Professionally with TradeSmart
1 × $27.00
How To Read The Market Professionally with TradeSmart
1 × $27.00 -
×
 Traders Winning Edge with Adrienne Laris Toghraie
1 × $6.00
Traders Winning Edge with Adrienne Laris Toghraie
1 × $6.00 -
×
 Module III - Peak Formation Trades with FX MindShift
1 × $6.00
Module III - Peak Formation Trades with FX MindShift
1 × $6.00 -
×
 Fibonacci for the Active Trader with Derrik Hobbs
1 × $6.00
Fibonacci for the Active Trader with Derrik Hobbs
1 × $6.00 -
×
 Volume Profile 2023 (Order Flow Pack) with Trader Dale
1 × $5.00
Volume Profile 2023 (Order Flow Pack) with Trader Dale
1 × $5.00 -
×
 How to Analyze Multifamily Investment Opportunities with Symon He & Brandon Young
1 × $6.00
How to Analyze Multifamily Investment Opportunities with Symon He & Brandon Young
1 × $6.00 -
×
 Best of the Best: Collars with Amy Meissner & Scott Ruble
1 × $15.00
Best of the Best: Collars with Amy Meissner & Scott Ruble
1 × $15.00 -
×
 Simple Forex Profits with Rayy Bannzz
1 × $31.00
Simple Forex Profits with Rayy Bannzz
1 × $31.00 -
×
 Bollinger Bands Trading Strategies That Work
1 × $6.00
Bollinger Bands Trading Strategies That Work
1 × $6.00 -
×
 The Indices Orderflow Masterclass with The Forex Scalpers
1 × $23.00
The Indices Orderflow Masterclass with The Forex Scalpers
1 × $23.00 -
×
 The Complete Guide to Multiple Time Frame Analysis & Reading Price Action with Aiman Almansoori
1 × $13.00
The Complete Guide to Multiple Time Frame Analysis & Reading Price Action with Aiman Almansoori
1 × $13.00 -
×
 DaVinci FX Course
1 × $6.00
DaVinci FX Course
1 × $6.00 -
×
 4D Bootcamp with Black Rabbit
1 × $10.00
4D Bootcamp with Black Rabbit
1 × $10.00 -
×
 Academy of Financial Trading Foundation Trading Programme Webinar
1 × $6.00
Academy of Financial Trading Foundation Trading Programme Webinar
1 × $6.00 -
×
 Trading as a Business with Alexander Elder
1 × $6.00
Trading as a Business with Alexander Elder
1 × $6.00 -
×
 Practical Elliott Wave Trading Strategies with Robert Miner
1 × $6.00
Practical Elliott Wave Trading Strategies with Robert Miner
1 × $6.00 -
×
 The Precision Profit Float Indicator (TS Code & Setups) with Steve Woods
1 × $6.00
The Precision Profit Float Indicator (TS Code & Setups) with Steve Woods
1 × $6.00 -
×
 A Treasure House of Bayer. 32 Articles and Forecasts with George Bayer
1 × $6.00
A Treasure House of Bayer. 32 Articles and Forecasts with George Bayer
1 × $6.00 -
×
 Mastertrader – Mastering Swing Trading
1 × $31.00
Mastertrader – Mastering Swing Trading
1 × $31.00 -
×
 Buy, Sell or Hold Manage Your Portfolio for Maximum Gain with Michaal Thomsett
1 × $6.00
Buy, Sell or Hold Manage Your Portfolio for Maximum Gain with Michaal Thomsett
1 × $6.00 -
×
 Fibonnacci Trader WorkShop (Video 2.38 GB) with Dennis Bolze, Thom Hartle
1 × $6.00
Fibonnacci Trader WorkShop (Video 2.38 GB) with Dennis Bolze, Thom Hartle
1 × $6.00 -
×
 Guide to Scanning for Potential Stock Trades class with Jeff Bierman
1 × $6.00
Guide to Scanning for Potential Stock Trades class with Jeff Bierman
1 × $6.00 -
×
 Active Beta Indexes with Khalid Ghayur
1 × $6.00
Active Beta Indexes with Khalid Ghayur
1 × $6.00 -
×
 Master Class Recording 2019 with Oil Trading Academy
1 × $17.00
Master Class Recording 2019 with Oil Trading Academy
1 × $17.00 -
×
 Fixed Income Securities (2nd Ed.) with Bruce Tuckman
1 × $10.00
Fixed Income Securities (2nd Ed.) with Bruce Tuckman
1 × $10.00 -
×
 Advanced Strategies in Forex Trading with Don Schellenberg
1 × $6.00
Advanced Strategies in Forex Trading with Don Schellenberg
1 × $6.00 -
×
 All About Bonds, Bond Mutual Funds & Bond ETFs (3rd Ed.) with Esme Faerber
1 × $6.00
All About Bonds, Bond Mutual Funds & Bond ETFs (3rd Ed.) with Esme Faerber
1 × $6.00 -
×
 Advent Forex Course with Cecil Robles
1 × $6.00
Advent Forex Course with Cecil Robles
1 × $6.00 -
×
 Activedaytrader - Mastering Technicals
1 × $15.00
Activedaytrader - Mastering Technicals
1 × $15.00 -
×
 Naked Trading Mastery
1 × $39.00
Naked Trading Mastery
1 × $39.00 -
×
 Who is Afraid of Word Trade Organization with Kent Jones
1 × $6.00
Who is Afraid of Word Trade Organization with Kent Jones
1 × $6.00 -
×
 How to be a Sector Investor with Larry Hungerford & Steve Hungerford
1 × $4.00
How to be a Sector Investor with Larry Hungerford & Steve Hungerford
1 × $4.00 -
×
 The Orderflows Trade Opportunities Encyclopedia with Michael Valtos
1 × $8.00
The Orderflows Trade Opportunities Encyclopedia with Michael Valtos
1 × $8.00
 with Arthur A.Hill")
Introduction to Candlestick (Article) with Arthur A.Hill
$6.00
File Size: Coming soon!
Delivery Time: 1–12 hours
Media Type: Online Course
Content Proof: Watch Here!
You may check content proof of “Introduction to Candlestick (Article) with Arthur A.Hill” below:
 with Arthur A.Hill")
Introduction to Candlestick (Article) with Arthur A. Hill
Candlestick charting is an essential tool for traders and investors, providing a visual representation of price movements. Arthur A. Hill, a renowned expert in technical analysis, offers a comprehensive introduction to candlestick charts, making them accessible to beginners and valuable for experienced traders. Let’s explore the basics of candlestick charting and how it can enhance your trading strategy.
What is a Candlestick Chart?
A candlestick chart is a type of financial chart used to describe price movements of a security, derivative, or currency.
Components of a Candlestick
- Body: The thick part of the candlestick, showing the opening and closing prices.
- Wicks/Shadows: The thin lines above and below the body, indicating the highest and lowest prices during the period.
- Color: Traditionally, a green or white body indicates a closing price higher than the opening price, while a red or black body indicates a closing price lower than the opening price.
History of Candlestick Charting
Candlestick charting originated in Japan over 300 years ago, developed by rice traders to track market prices and daily supply and demand.
Evolution of Candlestick Charts
Over the centuries, candlestick charting has evolved and gained popularity worldwide, becoming a staple in technical analysis.
Introduction to Western Markets
Candlestick charts were introduced to the Western financial markets in the late 20th century and quickly became popular among traders.
Advantages of Candlestick Charts
Candlestick charts offer several advantages over traditional bar charts and line charts.
Visual Clarity
Candlestick charts provide a clear and concise representation of price movements, making it easier to interpret market trends.
Immediate Insight
The color-coded bodies and wicks offer immediate insight into market sentiment and price direction.
Pattern Recognition
Candlestick charts are excellent for identifying patterns that can predict future price movements.
Common Candlestick Patterns
- Doji: Indicates indecision in the market.
- Hammer: Suggests a potential reversal from a downtrend.
- Engulfing: A strong signal of a potential trend reversal.
Basic Candlestick Patterns
Understanding basic candlestick patterns is crucial for any trader looking to use this charting method effectively.
Bullish Patterns
Bullish patterns indicate potential upward price movements.
Hammer and Inverted Hammer
- Hammer: A candlestick with a small body and a long lower wick, indicating potential reversal from a downtrend.
- Inverted Hammer: Similar to the hammer but with a long upper wick, suggesting a potential bullish reversal.
Bearish Patterns
Bearish patterns suggest potential downward price movements.
Shooting Star and Hanging Man
- Shooting Star: A candlestick with a small body and a long upper wick, indicating a potential reversal from an uptrend.
- Hanging Man: Similar to the hammer but occurs after an uptrend, signaling a potential bearish reversal.
Advanced Candlestick Patterns
For more experienced traders, advanced candlestick patterns provide deeper insights into market trends.
Engulfing Patterns
Engulfing patterns occur when a smaller candlestick is followed by a larger candlestick that completely engulfs the smaller one.
Bullish Engulfing
A bullish engulfing pattern occurs at the bottom of a downtrend and signals a potential upward reversal.
Bearish Engulfing
A bearish engulfing pattern appears at the top of an uptrend and suggests a potential downward reversal.
Morning Star and Evening Star
These patterns are three-candlestick formations that indicate strong trend reversals.
Morning Star
The morning star pattern consists of a bearish candle, a small indecisive candle, and a bullish candle, indicating a bullish reversal.
Evening Star
The evening star pattern includes a bullish candle, a small indecisive candle, and a bearish candle, suggesting a bearish reversal.
Incorporating Candlestick Charts into Your Trading Strategy
Candlestick charts are versatile and can be integrated into various trading strategies.
Combining with Other Indicators
Enhance the effectiveness of candlestick charts by combining them with other technical indicators.
Popular Indicators to Combine
- Moving Averages: Confirm trends and potential reversals.
- Relative Strength Index (RSI): Identify overbought or oversold conditions.
- Bollinger Bands: Measure market volatility and potential breakouts.
Setting Up Your Trading Platform
Most trading platforms offer candlestick charting options. Ensure you customize your charts to suit your trading style.
Customization Tips
- Time Frames: Choose appropriate time frames for your trading strategy.
- Color Schemes: Use distinct colors for bullish and bearish candles.
- Indicators: Add complementary indicators to your charts.
Common Mistakes to Avoid
Even with a robust understanding of candlestick charts, traders can make mistakes that affect their performance.
Over-reliance on Patterns
Relying solely on candlestick patterns without considering other factors can lead to false signals.
Diversify Analysis
Always use candlestick patterns in conjunction with other forms of analysis and market indicators.
Ignoring Market Context
Candlestick patterns can be misleading if not considered within the broader market context.
Comprehensive Analysis
Incorporate fundamental analysis and overall market trends to validate candlestick signals.
Conclusion
Candlestick charting, as introduced by Arthur A. Hill, offers a powerful tool for traders to understand and predict market movements. By mastering basic and advanced patterns, combining them with other technical indicators, and avoiding common pitfalls, traders can enhance their market analysis and trading performance. Whether you’re new to trading or an experienced trader, candlestick charts provide valuable insights that can guide your investment decisions.
Frequently Asked Questions:
- What is a candlestick chart?
A candlestick chart is a type of financial chart used to represent price movements over a specific period, showing the opening, closing, high, and low prices. - Why are candlestick charts popular among traders?
They provide visual clarity and help in identifying patterns that can predict future price movements. - What are some basic candlestick patterns?
Basic patterns include the hammer, inverted hammer, shooting star, and hanging man, which indicate potential market reversals. - Can candlestick charts be used with other technical indicators?
Yes, combining candlestick charts with indicators like moving averages, RSI, and Bollinger Bands enhances their effectiveness. - How can I avoid common mistakes when using candlestick charts?
Avoid over-relying on patterns and always consider the broader market context and other forms of analysis.
Be the first to review “Introduction to Candlestick (Article) with Arthur A.Hill”
You must be logged in to post a review.
Related products
Forex Trading
Original price was: $397.00.$31.00Current price is: $31.00.
Forex Trading
Original price was: $2,000.00.$23.00Current price is: $23.00.
Original price was: $695.00.$41.00Current price is: $41.00.

Forex Trading
Original price was: $850.00.$23.00Current price is: $23.00.
Forex Trading
Original price was: $1,098.00.$39.00Current price is: $39.00.
Forex Trading
Original price was: $999.00.$15.00Current price is: $15.00.
Forex Trading
Original price was: $499.00.$15.00Current price is: $15.00.
Original price was: $310.00.$23.00Current price is: $23.00.
Forex Trading
Original price was: $799.00.$15.00Current price is: $15.00.
Forex Trading
Original price was: $239.00.$8.00Current price is: $8.00.
Original price was: $299.00.$8.00Current price is: $8.00.
Original price was: $895.00.$15.00Current price is: $15.00.
Original price was: $700.00.$39.00Current price is: $39.00.
Forex Trading
Original price was: $249.00.$15.00Current price is: $15.00.
Original price was: $997.00.$8.00Current price is: $8.00.
Forex Trading
Original price was: $125.00.$17.00Current price is: $17.00.
Forex Trading
Original price was: $797.00.$10.00Current price is: $10.00.

Forex Trading
Original price was: $2,997.00.$23.00Current price is: $23.00.
Original price was: $497.00.$31.00Current price is: $31.00.
Forex Trading
Quantamentals – The Next Great Forefront Of Trading and Investing with Trading Markets
Original price was: $1,495.00.$8.00Current price is: $8.00.

Reviews
There are no reviews yet.