-
×
 Stealth Trader (Ebook) with Andy Jordan - Trading Educators
1 × $132.00
Stealth Trader (Ebook) with Andy Jordan - Trading Educators
1 × $132.00 -
×
 Trading by the Book (tradingeducators.com)
1 × $6.00
Trading by the Book (tradingeducators.com)
1 × $6.00 -
×
 C'MON MAN SHEEEIIIITTT PACKAGE with King Khang
1 × $23.00
C'MON MAN SHEEEIIIITTT PACKAGE with King Khang
1 × $23.00 -
×
 The Realistic Trader - Crypto Currencies
1 × $31.00
The Realistic Trader - Crypto Currencies
1 × $31.00 -
×
 Active Investing courses notes with Alan Hull
1 × $6.00
Active Investing courses notes with Alan Hull
1 × $6.00 -
×
 SO FX Educational Course with SO FX
1 × $5.00
SO FX Educational Course with SO FX
1 × $5.00 -
×
 Inner Circle Course with Darius Fx
1 × $24.00
Inner Circle Course with Darius Fx
1 × $24.00 -
×
 Most Woke Trading Methods with Hunter FX
1 × $5.00
Most Woke Trading Methods with Hunter FX
1 × $5.00 -
×
 Rule Based Price Action with Trader Divergent
1 × $5.00
Rule Based Price Action with Trader Divergent
1 × $5.00 -
×
 To Hell & Back with Ken Stern
1 × $6.00
To Hell & Back with Ken Stern
1 × $6.00 -
×
 Pristine - Dan Gibby – Market Preparation Trading Gaps & Trading the Open
1 × $6.00
Pristine - Dan Gibby – Market Preparation Trading Gaps & Trading the Open
1 × $6.00 -
×
 Altcoin Investing Course with Rekt Capital
1 × $5.00
Altcoin Investing Course with Rekt Capital
1 × $5.00 -
×
 Trading Freak Academy (Full Course) with JP - Trading Freak
1 × $5.00
Trading Freak Academy (Full Course) with JP - Trading Freak
1 × $5.00 -
×
 Krautgap By John Piper
1 × $6.00
Krautgap By John Piper
1 × $6.00 -
×
 Futures Commodity Trading with G. Scott Martin
1 × $6.00
Futures Commodity Trading with G. Scott Martin
1 × $6.00 -
×
 Crypto Trading Academy with Cheeky Investor - Aussie Day Trader
1 × $13.00
Crypto Trading Academy with Cheeky Investor - Aussie Day Trader
1 × $13.00 -
×
 Stock Cycles with Michael Alexander
1 × $6.00
Stock Cycles with Michael Alexander
1 × $6.00 -
×
 Quantitative Trading Strategies (1st Edition) with Lars Kestner
1 × $6.00
Quantitative Trading Strategies (1st Edition) with Lars Kestner
1 × $6.00 -
×
 A Process for Prudential Institutional Investment with Bancroft, Caldwell, McSweeny
1 × $6.00
A Process for Prudential Institutional Investment with Bancroft, Caldwell, McSweeny
1 × $6.00 -
×
 Strategic Swing Trader with Sami Abusaad
1 × $6.00
Strategic Swing Trader with Sami Abusaad
1 × $6.00 -
×
 Bulk REO 2.0
1 × $23.00
Bulk REO 2.0
1 × $23.00 -
×
 Quality FX Academy
1 × $5.00
Quality FX Academy
1 × $5.00 -
×
 Arjoio’s MMT - Essential Package
1 × $5.00
Arjoio’s MMT - Essential Package
1 × $5.00 -
×
 Advance Gap Trading with Master Trader
1 × $39.00
Advance Gap Trading with Master Trader
1 × $39.00 -
×
 Forex Never Lose Trade & Forex Unknown Secret with Karl Dittmann
1 × $6.00
Forex Never Lose Trade & Forex Unknown Secret with Karl Dittmann
1 × $6.00 -
×
 Advanced Risk Reversals and Rolling Thunder with Stratagem Trade
1 × $54.00
Advanced Risk Reversals and Rolling Thunder with Stratagem Trade
1 × $54.00 -
×
 Basecamptrading - How to Become a More Consistent Trader
1 × $15.00
Basecamptrading - How to Become a More Consistent Trader
1 × $15.00 -
×
 Option Buying Course
1 × $5.00
Option Buying Course
1 × $5.00 -
×
 Beginner's Guide to Ratio Butterflys Class with Don Kaufman
1 × $6.00
Beginner's Guide to Ratio Butterflys Class with Don Kaufman
1 × $6.00 -
×
 The New Science of Asset Allocation with Thomas Schneeweis
1 × $6.00
The New Science of Asset Allocation with Thomas Schneeweis
1 × $6.00 -
×
 Dan Sheridan 360 Degrees of Trading Class
1 × $6.00
Dan Sheridan 360 Degrees of Trading Class
1 × $6.00 -
×
 CFA Level 3- Examination Morning Session – Essay (2004)
1 × $6.00
CFA Level 3- Examination Morning Session – Essay (2004)
1 × $6.00 -
×
 Inefficient Markets with Andrei Shleifer
1 × $6.00
Inefficient Markets with Andrei Shleifer
1 × $6.00 -
×
 Pring on Price Patterns with Martin Pring
1 × $6.00
Pring on Price Patterns with Martin Pring
1 × $6.00 -
×
 Selling Options for Income, Profits & Opportunistic Hedge Trading Management with Powercycletrading
1 × $69.00
Selling Options for Income, Profits & Opportunistic Hedge Trading Management with Powercycletrading
1 × $69.00 -
×
 Advanced Course with Jtrader
1 × $6.00
Advanced Course with Jtrader
1 × $6.00 -
×
 Modern Portfolio Theory and Investment Analysis (7th Edition) with Edwin Elton, Martin Gruber, Stephen Brown & William Goetzmann
1 × $6.00
Modern Portfolio Theory and Investment Analysis (7th Edition) with Edwin Elton, Martin Gruber, Stephen Brown & William Goetzmann
1 × $6.00 -
×
 Seller Specialist Program with Chris Prefontaine
1 × $62.00
Seller Specialist Program with Chris Prefontaine
1 × $62.00 -
×
 Pattern- Price & Time. Using Gann Theory in Trading Systems (2nd Ed.)
1 × $6.00
Pattern- Price & Time. Using Gann Theory in Trading Systems (2nd Ed.)
1 × $6.00 -
×
 Mastering the Geometry of Market Energy with Charles Drummond
1 × $6.00
Mastering the Geometry of Market Energy with Charles Drummond
1 × $6.00 -
×
 D.A.T.E. Unlock Your Trading DNA Worskshop with Geoff Bysshe
1 × $6.00
D.A.T.E. Unlock Your Trading DNA Worskshop with Geoff Bysshe
1 × $6.00 -
×
 9-Pack of TOS Indicators
1 × $6.00
9-Pack of TOS Indicators
1 × $6.00 -
×
 Trading Short TermSame Day Trades Sep 2023 with Dan Sheridan & Mark Fenton - Sheridan Options Mentoring
1 × $31.00
Trading Short TermSame Day Trades Sep 2023 with Dan Sheridan & Mark Fenton - Sheridan Options Mentoring
1 × $31.00 -
×
 Options Trading with Adam Grimes - MarketLife
1 × $5.00
Options Trading with Adam Grimes - MarketLife
1 × $5.00 -
×
 Futures & Options from A to Z with Russell Wassendorf
1 × $6.00
Futures & Options from A to Z with Russell Wassendorf
1 × $6.00 -
×
 Build Your Own Trading System with John Hill
1 × $6.00
Build Your Own Trading System with John Hill
1 × $6.00 -
×
 Price Headley - Using Williams %R The BigTrends Way
1 × $6.00
Price Headley - Using Williams %R The BigTrends Way
1 × $6.00 -
×
 George Wollsten: Expert Stock and Grain Trader with George Bayer
1 × $6.00
George Wollsten: Expert Stock and Grain Trader with George Bayer
1 × $6.00 -
×
 Trading Academy 2024 with Tradeciety
1 × $5.00
Trading Academy 2024 with Tradeciety
1 × $5.00 -
×
 Our 3 Bread and Butter Trades In This Low IV Market Advanced Class with Day Trading Zones
1 × $39.00
Our 3 Bread and Butter Trades In This Low IV Market Advanced Class with Day Trading Zones
1 × $39.00 -
×
 A Bull in China with Jim Rogers
1 × $6.00
A Bull in China with Jim Rogers
1 × $6.00 -
×
 FX Prosperity Academy with Leonard Williams Jr
1 × $5.00
FX Prosperity Academy with Leonard Williams Jr
1 × $5.00 -
×
 Optionetics 2007 - Home Study Course, MP3
1 × $6.00
Optionetics 2007 - Home Study Course, MP3
1 × $6.00 -
×
 Deep Market Analysis Volume 1 with Fractal Flow Pro
1 × $6.00
Deep Market Analysis Volume 1 with Fractal Flow Pro
1 × $6.00 -
×
 Day Trading and Swing Trading Futures with Price Action by Humberto Malaspina
1 × $5.00
Day Trading and Swing Trading Futures with Price Action by Humberto Malaspina
1 × $5.00 -
×
 The Astrology of the Old Testament or The Lost World Regained with Karl Anderson
1 × $6.00
The Astrology of the Old Testament or The Lost World Regained with Karl Anderson
1 × $6.00 -
×
 How to Spot Trading Opportunities
1 × $6.00
How to Spot Trading Opportunities
1 × $6.00 -
×
 Electronic Day Traders' Secrets: Learn From the Best of the Best DayTraders with Burton Friedfertig
1 × $6.00
Electronic Day Traders' Secrets: Learn From the Best of the Best DayTraders with Burton Friedfertig
1 × $6.00 -
×
 How To Invest Better
1 × $6.00
How To Invest Better
1 × $6.00 -
×
 The Art of the Trade: What I Learned (and Lost) Trading the Chicago Futures Markets - Jason Alan Jankovsky
1 × $6.00
The Art of the Trade: What I Learned (and Lost) Trading the Chicago Futures Markets - Jason Alan Jankovsky
1 × $6.00 -
×
 Create Your Own Hedge Fund with Mark Wolfinger
1 × $6.00
Create Your Own Hedge Fund with Mark Wolfinger
1 × $6.00 -
×
 Investing for the Long Term with Peter Bernstein
1 × $6.00
Investing for the Long Term with Peter Bernstein
1 × $6.00 -
×
 Astro Models (techedgecycles.com) with Yuri Shramenko
1 × $6.00
Astro Models (techedgecycles.com) with Yuri Shramenko
1 × $6.00 -
×
 Profiletraders - Market Profile Day Trading
1 × $15.00
Profiletraders - Market Profile Day Trading
1 × $15.00 -
×
 Forex Time Machine with Bill Poulos
1 × $6.00
Forex Time Machine with Bill Poulos
1 × $6.00 -
×
 How To Read The Market Professionally with TradeSmart
1 × $27.00
How To Read The Market Professionally with TradeSmart
1 × $27.00 -
×
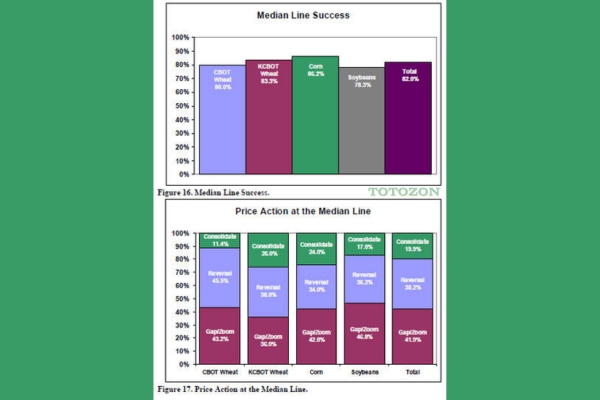 Using Median Lines as a Trading Tool with Greg Fisher
1 × $6.00
Using Median Lines as a Trading Tool with Greg Fisher
1 × $6.00 -
×
 Dan Sheridan Options Mentoring Weekly Webinars
1 × $6.00
Dan Sheridan Options Mentoring Weekly Webinars
1 × $6.00 -
×
 MT4 High Probability Forex Trading Method
1 × $6.00
MT4 High Probability Forex Trading Method
1 × $6.00 -
×
 The Handbook of Equity Style Management (3rd Ed) with Daniel Coggin & Frank Fabozzi
1 × $6.00
The Handbook of Equity Style Management (3rd Ed) with Daniel Coggin & Frank Fabozzi
1 × $6.00 -
×
 Stock Patterns for DayTrading. Home Study Course
1 × $6.00
Stock Patterns for DayTrading. Home Study Course
1 × $6.00 -
×
 Secrets to Succesful Forex Trading Course with Jose Soto
1 × $6.00
Secrets to Succesful Forex Trading Course with Jose Soto
1 × $6.00 -
×
 Trading Online
1 × $6.00
Trading Online
1 × $6.00 -
×
 The TC2000 Masterclass Course with Sasha Evdakov - Rise2learn
1 × $23.00
The TC2000 Masterclass Course with Sasha Evdakov - Rise2learn
1 × $23.00 -
×
 Master Commodities Course
1 × $6.00
Master Commodities Course
1 × $6.00 -
×
 FXjake Daily Trader Program
1 × $31.00
FXjake Daily Trader Program
1 × $31.00 -
×
 Forex & Fibonacci Day Trading Seminar - $695
1 × $6.00
Forex & Fibonacci Day Trading Seminar - $695
1 × $6.00 -
×
 The Orderflows Trade Opportunities Encyclopedia with Michael Valtos
1 × $8.00
The Orderflows Trade Opportunities Encyclopedia with Michael Valtos
1 × $8.00 -
×
 Game-Maker Forex Trading System
1 × $6.00
Game-Maker Forex Trading System
1 × $6.00 -
×
 Million Dollar Stock Market Idea with Larry Williams
1 × $6.00
Million Dollar Stock Market Idea with Larry Williams
1 × $6.00 -
×
 Scalp Strategy and Flipping Small Accounts with Opes Trading Group
1 × $5.00
Scalp Strategy and Flipping Small Accounts with Opes Trading Group
1 × $5.00 -
×
 How to Analyze Multifamily Investment Opportunities with Symon He & Brandon Young
1 × $6.00
How to Analyze Multifamily Investment Opportunities with Symon He & Brandon Young
1 × $6.00 -
×
 S&P 500 Secrets + Next Level Risk Management with Tradacc
1 × $8.00
S&P 500 Secrets + Next Level Risk Management with Tradacc
1 × $8.00 -
×
 The Orderflow Masterclass with PrimeTrading
1 × $17.00
The Orderflow Masterclass with PrimeTrading
1 × $17.00 -
×
 Quantamentals - The Next Great Forefront Of Trading and Investing with Trading Markets
1 × $8.00
Quantamentals - The Next Great Forefront Of Trading and Investing with Trading Markets
1 × $8.00 -
×
 Forecast 2024 Clarification with Larry Williams
1 × $15.00
Forecast 2024 Clarification with Larry Williams
1 × $15.00 -
×
 The A14 Weekly Option Strategy Workshop with Amy Meissner
1 × $23.00
The A14 Weekly Option Strategy Workshop with Amy Meissner
1 × $23.00 -
×
 The Complete Guide to Multiple Time Frame Analysis & Reading Price Action with Aiman Almansoori
1 × $13.00
The Complete Guide to Multiple Time Frame Analysis & Reading Price Action with Aiman Almansoori
1 × $13.00 -
×
 The TradingKey Mastering Elliott Wave with Hubb Financial
1 × $6.00
The TradingKey Mastering Elliott Wave with Hubb Financial
1 × $6.00 -
×
 A Working Man's Forex Position Trading System 2010 with Alan Benefield
1 × $6.00
A Working Man's Forex Position Trading System 2010 with Alan Benefield
1 × $6.00 -
×
 The Indices Orderflow Masterclass with The Forex Scalpers
1 × $23.00
The Indices Orderflow Masterclass with The Forex Scalpers
1 × $23.00 -
×
 Essentials in Quantitative Trading QT01 By HangukQuant's
1 × $23.00
Essentials in Quantitative Trading QT01 By HangukQuant's
1 × $23.00 -
×
 Home Run Options Trading Course with Dave Aquino - Base Camp Trading
1 × $11.00
Home Run Options Trading Course with Dave Aquino - Base Camp Trading
1 × $11.00 -
×
 Algo Trading Masterclass with Ali Casey - StatOasis
1 × $23.00
Algo Trading Masterclass with Ali Casey - StatOasis
1 × $23.00 -
×
 Best of the Best: Collars with Amy Meissner & Scott Ruble
1 × $15.00
Best of the Best: Collars with Amy Meissner & Scott Ruble
1 × $15.00 -
×
 Ultimate Trading Course with Dodgy's Dungeon
1 × $8.00
Ultimate Trading Course with Dodgy's Dungeon
1 × $8.00 -
×
 Swift Trader, Perfecting the Art of DayTrading with Charles Kim
1 × $6.00
Swift Trader, Perfecting the Art of DayTrading with Charles Kim
1 × $6.00 -
×
 High Probability Trading Using Elliott Wave And Fibonacci Analysis withVic Patel - Forex Training Group
1 × $10.00
High Probability Trading Using Elliott Wave And Fibonacci Analysis withVic Patel - Forex Training Group
1 × $10.00 -
×
 The Best Option Trading Course with David Jaffee - Best Stock Strategy
1 × $15.00
The Best Option Trading Course with David Jaffee - Best Stock Strategy
1 × $15.00 -
×
 Predators & Profits with Martin Howell & John Bogle
1 × $6.00
Predators & Profits with Martin Howell & John Bogle
1 × $6.00 -
×
 WondaFX Signature Strategy with WondaFX
1 × $5.00
WondaFX Signature Strategy with WondaFX
1 × $5.00 -
×
 MAP. Moving Average Patterns CD with David Elliott
1 × $6.00
MAP. Moving Average Patterns CD with David Elliott
1 × $6.00 -
×
 Compass Trading System with Right Line Trading
1 × $39.00
Compass Trading System with Right Line Trading
1 × $39.00 -
×
 TradeCraft: Your Path to Peak Performance Trading By Adam Grimes
1 × $15.00
TradeCraft: Your Path to Peak Performance Trading By Adam Grimes
1 × $15.00 -
×
 Bond Market Course with The Macro Compass
1 × $15.00
Bond Market Course with The Macro Compass
1 × $15.00 -
×
 0 DTE Options Trading Workshop with Aeromir Corporation
1 × $15.00
0 DTE Options Trading Workshop with Aeromir Corporation
1 × $15.00 -
×
 Volume Profile 2023 (Order Flow Pack) with Trader Dale
1 × $5.00
Volume Profile 2023 (Order Flow Pack) with Trader Dale
1 × $5.00 -
×
 Crystal Ball Pack PLUS bonus Live Trade By Pat Mitchell - Trick Trades
1 × $20.00
Crystal Ball Pack PLUS bonus Live Trade By Pat Mitchell - Trick Trades
1 × $20.00 -
×
 The Trading Masterclass with Chris Capre
1 × $23.00
The Trading Masterclass with Chris Capre
1 × $23.00 -
×
 SQX Mentorship with Tip Toe Hippo
1 × $23.00
SQX Mentorship with Tip Toe Hippo
1 × $23.00 -
×
 The Triple Bottom Line
1 × $6.00
The Triple Bottom Line
1 × $6.00 -
×
 The London Close Trade Strategy with Shirley Hudson & Vic Noble
1 × $4.00
The London Close Trade Strategy with Shirley Hudson & Vic Noble
1 × $4.00 -
×
 5-Step-Trading Stocks I and II with Lex Van Dam
1 × $4.00
5-Step-Trading Stocks I and II with Lex Van Dam
1 × $4.00 -
×
 3 Day WorkShop with HYDRA
1 × $13.00
3 Day WorkShop with HYDRA
1 × $13.00 -
×
 A Complete Course in Option Trading Fundamentals with Joseph Frey
1 × $6.00
A Complete Course in Option Trading Fundamentals with Joseph Frey
1 × $6.00 -
×
 ICT Mentorship – 2019
1 × $13.00
ICT Mentorship – 2019
1 × $13.00 -
×
 TRADING NFX Course with Andrew NFX
1 × $5.00
TRADING NFX Course with Andrew NFX
1 × $5.00 -
×
 Royal Exchange Forex with Jan Teslar
1 × $6.00
Royal Exchange Forex with Jan Teslar
1 × $6.00 -
×
 Contrarian Investment Strategies: The Next Generation with David Dreman
1 × $4.00
Contrarian Investment Strategies: The Next Generation with David Dreman
1 × $4.00 -
×
 Order flow self-study training program with iMFtracker
1 × $10.00
Order flow self-study training program with iMFtracker
1 × $10.00 -
×
 Butterfly and Condor Workshop with Aeromir
1 × $15.00
Butterfly and Condor Workshop with Aeromir
1 × $15.00 -
×
 Pivotboss Masters - Become Elite
1 × $5.00
Pivotboss Masters - Become Elite
1 × $5.00 -
×
 Traders Winning Edge with Adrienne Laris Toghraie
1 × $6.00
Traders Winning Edge with Adrienne Laris Toghraie
1 × $6.00 -
×
 Forty Cents for Financial Freedom with Darlene Nelson
1 × $6.00
Forty Cents for Financial Freedom with Darlene Nelson
1 × $6.00 -
×
 $20 – 52k 20 pips a day challange with Rafał Zuchowicz - TopMasterTrader
1 × $5.00
$20 – 52k 20 pips a day challange with Rafał Zuchowicz - TopMasterTrader
1 × $5.00 -
×
 The Prop Trading Code with Brannigan Barrett - Axia Futures
1 × $23.00
The Prop Trading Code with Brannigan Barrett - Axia Futures
1 × $23.00 -
×
 Options Trading & Ultimate MasterClass With Tyrone Abela - FX Evolution
1 × $54.00
Options Trading & Ultimate MasterClass With Tyrone Abela - FX Evolution
1 × $54.00 -
×
 ENG Renko Mastery with International Scalpers
1 × $10.00
ENG Renko Mastery with International Scalpers
1 × $10.00 -
×
 Stock Market Crash of 1929 with Aron Abrams
1 × $6.00
Stock Market Crash of 1929 with Aron Abrams
1 × $6.00 -
×
 W. D Gann 's Square Of 9 Applied To Modern Markets with Sean Avidar - Hexatrade350
1 × $23.00
W. D Gann 's Square Of 9 Applied To Modern Markets with Sean Avidar - Hexatrade350
1 × $23.00 -
×
 A Comparison of Popular Trading Systems (2nd Ed.) with Lars Kestner
1 × $6.00
A Comparison of Popular Trading Systems (2nd Ed.) with Lars Kestner
1 × $6.00 -
×
 The Compleat Day Trader with Jake Bernstein
1 × $6.00
The Compleat Day Trader with Jake Bernstein
1 × $6.00 -
×
 White Phoenix’s The Smart (Money) Approach to Trading with Jayson Casper
1 × $39.00
White Phoenix’s The Smart (Money) Approach to Trading with Jayson Casper
1 × $39.00 -
×
 ETFs for the Long Run: What They Are, How They Work, and Simple Strategies for Successful Long-Term Investing - Lawrence Carrel
1 × $6.00
ETFs for the Long Run: What They Are, How They Work, and Simple Strategies for Successful Long-Term Investing - Lawrence Carrel
1 × $6.00 -
×
 Quarterly Theory with Trader Daye
1 × $20.00
Quarterly Theory with Trader Daye
1 × $20.00 -
×
 ICT Prodigy Trading Course – $650K in Payouts with Alex Solignani
1 × $15.00
ICT Prodigy Trading Course – $650K in Payouts with Alex Solignani
1 × $15.00 -
×
 Matrix Spread Options Trading Course with Base Camp Trading
1 × $31.00
Matrix Spread Options Trading Course with Base Camp Trading
1 × $31.00 -
×
 An Introduction to Option Trading Success with James Bittman
1 × $6.00
An Introduction to Option Trading Success with James Bittman
1 × $6.00 -
×
 Learn how to trade Volatility 75 Index Technical Analysis with Patrick Muke
1 × $6.00
Learn how to trade Volatility 75 Index Technical Analysis with Patrick Muke
1 × $6.00 -
×
 Algo Wizard Essentials Course with Srategy Quant
1 × $13.00
Algo Wizard Essentials Course with Srategy Quant
1 × $13.00 -
×
 How to Trade Diagonal Triangles. Superior Risk Reward Trade Setups
1 × $6.00
How to Trade Diagonal Triangles. Superior Risk Reward Trade Setups
1 × $6.00
 with Arthur A.Hill")
Introduction to Candlestick (Article) with Arthur A.Hill
$6.00
File Size: Coming soon!
Delivery Time: 1–12 hours
Media Type: Online Course
Content Proof: Watch Here!
You may check content proof of “Introduction to Candlestick (Article) with Arthur A.Hill” below:
 with Arthur A.Hill")
Introduction to Candlestick (Article) with Arthur A. Hill
Candlestick charting is an essential tool for traders and investors, providing a visual representation of price movements. Arthur A. Hill, a renowned expert in technical analysis, offers a comprehensive introduction to candlestick charts, making them accessible to beginners and valuable for experienced traders. Let’s explore the basics of candlestick charting and how it can enhance your trading strategy.
What is a Candlestick Chart?
A candlestick chart is a type of financial chart used to describe price movements of a security, derivative, or currency.
Components of a Candlestick
- Body: The thick part of the candlestick, showing the opening and closing prices.
- Wicks/Shadows: The thin lines above and below the body, indicating the highest and lowest prices during the period.
- Color: Traditionally, a green or white body indicates a closing price higher than the opening price, while a red or black body indicates a closing price lower than the opening price.
History of Candlestick Charting
Candlestick charting originated in Japan over 300 years ago, developed by rice traders to track market prices and daily supply and demand.
Evolution of Candlestick Charts
Over the centuries, candlestick charting has evolved and gained popularity worldwide, becoming a staple in technical analysis.
Introduction to Western Markets
Candlestick charts were introduced to the Western financial markets in the late 20th century and quickly became popular among traders.
Advantages of Candlestick Charts
Candlestick charts offer several advantages over traditional bar charts and line charts.
Visual Clarity
Candlestick charts provide a clear and concise representation of price movements, making it easier to interpret market trends.
Immediate Insight
The color-coded bodies and wicks offer immediate insight into market sentiment and price direction.
Pattern Recognition
Candlestick charts are excellent for identifying patterns that can predict future price movements.
Common Candlestick Patterns
- Doji: Indicates indecision in the market.
- Hammer: Suggests a potential reversal from a downtrend.
- Engulfing: A strong signal of a potential trend reversal.
Basic Candlestick Patterns
Understanding basic candlestick patterns is crucial for any trader looking to use this charting method effectively.
Bullish Patterns
Bullish patterns indicate potential upward price movements.
Hammer and Inverted Hammer
- Hammer: A candlestick with a small body and a long lower wick, indicating potential reversal from a downtrend.
- Inverted Hammer: Similar to the hammer but with a long upper wick, suggesting a potential bullish reversal.
Bearish Patterns
Bearish patterns suggest potential downward price movements.
Shooting Star and Hanging Man
- Shooting Star: A candlestick with a small body and a long upper wick, indicating a potential reversal from an uptrend.
- Hanging Man: Similar to the hammer but occurs after an uptrend, signaling a potential bearish reversal.
Advanced Candlestick Patterns
For more experienced traders, advanced candlestick patterns provide deeper insights into market trends.
Engulfing Patterns
Engulfing patterns occur when a smaller candlestick is followed by a larger candlestick that completely engulfs the smaller one.
Bullish Engulfing
A bullish engulfing pattern occurs at the bottom of a downtrend and signals a potential upward reversal.
Bearish Engulfing
A bearish engulfing pattern appears at the top of an uptrend and suggests a potential downward reversal.
Morning Star and Evening Star
These patterns are three-candlestick formations that indicate strong trend reversals.
Morning Star
The morning star pattern consists of a bearish candle, a small indecisive candle, and a bullish candle, indicating a bullish reversal.
Evening Star
The evening star pattern includes a bullish candle, a small indecisive candle, and a bearish candle, suggesting a bearish reversal.
Incorporating Candlestick Charts into Your Trading Strategy
Candlestick charts are versatile and can be integrated into various trading strategies.
Combining with Other Indicators
Enhance the effectiveness of candlestick charts by combining them with other technical indicators.
Popular Indicators to Combine
- Moving Averages: Confirm trends and potential reversals.
- Relative Strength Index (RSI): Identify overbought or oversold conditions.
- Bollinger Bands: Measure market volatility and potential breakouts.
Setting Up Your Trading Platform
Most trading platforms offer candlestick charting options. Ensure you customize your charts to suit your trading style.
Customization Tips
- Time Frames: Choose appropriate time frames for your trading strategy.
- Color Schemes: Use distinct colors for bullish and bearish candles.
- Indicators: Add complementary indicators to your charts.
Common Mistakes to Avoid
Even with a robust understanding of candlestick charts, traders can make mistakes that affect their performance.
Over-reliance on Patterns
Relying solely on candlestick patterns without considering other factors can lead to false signals.
Diversify Analysis
Always use candlestick patterns in conjunction with other forms of analysis and market indicators.
Ignoring Market Context
Candlestick patterns can be misleading if not considered within the broader market context.
Comprehensive Analysis
Incorporate fundamental analysis and overall market trends to validate candlestick signals.
Conclusion
Candlestick charting, as introduced by Arthur A. Hill, offers a powerful tool for traders to understand and predict market movements. By mastering basic and advanced patterns, combining them with other technical indicators, and avoiding common pitfalls, traders can enhance their market analysis and trading performance. Whether you’re new to trading or an experienced trader, candlestick charts provide valuable insights that can guide your investment decisions.
Frequently Asked Questions:
- What is a candlestick chart?
A candlestick chart is a type of financial chart used to represent price movements over a specific period, showing the opening, closing, high, and low prices. - Why are candlestick charts popular among traders?
They provide visual clarity and help in identifying patterns that can predict future price movements. - What are some basic candlestick patterns?
Basic patterns include the hammer, inverted hammer, shooting star, and hanging man, which indicate potential market reversals. - Can candlestick charts be used with other technical indicators?
Yes, combining candlestick charts with indicators like moving averages, RSI, and Bollinger Bands enhances their effectiveness. - How can I avoid common mistakes when using candlestick charts?
Avoid over-relying on patterns and always consider the broader market context and other forms of analysis.
Be the first to review “Introduction to Candlestick (Article) with Arthur A.Hill”
You must be logged in to post a review.
Related products
Forex Trading
Original price was: $4,997.00.$27.00Current price is: $27.00.
Forex Trading
Original price was: $999.00.$15.00Current price is: $15.00.
Original price was: $2,120.00.$15.00Current price is: $15.00.
Original price was: $139.00.$23.00Current price is: $23.00.
Forex Trading
The Complete Guide to Multiple Time Frame Analysis & Reading Price Action with Aiman Almansoori
Original price was: $1,399.00.$13.00Current price is: $13.00.

Original price was: $997.00.$8.00Current price is: $8.00.
Original price was: $497.00.$31.00Current price is: $31.00.

Forex Trading
Original price was: $2,995.00.$31.00Current price is: $31.00.
Forex Trading
Original price was: $249.00.$15.00Current price is: $15.00.
Forex Trading
Original price was: $799.00.$15.00Current price is: $15.00.
Original price was: $1,800.00.$54.00Current price is: $54.00.
Forex Trading
Original price was: $125.00.$17.00Current price is: $17.00.
Original price was: $799.00.$15.00Current price is: $15.00.
Original price was: $310.00.$23.00Current price is: $23.00.

Original price was: $895.00.$15.00Current price is: $15.00.
Original price was: $999.00.$5.00Current price is: $5.00.
Original price was: $700.00.$39.00Current price is: $39.00.
Forex Trading
Original price was: $500.00.$5.00Current price is: $5.00.
Forex Trading
Original price was: $499.00.$15.00Current price is: $15.00.
Forex Trading
Original price was: $397.00.$31.00Current price is: $31.00.

Reviews
There are no reviews yet.