-
×
 Deep Dive Butterfly Trading Strategy Class with SJG Trades
1 × $41.00
Deep Dive Butterfly Trading Strategy Class with SJG Trades
1 × $41.00 -
×
 Hubert Senters’ Squeeze Play Strategy & Tradestation Code with Hubert Senters
1 × $6.00
Hubert Senters’ Squeeze Play Strategy & Tradestation Code with Hubert Senters
1 × $6.00 -
×
 Trading 3SMA System with Hector DeVille
1 × $6.00
Trading 3SMA System with Hector DeVille
1 × $6.00 -
×
 Best of the Best: Collars with Amy Meissner & Scott Ruble
1 × $15.00
Best of the Best: Collars with Amy Meissner & Scott Ruble
1 × $15.00 -
×
 The Day Trading ES Futures Blueprint Class with Corey Rosenbloom
1 × $6.00
The Day Trading ES Futures Blueprint Class with Corey Rosenbloom
1 × $6.00 -
×
 The Prop Trading Code with Brannigan Barrett - Axia Futures
1 × $23.00
The Prop Trading Code with Brannigan Barrett - Axia Futures
1 × $23.00 -
×
 Bond Market Course with The Macro Compass
1 × $15.00
Bond Market Course with The Macro Compass
1 × $15.00 -
×
 Stock Trader`s Almanac 2012 with Jeffrey Hirsch & Yale Hirsch
1 × $6.00
Stock Trader`s Almanac 2012 with Jeffrey Hirsch & Yale Hirsch
1 × $6.00 -
×
 Forecast 2024 Clarification with Larry Williams
1 × $15.00
Forecast 2024 Clarification with Larry Williams
1 × $15.00 -
×
 Gann Masters II with Hallikers Inc
1 × $6.00
Gann Masters II with Hallikers Inc
1 × $6.00 -
×
 The Jupiter Effect with John Gribbin & Stephen Plagemann
1 × $6.00
The Jupiter Effect with John Gribbin & Stephen Plagemann
1 × $6.00 -
×
 Your Next Great Stock: How to Screen the Market for Tomorrow's Top Performers with Jack Hough
1 × $6.00
Your Next Great Stock: How to Screen the Market for Tomorrow's Top Performers with Jack Hough
1 × $6.00 -
×
 Trading for a Bright Future with Martin Cole
1 × $6.00
Trading for a Bright Future with Martin Cole
1 × $6.00 -
×
 AI For Traders with Trading Markets
1 × $31.00
AI For Traders with Trading Markets
1 × $31.00 -
×
 The Chaos Course. Cash in on Chaos with Hans Hannula
1 × $6.00
The Chaos Course. Cash in on Chaos with Hans Hannula
1 × $6.00 -
×
 A14 Weekly Options Strategy Workshop 2023 with Amy Meissner - Aeromir
1 × $23.00
A14 Weekly Options Strategy Workshop 2023 with Amy Meissner - Aeromir
1 × $23.00 -
×
 Stock Market Strategies That Work with Jack Bernstein
1 × $6.00
Stock Market Strategies That Work with Jack Bernstein
1 × $6.00 -
×
 The Precision Profit Float Indicator (TS Code & Setups) with Steve Woods
1 × $6.00
The Precision Profit Float Indicator (TS Code & Setups) with Steve Woods
1 × $6.00 -
×
 Follow the Leader Trading System with Anthony Gibson
1 × $6.00
Follow the Leader Trading System with Anthony Gibson
1 × $6.00 -
×
 4D Bootcamp with Black Rabbit
1 × $10.00
4D Bootcamp with Black Rabbit
1 × $10.00 -
×
 W. D Gann 's Square Of 9 Applied To Modern Markets with Sean Avidar - Hexatrade350
1 × $23.00
W. D Gann 's Square Of 9 Applied To Modern Markets with Sean Avidar - Hexatrade350
1 × $23.00 -
×
 Investing with LEAPS. What You Should Know About Long Term Investing with James Bittman
1 × $6.00
Investing with LEAPS. What You Should Know About Long Term Investing with James Bittman
1 × $6.00 -
×
 Complete Price Action, Volume Profile and Orderflow Trading Bundle with Price Action Volume Trader
1 × $78.00
Complete Price Action, Volume Profile and Orderflow Trading Bundle with Price Action Volume Trader
1 × $78.00 -
×
 The Trading Blueprint with Brad Goh - The Trading Geek
1 × $5.00
The Trading Blueprint with Brad Goh - The Trading Geek
1 × $5.00 -
×
 Forex Trading Plan - Learn How To Set SMART Trading Goals! with Anas Abba & FXMindTrix Academy
1 × $6.00
Forex Trading Plan - Learn How To Set SMART Trading Goals! with Anas Abba & FXMindTrix Academy
1 × $6.00 -
×
 Essentials in Quantitative Trading QT01 By HangukQuant's
1 × $23.00
Essentials in Quantitative Trading QT01 By HangukQuant's
1 × $23.00 -
×
![ACD Method [Video (6 MP4s)] with Mark Fisher](https://www.totozon.com/wp-content/uploads/2024/05/ACD-Method-Video-6-MP4s-with-Mark-Fisher.jpg) ACD Method [Video (6 MP4s)] with Mark Fisher
1 × $6.00
ACD Method [Video (6 MP4s)] with Mark Fisher
1 × $6.00 -
×
 Compass Trading System with Right Line Trading
1 × $39.00
Compass Trading System with Right Line Trading
1 × $39.00 -
×
 Advanced Trading Techniques 2 CDs with Sammy Chua
1 × $6.00
Advanced Trading Techniques 2 CDs with Sammy Chua
1 × $6.00 -
×
 Commodity Speculation for Beginners with Charles Huff, Barbara Marinacci
1 × $6.00
Commodity Speculation for Beginners with Charles Huff, Barbara Marinacci
1 × $6.00 -
×
 Stupid Trader – Play Safe!
1 × $6.00
Stupid Trader – Play Safe!
1 × $6.00 -
×
 Quantamentals - The Next Great Forefront Of Trading and Investing with Trading Markets
1 × $8.00
Quantamentals - The Next Great Forefront Of Trading and Investing with Trading Markets
1 × $8.00 -
×
 The Aftermath + Jack Savage Extras (How To Trade Gold) with FXSavages
1 × $6.00
The Aftermath + Jack Savage Extras (How To Trade Gold) with FXSavages
1 × $6.00 -
×
 Crystal Ball Pack PLUS bonus Live Trade By Pat Mitchell - Trick Trades
1 × $20.00
Crystal Ball Pack PLUS bonus Live Trade By Pat Mitchell - Trick Trades
1 × $20.00 -
×
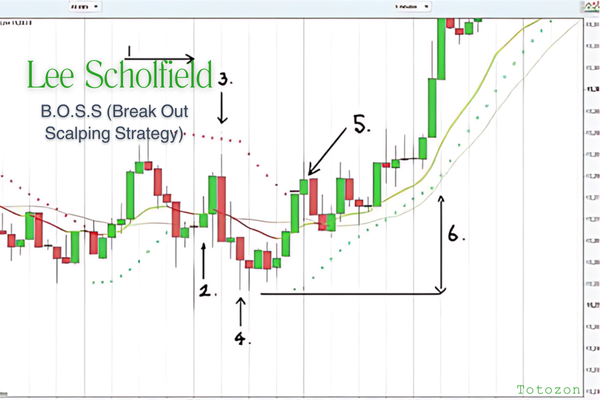 B.O.S.S (Break Out Scalping Strategy) with Lee Scholfield
1 × $6.00
B.O.S.S (Break Out Scalping Strategy) with Lee Scholfield
1 × $6.00 -
×
 Day Trading and Swing Trading Futures with Price Action by Humberto Malaspina
1 × $5.00
Day Trading and Swing Trading Futures with Price Action by Humberto Malaspina
1 × $5.00 -
×
 Gillen Predicts with Jack Gillen
1 × $6.00
Gillen Predicts with Jack Gillen
1 × $6.00 -
×
 DFX Scalping Strategy Course with Disciplined FX
1 × $23.00
DFX Scalping Strategy Course with Disciplined FX
1 × $23.00 -
×
 The Psychology of Investing with John Nofsinger
1 × $6.00
The Psychology of Investing with John Nofsinger
1 × $6.00 -
×
 ActiveBeta Indexes. Capturing Systematic Sources of Active Equity Returns (HTML) with Andrew Lo
1 × $6.00
ActiveBeta Indexes. Capturing Systematic Sources of Active Equity Returns (HTML) with Andrew Lo
1 × $6.00 -
×
 How to avoid the GAP
1 × $6.00
How to avoid the GAP
1 × $6.00 -
×
 Strategy, Value and Risk - The Real Options Approach with Jamie Rogers
1 × $6.00
Strategy, Value and Risk - The Real Options Approach with Jamie Rogers
1 × $6.00 -
×
 Technical Timing Patterns
1 × $6.00
Technical Timing Patterns
1 × $6.00 -
×
 Scalp Strategy and Flipping Small Accounts with Opes Trading Group
1 × $5.00
Scalp Strategy and Flipping Small Accounts with Opes Trading Group
1 × $5.00 -
×
 The Orderflows Trade Opportunities Encyclopedia with Michael Valtos
1 × $8.00
The Orderflows Trade Opportunities Encyclopedia with Michael Valtos
1 × $8.00 -
×
 Day Trading Institution 2.0 with Raul Gonzalez
1 × $5.00
Day Trading Institution 2.0 with Raul Gonzalez
1 × $5.00 -
×
 Advanced Scalping Techniques Home Study Course with Sami Abusaad - T3Live
1 × $31.00
Advanced Scalping Techniques Home Study Course with Sami Abusaad - T3Live
1 × $31.00 -
×
 Capital Flows and Crises with Barry Eichengreen
1 × $6.00
Capital Flows and Crises with Barry Eichengreen
1 × $6.00 -
×
 Smart Money Course with Forex XL
1 × $6.00
Smart Money Course with Forex XL
1 × $6.00 -
×
 LEAPS Trading Strategies- Powerful Techniques for Options Trading Success - Marty Kearney
1 × $6.00
LEAPS Trading Strategies- Powerful Techniques for Options Trading Success - Marty Kearney
1 × $6.00 -
×
 LPC System
1 × $5.00
LPC System
1 × $5.00 -
×
 Trading Against the Crowd with John Summa
1 × $6.00
Trading Against the Crowd with John Summa
1 × $6.00 -
×
 High Probability Trading Using Elliott Wave And Fibonacci Analysis withVic Patel - Forex Training Group
1 × $10.00
High Probability Trading Using Elliott Wave And Fibonacci Analysis withVic Patel - Forex Training Group
1 × $10.00 -
×
 The Psychology Of Trading with Brett N.Steenbarger
1 × $6.00
The Psychology Of Trading with Brett N.Steenbarger
1 × $6.00 -
×
 Ultimate Trading Course with Dodgy's Dungeon
1 × $8.00
Ultimate Trading Course with Dodgy's Dungeon
1 × $8.00 -
×
 Forex Trading Course with Mike Norman
1 × $17.00
Forex Trading Course with Mike Norman
1 × $17.00 -
×
 How Stocks Work with David L.Scott
1 × $6.00
How Stocks Work with David L.Scott
1 × $6.00 -
×
 Peter Borish Online Trader Program
1 × $15.00
Peter Borish Online Trader Program
1 × $15.00 -
×
 Investing with Exchange Traded Funds Made Easy with Marvin Appel
1 × $6.00
Investing with Exchange Traded Funds Made Easy with Marvin Appel
1 × $6.00 -
×
 Fibonacci Ratios with Pattern Recognition - Larry Pesavento & Steven Shapiro
1 × $6.00
Fibonacci Ratios with Pattern Recognition - Larry Pesavento & Steven Shapiro
1 × $6.00 -
×
 Equities Markets Certification (EMC©) with Eric Cheung - Wall Street Prep
1 × $46.00
Equities Markets Certification (EMC©) with Eric Cheung - Wall Street Prep
1 × $46.00 -
×
 The A14 Weekly Option Strategy Workshop with Amy Meissner
1 × $23.00
The A14 Weekly Option Strategy Workshop with Amy Meissner
1 × $23.00 -
×
 WondaFX Signature Strategy with WondaFX
1 × $5.00
WondaFX Signature Strategy with WondaFX
1 × $5.00 -
×
 Crypto Trading Academy with Cheeky Investor - Aussie Day Trader
1 × $13.00
Crypto Trading Academy with Cheeky Investor - Aussie Day Trader
1 × $13.00 -
×
 The Practical Handbook of Genetic Algorithms with Lance Chambers
1 × $6.00
The Practical Handbook of Genetic Algorithms with Lance Chambers
1 × $6.00 -
×
 The GBP USD Trading System with A.Heuscher
1 × $6.00
The GBP USD Trading System with A.Heuscher
1 × $6.00 -
×
 Trading Aplications of Japanese Candlestick Charting with Gary S.Wagner & Bradley L.Matheny
1 × $6.00
Trading Aplications of Japanese Candlestick Charting with Gary S.Wagner & Bradley L.Matheny
1 × $6.00 -
×
 Advanced Pattern Recognition with John Cameron
1 × $23.00
Advanced Pattern Recognition with John Cameron
1 × $23.00 -
×
 How to Avoid Tax on Your Stock Market Profits with Lee Hadnum
1 × $6.00
How to Avoid Tax on Your Stock Market Profits with Lee Hadnum
1 × $6.00 -
×
 6 (The Proper BackGround)
1 × $6.00
6 (The Proper BackGround)
1 × $6.00 -
×
 CAT 2007 Seminar with Stephen W.Bigalow
1 × $6.00
CAT 2007 Seminar with Stephen W.Bigalow
1 × $6.00 -
×
 Hedge Fund Investment Management with Izze Nelken
1 × $6.00
Hedge Fund Investment Management with Izze Nelken
1 × $6.00 -
×
 Four Dimensional Stock Market Structures & Cycles with Bradley Cowan
1 × $6.00
Four Dimensional Stock Market Structures & Cycles with Bradley Cowan
1 × $6.00 -
×
 After Hour Trading Made Easy with Joe Duarte & Roland Burke
1 × $6.00
After Hour Trading Made Easy with Joe Duarte & Roland Burke
1 × $6.00 -
×
 TradeCraft: Your Path to Peak Performance Trading By Adam Grimes
1 × $15.00
TradeCraft: Your Path to Peak Performance Trading By Adam Grimes
1 × $15.00 -
×
 Candlestick Charting Explained with Greg Morris
1 × $8.00
Candlestick Charting Explained with Greg Morris
1 × $8.00 -
×
 A Game Plan for Investing in the 21st Century with Thomas J.Dorsey
1 × $6.00
A Game Plan for Investing in the 21st Century with Thomas J.Dorsey
1 × $6.00 -
×
 Algo Trading Strategies 2017 with Autotrading Academy
1 × $6.00
Algo Trading Strategies 2017 with Autotrading Academy
1 × $6.00 -
×
 How I Day Trade Course with Traderade
1 × $15.00
How I Day Trade Course with Traderade
1 × $15.00 -
×
 How to Call the Top in a Stock (To the Penny!) and Earn 9-11% Annualized Cash Yields Doing It with Dan Ferris
1 × $6.00
How to Call the Top in a Stock (To the Penny!) and Earn 9-11% Annualized Cash Yields Doing It with Dan Ferris
1 × $6.00 -
×
 A Momentum Based Approach to Swing Trading with Dave Landry
1 × $6.00
A Momentum Based Approach to Swing Trading with Dave Landry
1 × $6.00 -
×
 Five Trading Trends of 2005 with Dan Denning
1 × $6.00
Five Trading Trends of 2005 with Dan Denning
1 × $6.00 -
×
 AbleTrend with John Wang & Grace Wang
1 × $6.00
AbleTrend with John Wang & Grace Wang
1 × $6.00 -
×
 Forex Trading Like Banks - Step by Step by Live Examples with Taher Assaf
1 × $6.00
Forex Trading Like Banks - Step by Step by Live Examples with Taher Assaf
1 × $6.00 -
×
 The Geography of Money with Benjamin J.Cohen
1 × $6.00
The Geography of Money with Benjamin J.Cohen
1 × $6.00 -
×
 News Profiteer System Manual & Members Area Videos with Henry Liu
1 × $6.00
News Profiteer System Manual & Members Area Videos with Henry Liu
1 × $6.00
 with Arthur A.Hill")
Introduction to Candlestick (Article) with Arthur A.Hill
$6.00
File Size: Coming soon!
Delivery Time: 1–12 hours
Media Type: Online Course
Content Proof: Watch Here!
You may check content proof of “Introduction to Candlestick (Article) with Arthur A.Hill” below:
 with Arthur A.Hill")
Introduction to Candlestick (Article) with Arthur A. Hill
Candlestick charting is an essential tool for traders and investors, providing a visual representation of price movements. Arthur A. Hill, a renowned expert in technical analysis, offers a comprehensive introduction to candlestick charts, making them accessible to beginners and valuable for experienced traders. Let’s explore the basics of candlestick charting and how it can enhance your trading strategy.
What is a Candlestick Chart?
A candlestick chart is a type of financial chart used to describe price movements of a security, derivative, or currency.
Components of a Candlestick
- Body: The thick part of the candlestick, showing the opening and closing prices.
- Wicks/Shadows: The thin lines above and below the body, indicating the highest and lowest prices during the period.
- Color: Traditionally, a green or white body indicates a closing price higher than the opening price, while a red or black body indicates a closing price lower than the opening price.
History of Candlestick Charting
Candlestick charting originated in Japan over 300 years ago, developed by rice traders to track market prices and daily supply and demand.
Evolution of Candlestick Charts
Over the centuries, candlestick charting has evolved and gained popularity worldwide, becoming a staple in technical analysis.
Introduction to Western Markets
Candlestick charts were introduced to the Western financial markets in the late 20th century and quickly became popular among traders.
Advantages of Candlestick Charts
Candlestick charts offer several advantages over traditional bar charts and line charts.
Visual Clarity
Candlestick charts provide a clear and concise representation of price movements, making it easier to interpret market trends.
Immediate Insight
The color-coded bodies and wicks offer immediate insight into market sentiment and price direction.
Pattern Recognition
Candlestick charts are excellent for identifying patterns that can predict future price movements.
Common Candlestick Patterns
- Doji: Indicates indecision in the market.
- Hammer: Suggests a potential reversal from a downtrend.
- Engulfing: A strong signal of a potential trend reversal.
Basic Candlestick Patterns
Understanding basic candlestick patterns is crucial for any trader looking to use this charting method effectively.
Bullish Patterns
Bullish patterns indicate potential upward price movements.
Hammer and Inverted Hammer
- Hammer: A candlestick with a small body and a long lower wick, indicating potential reversal from a downtrend.
- Inverted Hammer: Similar to the hammer but with a long upper wick, suggesting a potential bullish reversal.
Bearish Patterns
Bearish patterns suggest potential downward price movements.
Shooting Star and Hanging Man
- Shooting Star: A candlestick with a small body and a long upper wick, indicating a potential reversal from an uptrend.
- Hanging Man: Similar to the hammer but occurs after an uptrend, signaling a potential bearish reversal.
Advanced Candlestick Patterns
For more experienced traders, advanced candlestick patterns provide deeper insights into market trends.
Engulfing Patterns
Engulfing patterns occur when a smaller candlestick is followed by a larger candlestick that completely engulfs the smaller one.
Bullish Engulfing
A bullish engulfing pattern occurs at the bottom of a downtrend and signals a potential upward reversal.
Bearish Engulfing
A bearish engulfing pattern appears at the top of an uptrend and suggests a potential downward reversal.
Morning Star and Evening Star
These patterns are three-candlestick formations that indicate strong trend reversals.
Morning Star
The morning star pattern consists of a bearish candle, a small indecisive candle, and a bullish candle, indicating a bullish reversal.
Evening Star
The evening star pattern includes a bullish candle, a small indecisive candle, and a bearish candle, suggesting a bearish reversal.
Incorporating Candlestick Charts into Your Trading Strategy
Candlestick charts are versatile and can be integrated into various trading strategies.
Combining with Other Indicators
Enhance the effectiveness of candlestick charts by combining them with other technical indicators.
Popular Indicators to Combine
- Moving Averages: Confirm trends and potential reversals.
- Relative Strength Index (RSI): Identify overbought or oversold conditions.
- Bollinger Bands: Measure market volatility and potential breakouts.
Setting Up Your Trading Platform
Most trading platforms offer candlestick charting options. Ensure you customize your charts to suit your trading style.
Customization Tips
- Time Frames: Choose appropriate time frames for your trading strategy.
- Color Schemes: Use distinct colors for bullish and bearish candles.
- Indicators: Add complementary indicators to your charts.
Common Mistakes to Avoid
Even with a robust understanding of candlestick charts, traders can make mistakes that affect their performance.
Over-reliance on Patterns
Relying solely on candlestick patterns without considering other factors can lead to false signals.
Diversify Analysis
Always use candlestick patterns in conjunction with other forms of analysis and market indicators.
Ignoring Market Context
Candlestick patterns can be misleading if not considered within the broader market context.
Comprehensive Analysis
Incorporate fundamental analysis and overall market trends to validate candlestick signals.
Conclusion
Candlestick charting, as introduced by Arthur A. Hill, offers a powerful tool for traders to understand and predict market movements. By mastering basic and advanced patterns, combining them with other technical indicators, and avoiding common pitfalls, traders can enhance their market analysis and trading performance. Whether you’re new to trading or an experienced trader, candlestick charts provide valuable insights that can guide your investment decisions.
Frequently Asked Questions:
- What is a candlestick chart?
A candlestick chart is a type of financial chart used to represent price movements over a specific period, showing the opening, closing, high, and low prices. - Why are candlestick charts popular among traders?
They provide visual clarity and help in identifying patterns that can predict future price movements. - What are some basic candlestick patterns?
Basic patterns include the hammer, inverted hammer, shooting star, and hanging man, which indicate potential market reversals. - Can candlestick charts be used with other technical indicators?
Yes, combining candlestick charts with indicators like moving averages, RSI, and Bollinger Bands enhances their effectiveness. - How can I avoid common mistakes when using candlestick charts?
Avoid over-relying on patterns and always consider the broader market context and other forms of analysis.
Be the first to review “Introduction to Candlestick (Article) with Arthur A.Hill”
You must be logged in to post a review.
Related products

Original price was: $450.00.$23.00Current price is: $23.00.

Original price was: $700.00.$39.00Current price is: $39.00.

Forex Trading
Original price was: $125.00.$17.00Current price is: $17.00.

Original price was: $1,800.00.$54.00Current price is: $54.00.
Original price was: $997.00.$13.00Current price is: $13.00.
Original price was: $139.00.$23.00Current price is: $23.00.

Original price was: $1,849.00.$15.00Current price is: $15.00.
Original price was: $799.00.$15.00Current price is: $15.00.
Forex Trading
Original price was: $1,898.00.$10.00Current price is: $10.00.
Forex Trading
Original price was: $239.00.$8.00Current price is: $8.00.

Original price was: $2,120.00.$15.00Current price is: $15.00.

Original price was: $197.00.$5.00Current price is: $5.00.
Forex Trading
Original price was: $797.00.$10.00Current price is: $10.00.

Forex Trading
Original price was: $500.00.$5.00Current price is: $5.00.
Forex Trading
Original price was: $2,995.00.$31.00Current price is: $31.00.
Forex Trading
Original price was: $499.00.$15.00Current price is: $15.00.

Original price was: $497.00.$31.00Current price is: $31.00.
Original price was: $1,200.00.$23.00Current price is: $23.00.
Forex Trading
Original price was: $697.00.$5.00Current price is: $5.00.
Original price was: $649.00.$20.00Current price is: $20.00.

Reviews
There are no reviews yet.