-
×
 Bond Market Course with The Macro Compass
1 × $15.00
Bond Market Course with The Macro Compass
1 × $15.00 -
×
 Stock Market Rules (2nd Ed.) with Michael Sheimo
1 × $6.00
Stock Market Rules (2nd Ed.) with Michael Sheimo
1 × $6.00 -
×
 Options Trading & Ultimate MasterClass With Tyrone Abela - FX Evolution
1 × $54.00
Options Trading & Ultimate MasterClass With Tyrone Abela - FX Evolution
1 × $54.00 -
×
 How to be a Sector Investor with Larry Hungerford & Steve Hungerford
1 × $4.00
How to be a Sector Investor with Larry Hungerford & Steve Hungerford
1 × $4.00 -
×
 SQX Mentorship with Tip Toe Hippo
1 × $23.00
SQX Mentorship with Tip Toe Hippo
1 × $23.00 -
×
 Fierce 10 On Demand Coaching Program with High Performance Trading
1 × $5.00
Fierce 10 On Demand Coaching Program with High Performance Trading
1 × $5.00 -
×
 Matrix Spread Options Trading Course with Base Camp Trading
1 × $31.00
Matrix Spread Options Trading Course with Base Camp Trading
1 × $31.00 -
×
 Preparing for the Worst: Incorporating Downside Risk in Stock Market Investments with Hrishikesh Vinod & Derrick Reagle
1 × $6.00
Preparing for the Worst: Incorporating Downside Risk in Stock Market Investments with Hrishikesh Vinod & Derrick Reagle
1 × $6.00 -
×
 Live in London (5 DVD) with Martin Pring
1 × $6.00
Live in London (5 DVD) with Martin Pring
1 × $6.00 -
×
 Fx Engine Trading Course with Adeh Mirzakhani
1 × $6.00
Fx Engine Trading Course with Adeh Mirzakhani
1 × $6.00 -
×
 How I Get Paid $1,000 Every Friday Trading Options with Jeff Tompkins
1 × $15.00
How I Get Paid $1,000 Every Friday Trading Options with Jeff Tompkins
1 × $15.00 -
×
 Essentials in Quantitative Trading QT01 By HangukQuant's
1 × $23.00
Essentials in Quantitative Trading QT01 By HangukQuant's
1 × $23.00 -
×
 Ahead of the Curve with Joseph Ellis
1 × $6.00
Ahead of the Curve with Joseph Ellis
1 × $6.00 -
×
 Crash Profits Make Money When Stocks Sink and Soar with Martin D.Weiss
1 × $6.00
Crash Profits Make Money When Stocks Sink and Soar with Martin D.Weiss
1 × $6.00 -
×
 Long-Term Memory in the Stock Market Prices (Article) with Andrew W.Lo
1 × $6.00
Long-Term Memory in the Stock Market Prices (Article) with Andrew W.Lo
1 × $6.00 -
×
 Futures Trading Secrets Home Study with Bill McCready
1 × $6.00
Futures Trading Secrets Home Study with Bill McCready
1 × $6.00 -
×
 TRADING NFX Course with Andrew NFX
1 × $5.00
TRADING NFX Course with Andrew NFX
1 × $5.00 -
×
 Team Bull Trading Academy
1 × $5.00
Team Bull Trading Academy
1 × $5.00 -
×
 Home Run Options Trading Course with Dave Aquino - Base Camp Trading
1 × $11.00
Home Run Options Trading Course with Dave Aquino - Base Camp Trading
1 × $11.00 -
×
 Scalp Strategy and Flipping Small Accounts with Opes Trading Group
1 × $5.00
Scalp Strategy and Flipping Small Accounts with Opes Trading Group
1 × $5.00 -
×
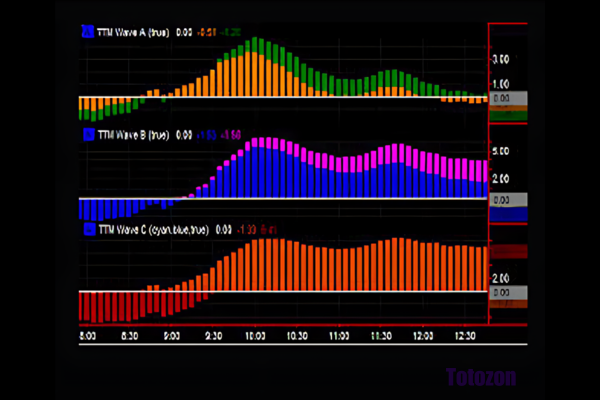 ABC Waves TOS Indicator & Live Class with Simpler Options
1 × $6.00
ABC Waves TOS Indicator & Live Class with Simpler Options
1 × $6.00 -
×
 The Crash of 1997 (Article) with Hans Hannula
1 × $6.00
The Crash of 1997 (Article) with Hans Hannula
1 × $6.00 -
×
 WondaFX Signature Strategy with WondaFX
1 × $5.00
WondaFX Signature Strategy with WondaFX
1 × $5.00 -
×
 OPTIONS FOR BEGINNERS
1 × $6.00
OPTIONS FOR BEGINNERS
1 × $6.00 -
×
 Candlestick Patterns to Master Forex Trading Price Action with Federico Sellitti
1 × $6.00
Candlestick Patterns to Master Forex Trading Price Action with Federico Sellitti
1 × $6.00 -
×
 W. D Gann 's Square Of 9 Applied To Modern Markets with Sean Avidar - Hexatrade350
1 × $23.00
W. D Gann 's Square Of 9 Applied To Modern Markets with Sean Avidar - Hexatrade350
1 × $23.00 -
×
 Deep Dive Butterfly Trading Strategy Class with SJG Trades
1 × $41.00
Deep Dive Butterfly Trading Strategy Class with SJG Trades
1 × $41.00 -
×
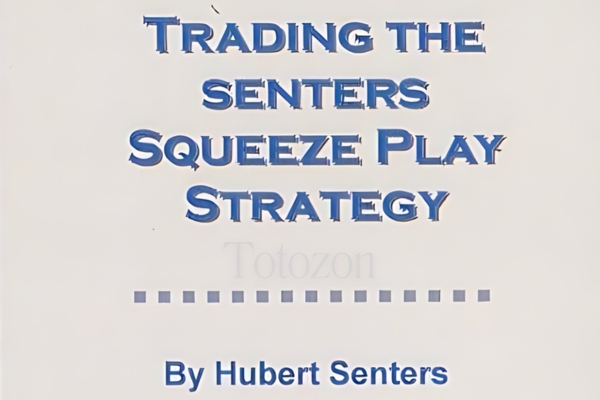 Hubert Senters’ Squeeze Play Strategy & Tradestation Code with Hubert Senters
1 × $6.00
Hubert Senters’ Squeeze Play Strategy & Tradestation Code with Hubert Senters
1 × $6.00 -
×
 The Amazing Common Sense Guide To Investment Success with John Thomchick
1 × $6.00
The Amazing Common Sense Guide To Investment Success with John Thomchick
1 × $6.00 -
×
 Harnessing Explosive Market Turns - 3 DVD with Jeff Greenblatt
1 × $6.00
Harnessing Explosive Market Turns - 3 DVD with Jeff Greenblatt
1 × $6.00 -
×
 Forex Trading Education Program (Apr-June 2010) with Jimmy Young
1 × $6.00
Forex Trading Education Program (Apr-June 2010) with Jimmy Young
1 × $6.00 -
×
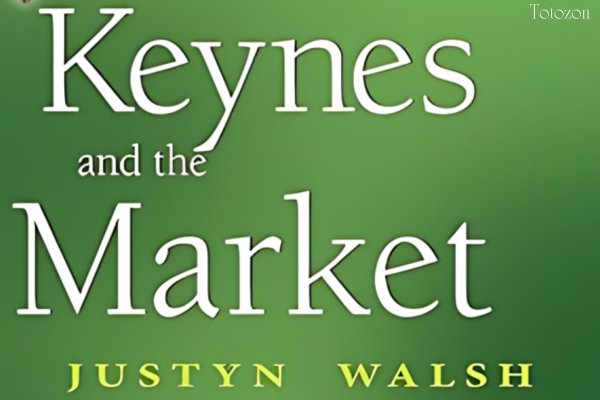 Keynes & The Market with Justyn Walsh
1 × $6.00
Keynes & The Market with Justyn Walsh
1 × $6.00 -
×
 CHARTCHAMPIONS Course
1 × $10.00
CHARTCHAMPIONS Course
1 × $10.00 -
×
 The Complete Turtle Trader with Michael Covel
1 × $6.00
The Complete Turtle Trader with Michael Covel
1 × $6.00 -
×
 The Box Strategy with Blue Capital Academy
1 × $23.00
The Box Strategy with Blue Capital Academy
1 × $23.00 -
×
 Fractal Energy Trading with Doc Severson
1 × $6.00
Fractal Energy Trading with Doc Severson
1 × $6.00 -
×
 Advanced Course with Dimitri Wallace - Gold Minds Global
1 × $6.00
Advanced Course with Dimitri Wallace - Gold Minds Global
1 × $6.00 -
×
 London Close Trade 2.0 with Shirley Hudson & Vic Noble - Forex Mentor
1 × $5.00
London Close Trade 2.0 with Shirley Hudson & Vic Noble - Forex Mentor
1 × $5.00 -
×
 CANDLESTICKS APPLIED with Steve Nison & Syl Desaulniers - Candle Charts
1 × $15.00
CANDLESTICKS APPLIED with Steve Nison & Syl Desaulniers - Candle Charts
1 × $15.00 -
×
 Investment Performance Measurement with Bruce Feibel
1 × $6.00
Investment Performance Measurement with Bruce Feibel
1 × $6.00 -
×
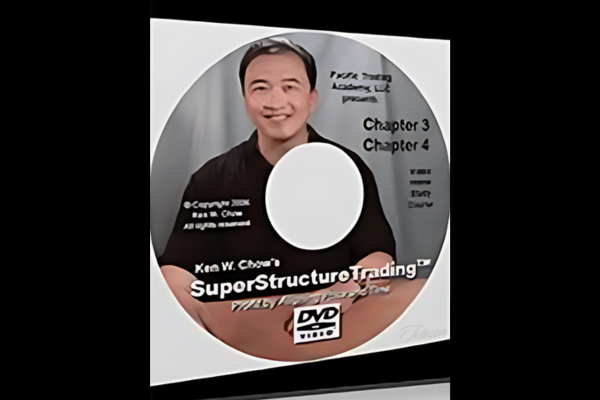 Super Structure Trading Home Study Course
1 × $23.00
Super Structure Trading Home Study Course
1 × $23.00 -
×
 Measuring & Controlling Interest Rate & Credit Risk (2nd Ed.) with Frank Fabozzi, Steven Mann & Moorad Choudhry
1 × $6.00
Measuring & Controlling Interest Rate & Credit Risk (2nd Ed.) with Frank Fabozzi, Steven Mann & Moorad Choudhry
1 × $6.00 -
×
 PFAZoneSuite [Trading Indicator] 2017
1 × $109.00
PFAZoneSuite [Trading Indicator] 2017
1 × $109.00 -
×
 Gannline. Total School Package
1 × $6.00
Gannline. Total School Package
1 × $6.00 -
×
 Weekly Options Trading Advantage Class with Doc Severson
1 × $6.00
Weekly Options Trading Advantage Class with Doc Severson
1 × $6.00 -
×
 The A to Z of Mathematics: A Basic Guide with Thomas Sidebotham
1 × $6.00
The A to Z of Mathematics: A Basic Guide with Thomas Sidebotham
1 × $6.00 -
×
 How To Read The Market Professionally with TradeSmart
1 × $27.00
How To Read The Market Professionally with TradeSmart
1 × $27.00 -
×
 The Indices Orderflow Masterclass with The Forex Scalpers
1 × $23.00
The Indices Orderflow Masterclass with The Forex Scalpers
1 × $23.00 -
×
 The Great Depression with David Burg
1 × $6.00
The Great Depression with David Burg
1 × $6.00 -
×
 Neall Concord-Cushing - Secret of Forecasting Using Wave59 Tools (Book I & II)
1 × $6.00
Neall Concord-Cushing - Secret of Forecasting Using Wave59 Tools (Book I & II)
1 × $6.00 -
×
 All About Stock Market Strategies: The Easy Way To Get Started (All About Series) with David Brown
1 × $6.00
All About Stock Market Strategies: The Easy Way To Get Started (All About Series) with David Brown
1 × $6.00 -
×
 Advanced Strategies in Forex Trading with Don Schellenberg
1 × $6.00
Advanced Strategies in Forex Trading with Don Schellenberg
1 × $6.00 -
×
 After Hour Trading Made Easy with Joe Duarte & Roland Burke
1 × $6.00
After Hour Trading Made Easy with Joe Duarte & Roland Burke
1 × $6.00 -
×
 $20 – 52k 20 pips a day challange with Rafał Zuchowicz - TopMasterTrader
1 × $5.00
$20 – 52k 20 pips a day challange with Rafał Zuchowicz - TopMasterTrader
1 × $5.00 -
×
 Advanced Forex Patterns with Vic Noble & Darko Ali
1 × $39.00
Advanced Forex Patterns with Vic Noble & Darko Ali
1 × $39.00 -
×
 Traders Winning Edge with Adrienne Laris Toghraie
1 × $6.00
Traders Winning Edge with Adrienne Laris Toghraie
1 × $6.00 -
×
 JokerSZN Course with David
1 × $20.00
JokerSZN Course with David
1 × $20.00 -
×
 Fractal Flow Strategy Video Course with Fractal Flow Pro
1 × $6.00
Fractal Flow Strategy Video Course with Fractal Flow Pro
1 × $6.00 -
×
 Butterfly and Condor Workshop with Aeromir
1 × $15.00
Butterfly and Condor Workshop with Aeromir
1 × $15.00 -
×
 The Best Option Trading Course with David Jaffee - Best Stock Strategy
1 × $15.00
The Best Option Trading Course with David Jaffee - Best Stock Strategy
1 × $15.00 -
×
 Gillen Predicts with Jack Gillen
1 × $6.00
Gillen Predicts with Jack Gillen
1 × $6.00 -
×
 Alexander Elder Full Courses Package
1 × $6.00
Alexander Elder Full Courses Package
1 × $6.00 -
×
 Crystal Ball Pack PLUS bonus Live Trade By Pat Mitchell - Trick Trades
1 × $20.00
Crystal Ball Pack PLUS bonus Live Trade By Pat Mitchell - Trick Trades
1 × $20.00 -
×
 Artificial Neural Networks Technology with Dave Anderson, George McNeill
1 × $6.00
Artificial Neural Networks Technology with Dave Anderson, George McNeill
1 × $6.00 -
×
 Larry Williams Newsletters (1994-1997)
1 × $6.00
Larry Williams Newsletters (1994-1997)
1 × $6.00 -
×
 The Cycles and The Codes with Myles Wilson-Walker
1 × $15.00
The Cycles and The Codes with Myles Wilson-Walker
1 × $15.00 -
×
 0 DTE Options Trading Workshop with Aeromir Corporation
1 × $15.00
0 DTE Options Trading Workshop with Aeromir Corporation
1 × $15.00 -
×
 The Apple Way with Jeffrey Cruikshank
1 × $6.00
The Apple Way with Jeffrey Cruikshank
1 × $6.00 -
×
 Candle Charting Essentials & Beyond Volume 1 & 2 with Steve Nison - Candle Charts
1 × $15.00
Candle Charting Essentials & Beyond Volume 1 & 2 with Steve Nison - Candle Charts
1 × $15.00 -
×
 Trade What You See, Not What You Believe with Larry Pesavento
1 × $6.00
Trade What You See, Not What You Believe with Larry Pesavento
1 × $6.00 -
×
 The Ticker Investment Digest Articles
1 × $6.00
The Ticker Investment Digest Articles
1 × $6.00 -
×
 Finding Astrocycles with an Ephemeris - Hans Hannula
1 × $6.00
Finding Astrocycles with an Ephemeris - Hans Hannula
1 × $6.00 -
×
 Fibonacci – CCI Workshop Recording Series (2006 & 2008)
1 × $6.00
Fibonacci – CCI Workshop Recording Series (2006 & 2008)
1 × $6.00 -
×
 TOP Momentum Bundle with Top Trade Tools
1 × $62.00
TOP Momentum Bundle with Top Trade Tools
1 × $62.00 -
×
 Predators & Profits with Martin Howell & John Bogle
1 × $6.00
Predators & Profits with Martin Howell & John Bogle
1 × $6.00 -
×
 Original Curriculum with Home Options Trading Course
1 × $6.00
Original Curriculum with Home Options Trading Course
1 × $6.00 -
×
 Complete Series
1 × $31.00
Complete Series
1 × $31.00 -
×
 ActiveBeta Indexes. Capturing Systematic Sources of Active Equity Returns (HTML) with Andrew Lo
1 × $6.00
ActiveBeta Indexes. Capturing Systematic Sources of Active Equity Returns (HTML) with Andrew Lo
1 × $6.00 -
×
 WITS Turbo Seminars with Brian James Sklenka
1 × $6.00
WITS Turbo Seminars with Brian James Sklenka
1 × $6.00 -
×
 The Bare Essentials Of Investing: Teaching The Horse To Talk with Harold Bierman
1 × $6.00
The Bare Essentials Of Investing: Teaching The Horse To Talk with Harold Bierman
1 × $6.00 -
×
 Best of Livestock with Timothy Sykes
1 × $5.00
Best of Livestock with Timothy Sykes
1 × $5.00 -
×
 Simpler Traders - Ultimate Guide to Debit Spreads (PREMIUM)
1 × $39.00
Simpler Traders - Ultimate Guide to Debit Spreads (PREMIUM)
1 × $39.00 -
×
 An Empirical Ananlysis of Stock Market Sentiment (Article) with Andrea Terzi
1 × $6.00
An Empirical Ananlysis of Stock Market Sentiment (Article) with Andrea Terzi
1 × $6.00 -
×
 Preview of Markets with George Bayer
1 × $6.00
Preview of Markets with George Bayer
1 × $6.00 -
×
 White Phoenix’s The Smart (Money) Approach to Trading with Jayson Casper
1 × $39.00
White Phoenix’s The Smart (Money) Approach to Trading with Jayson Casper
1 × $39.00 -
×
 The Binary Trigger (Video, Books) with John Piper
1 × $6.00
The Binary Trigger (Video, Books) with John Piper
1 × $6.00 -
×
 Smart Money Trading Course with Prosperity Academy
1 × $5.00
Smart Money Trading Course with Prosperity Academy
1 × $5.00 -
×
 Traders Classroom Collection Volume 1-4 with Jeffrey Kennedy
1 × $15.00
Traders Classroom Collection Volume 1-4 with Jeffrey Kennedy
1 × $15.00 -
×
 Trading 3SMA System with Hector DeVille
1 × $6.00
Trading 3SMA System with Hector DeVille
1 × $6.00 -
×
 Advent Forex Course with Cecil Robles
1 × $6.00
Advent Forex Course with Cecil Robles
1 × $6.00 -
×
 7 Day FX Mastery Course with Market Masters
1 × $6.00
7 Day FX Mastery Course with Market Masters
1 × $6.00 -
×
 THE ART OF ADJUSTING IN 2017
1 × $6.00
THE ART OF ADJUSTING IN 2017
1 × $6.00 -
×
 Day Trading with Volume Profile and Orderflow - Price Action Volume Trader
1 × $6.00
Day Trading with Volume Profile and Orderflow - Price Action Volume Trader
1 × $6.00 -
×
 Swing Trading (Italian) with Guiuseppe Migliorino
1 × $6.00
Swing Trading (Italian) with Guiuseppe Migliorino
1 × $6.00 -
×
 Traders Secret Success Package. Symmetry Wave Trading with Michael Gur Dillon
1 × $6.00
Traders Secret Success Package. Symmetry Wave Trading with Michael Gur Dillon
1 × $6.00 -
×
 A Complete Beginner to Advanced Trading Mentorship Program with Habby Forex Trading Academy
1 × $5.00
A Complete Beginner to Advanced Trading Mentorship Program with Habby Forex Trading Academy
1 × $5.00 -
×
 Market Controller Course with Controller FX
1 × $5.00
Market Controller Course with Controller FX
1 × $5.00 -
×
 Day Trading and Swing Trading Futures with Price Action by Humberto Malaspina
1 × $5.00
Day Trading and Swing Trading Futures with Price Action by Humberto Malaspina
1 × $5.00 -
×
 5 Day Bootcamp with AWFX AnthonysWorld
1 × $34.00
5 Day Bootcamp with AWFX AnthonysWorld
1 × $34.00 -
×
 DFX Scalping Strategy Course with Disciplined FX
1 × $23.00
DFX Scalping Strategy Course with Disciplined FX
1 × $23.00 -
×
 5 Steps to Investment Success with Tyler Bolhorn
1 × $6.00
5 Steps to Investment Success with Tyler Bolhorn
1 × $6.00 -
×
 AbleTrend with John Wang & Grace Wang
1 × $6.00
AbleTrend with John Wang & Grace Wang
1 × $6.00 -
×
 Simple Methods for Detecting Buying and Selling Points in Securities with James Liveright
1 × $6.00
Simple Methods for Detecting Buying and Selling Points in Securities with James Liveright
1 × $6.00 -
×
 Sacredscience - Sepharial Arcana – Rubber
1 × $6.00
Sacredscience - Sepharial Arcana – Rubber
1 × $6.00 -
×
 Learn how to trade Volatility 75 Index Technical Analysis with Patrick Muke
1 × $6.00
Learn how to trade Volatility 75 Index Technical Analysis with Patrick Muke
1 × $6.00 -
×
 The Random Character of Interest Rates with Joseph Murphy
1 × $6.00
The Random Character of Interest Rates with Joseph Murphy
1 × $6.00 -
×
 Advanced Trading Course with Edney Pinheiro
1 × $5.00
Advanced Trading Course with Edney Pinheiro
1 × $5.00 -
×
 Forex Profit Formula System with Jason Fielder
1 × $6.00
Forex Profit Formula System with Jason Fielder
1 × $6.00 -
×
 Traders Workshop – Forex Full Course with Jason Stapleton
1 × $6.00
Traders Workshop – Forex Full Course with Jason Stapleton
1 × $6.00 -
×
 Swing Trading Futures & Commodities with the COT
1 × $93.00
Swing Trading Futures & Commodities with the COT
1 × $93.00 -
×
 Alternative Beta Strategies & Hedge Fund Replication with Lars Jaeger & Jeffrey Pease
1 × $6.00
Alternative Beta Strategies & Hedge Fund Replication with Lars Jaeger & Jeffrey Pease
1 × $6.00 -
×
 An Introduction to Option Trading Success with James Bittman
1 × $6.00
An Introduction to Option Trading Success with James Bittman
1 × $6.00 -
×
 FX Prosperity Academy with Leonard Williams Jr
1 × $5.00
FX Prosperity Academy with Leonard Williams Jr
1 × $5.00 -
×
 TradeCraft: Your Path to Peak Performance Trading By Adam Grimes
1 × $15.00
TradeCraft: Your Path to Peak Performance Trading By Adam Grimes
1 × $15.00 -
×
 A PLAN TO MAKE $4K MONTHLY ON $20K with Dan Sheridan - Sheridan Options Mentoring
1 × $15.00
A PLAN TO MAKE $4K MONTHLY ON $20K with Dan Sheridan - Sheridan Options Mentoring
1 × $15.00 -
×
 Stock Trading Simplified - 3 DVD + PDF Workbook with John Person
1 × $6.00
Stock Trading Simplified - 3 DVD + PDF Workbook with John Person
1 × $6.00 -
×
 Financial Fortress with TradeSmart University
1 × $6.00
Financial Fortress with TradeSmart University
1 × $6.00 -
×
 Annual Forecast Reports - Forecast 2023 with Larry Williams
1 × $8.00
Annual Forecast Reports - Forecast 2023 with Larry Williams
1 × $8.00 -
×
 3 Swing Trading Examples, With Charts, Instructions, And Definitions To Get You Started by Alan Farley
1 × $6.00
3 Swing Trading Examples, With Charts, Instructions, And Definitions To Get You Started by Alan Farley
1 × $6.00 -
×
 Trading For Busy People with Josias Kere
1 × $6.00
Trading For Busy People with Josias Kere
1 × $6.00 -
×
 The Complete Guide to Multiple Time Frame Analysis & Reading Price Action with Aiman Almansoori
1 × $13.00
The Complete Guide to Multiple Time Frame Analysis & Reading Price Action with Aiman Almansoori
1 × $13.00 -
×
 6 (The Proper BackGround)
1 × $6.00
6 (The Proper BackGround)
1 × $6.00 -
×
 FasTrack Premium with Note Conference
1 × $78.00
FasTrack Premium with Note Conference
1 × $78.00 -
×
 The Deadly 7 Sins of Investing with Maury Fertig
1 × $6.00
The Deadly 7 Sins of Investing with Maury Fertig
1 × $6.00 -
×
 The Prop Trading Code with Brannigan Barrett - Axia Futures
1 × $23.00
The Prop Trading Code with Brannigan Barrett - Axia Futures
1 × $23.00 -
×
 ProfileTraders - Advanced Market Profile (May 2014)
1 × $6.00
ProfileTraders - Advanced Market Profile (May 2014)
1 × $6.00 -
×
 Futures & Options for Dummies with Joe Duarte
1 × $6.00
Futures & Options for Dummies with Joe Duarte
1 × $6.00 -
×
 Options Trading. The Hidden Reality Course with Charles Cottle
1 × $6.00
Options Trading. The Hidden Reality Course with Charles Cottle
1 × $6.00 -
×
 Forecast 2024 Clarification with Larry Williams
1 × $15.00
Forecast 2024 Clarification with Larry Williams
1 × $15.00
 with Arthur A.Hill")
Introduction to Candlestick (Article) with Arthur A.Hill
$6.00
File Size: Coming soon!
Delivery Time: 1–12 hours
Media Type: Online Course
Content Proof: Watch Here!
You may check content proof of “Introduction to Candlestick (Article) with Arthur A.Hill” below:
 with Arthur A.Hill")
Introduction to Candlestick (Article) with Arthur A. Hill
Candlestick charting is an essential tool for traders and investors, providing a visual representation of price movements. Arthur A. Hill, a renowned expert in technical analysis, offers a comprehensive introduction to candlestick charts, making them accessible to beginners and valuable for experienced traders. Let’s explore the basics of candlestick charting and how it can enhance your trading strategy.
What is a Candlestick Chart?
A candlestick chart is a type of financial chart used to describe price movements of a security, derivative, or currency.
Components of a Candlestick
- Body: The thick part of the candlestick, showing the opening and closing prices.
- Wicks/Shadows: The thin lines above and below the body, indicating the highest and lowest prices during the period.
- Color: Traditionally, a green or white body indicates a closing price higher than the opening price, while a red or black body indicates a closing price lower than the opening price.
History of Candlestick Charting
Candlestick charting originated in Japan over 300 years ago, developed by rice traders to track market prices and daily supply and demand.
Evolution of Candlestick Charts
Over the centuries, candlestick charting has evolved and gained popularity worldwide, becoming a staple in technical analysis.
Introduction to Western Markets
Candlestick charts were introduced to the Western financial markets in the late 20th century and quickly became popular among traders.
Advantages of Candlestick Charts
Candlestick charts offer several advantages over traditional bar charts and line charts.
Visual Clarity
Candlestick charts provide a clear and concise representation of price movements, making it easier to interpret market trends.
Immediate Insight
The color-coded bodies and wicks offer immediate insight into market sentiment and price direction.
Pattern Recognition
Candlestick charts are excellent for identifying patterns that can predict future price movements.
Common Candlestick Patterns
- Doji: Indicates indecision in the market.
- Hammer: Suggests a potential reversal from a downtrend.
- Engulfing: A strong signal of a potential trend reversal.
Basic Candlestick Patterns
Understanding basic candlestick patterns is crucial for any trader looking to use this charting method effectively.
Bullish Patterns
Bullish patterns indicate potential upward price movements.
Hammer and Inverted Hammer
- Hammer: A candlestick with a small body and a long lower wick, indicating potential reversal from a downtrend.
- Inverted Hammer: Similar to the hammer but with a long upper wick, suggesting a potential bullish reversal.
Bearish Patterns
Bearish patterns suggest potential downward price movements.
Shooting Star and Hanging Man
- Shooting Star: A candlestick with a small body and a long upper wick, indicating a potential reversal from an uptrend.
- Hanging Man: Similar to the hammer but occurs after an uptrend, signaling a potential bearish reversal.
Advanced Candlestick Patterns
For more experienced traders, advanced candlestick patterns provide deeper insights into market trends.
Engulfing Patterns
Engulfing patterns occur when a smaller candlestick is followed by a larger candlestick that completely engulfs the smaller one.
Bullish Engulfing
A bullish engulfing pattern occurs at the bottom of a downtrend and signals a potential upward reversal.
Bearish Engulfing
A bearish engulfing pattern appears at the top of an uptrend and suggests a potential downward reversal.
Morning Star and Evening Star
These patterns are three-candlestick formations that indicate strong trend reversals.
Morning Star
The morning star pattern consists of a bearish candle, a small indecisive candle, and a bullish candle, indicating a bullish reversal.
Evening Star
The evening star pattern includes a bullish candle, a small indecisive candle, and a bearish candle, suggesting a bearish reversal.
Incorporating Candlestick Charts into Your Trading Strategy
Candlestick charts are versatile and can be integrated into various trading strategies.
Combining with Other Indicators
Enhance the effectiveness of candlestick charts by combining them with other technical indicators.
Popular Indicators to Combine
- Moving Averages: Confirm trends and potential reversals.
- Relative Strength Index (RSI): Identify overbought or oversold conditions.
- Bollinger Bands: Measure market volatility and potential breakouts.
Setting Up Your Trading Platform
Most trading platforms offer candlestick charting options. Ensure you customize your charts to suit your trading style.
Customization Tips
- Time Frames: Choose appropriate time frames for your trading strategy.
- Color Schemes: Use distinct colors for bullish and bearish candles.
- Indicators: Add complementary indicators to your charts.
Common Mistakes to Avoid
Even with a robust understanding of candlestick charts, traders can make mistakes that affect their performance.
Over-reliance on Patterns
Relying solely on candlestick patterns without considering other factors can lead to false signals.
Diversify Analysis
Always use candlestick patterns in conjunction with other forms of analysis and market indicators.
Ignoring Market Context
Candlestick patterns can be misleading if not considered within the broader market context.
Comprehensive Analysis
Incorporate fundamental analysis and overall market trends to validate candlestick signals.
Conclusion
Candlestick charting, as introduced by Arthur A. Hill, offers a powerful tool for traders to understand and predict market movements. By mastering basic and advanced patterns, combining them with other technical indicators, and avoiding common pitfalls, traders can enhance their market analysis and trading performance. Whether you’re new to trading or an experienced trader, candlestick charts provide valuable insights that can guide your investment decisions.
Frequently Asked Questions:
- What is a candlestick chart?
A candlestick chart is a type of financial chart used to represent price movements over a specific period, showing the opening, closing, high, and low prices. - Why are candlestick charts popular among traders?
They provide visual clarity and help in identifying patterns that can predict future price movements. - What are some basic candlestick patterns?
Basic patterns include the hammer, inverted hammer, shooting star, and hanging man, which indicate potential market reversals. - Can candlestick charts be used with other technical indicators?
Yes, combining candlestick charts with indicators like moving averages, RSI, and Bollinger Bands enhances their effectiveness. - How can I avoid common mistakes when using candlestick charts?
Avoid over-relying on patterns and always consider the broader market context and other forms of analysis.
Be the first to review “Introduction to Candlestick (Article) with Arthur A.Hill”
You must be logged in to post a review.
Related products
Original price was: $1,849.00.$15.00Current price is: $15.00.

Original price was: $299.00.$8.00Current price is: $8.00.
Forex Trading
Original price was: $2,997.00.$23.00Current price is: $23.00.
Original price was: $1,200.00.$23.00Current price is: $23.00.
Original price was: $197.00.$5.00Current price is: $5.00.
Forex Trading
Original price was: $500.00.$5.00Current price is: $5.00.

Original price was: $799.00.$15.00Current price is: $15.00.
Forex Trading
The Complete Guide to Multiple Time Frame Analysis & Reading Price Action with Aiman Almansoori
Original price was: $1,399.00.$13.00Current price is: $13.00.
Original price was: $700.00.$39.00Current price is: $39.00.
Original price was: $1,800.00.$54.00Current price is: $54.00.
Original price was: $999.00.$5.00Current price is: $5.00.

Forex Trading
Quantamentals – The Next Great Forefront Of Trading and Investing with Trading Markets
Original price was: $1,495.00.$8.00Current price is: $8.00.

Original price was: $997.00.$8.00Current price is: $8.00.

Forex Trading
Original price was: $797.00.$10.00Current price is: $10.00.

Forex Trading
Original price was: $239.00.$8.00Current price is: $8.00.
Forex Trading
Original price was: $249.00.$15.00Current price is: $15.00.
Forex Trading
Original price was: $999.00.$15.00Current price is: $15.00.

Forex Trading
Original price was: $397.00.$31.00Current price is: $31.00.

Original price was: $310.00.$23.00Current price is: $23.00.
Original price was: $649.00.$20.00Current price is: $20.00.

Reviews
There are no reviews yet.