-
×
 Crypto Trading Academy with Cheeky Investor - Aussie Day Trader
1 × $13.00
Crypto Trading Academy with Cheeky Investor - Aussie Day Trader
1 × $13.00 -
×
 The Complete Guide to Multiple Time Frame Analysis & Reading Price Action with Aiman Almansoori
1 × $13.00
The Complete Guide to Multiple Time Frame Analysis & Reading Price Action with Aiman Almansoori
1 × $13.00 -
×
 Matrix Spread Options Trading Course with Base Camp Trading
1 × $31.00
Matrix Spread Options Trading Course with Base Camp Trading
1 × $31.00 -
×
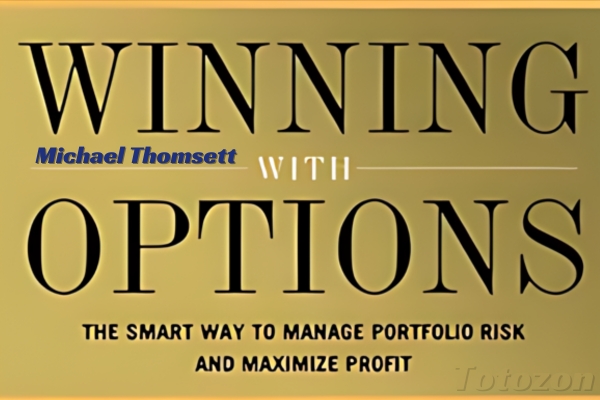 Winning with Options with Michael Thomsett
1 × $6.00
Winning with Options with Michael Thomsett
1 × $6.00 -
×
 WondaFX Signature Strategy with WondaFX
1 × $5.00
WondaFX Signature Strategy with WondaFX
1 × $5.00 -
×
 Alternative Beta Strategies & Hedge Fund Replication with Lars Jaeger & Jeffrey Pease
1 × $6.00
Alternative Beta Strategies & Hedge Fund Replication with Lars Jaeger & Jeffrey Pease
1 × $6.00 -
×
 W. D Gann 's Square Of 9 Applied To Modern Markets with Sean Avidar - Hexatrade350
1 × $23.00
W. D Gann 's Square Of 9 Applied To Modern Markets with Sean Avidar - Hexatrade350
1 × $23.00 -
×
 $20 – 52k 20 pips a day challange with Rafał Zuchowicz - TopMasterTrader
1 × $5.00
$20 – 52k 20 pips a day challange with Rafał Zuchowicz - TopMasterTrader
1 × $5.00 -
×
 Options Trading & Ultimate MasterClass With Tyrone Abela - FX Evolution
1 × $54.00
Options Trading & Ultimate MasterClass With Tyrone Abela - FX Evolution
1 × $54.00 -
×
 Trading Volatility - The Ultimate Course with Master Trader
1 × $69.00
Trading Volatility - The Ultimate Course with Master Trader
1 × $69.00 -
×
 Butterfly and Condor Workshop with Aeromir
1 × $15.00
Butterfly and Condor Workshop with Aeromir
1 × $15.00 -
×
 A Trader's Guide to Self-Discipline: Proven Techniques to Improve Trading Profits
1 × $6.00
A Trader's Guide to Self-Discipline: Proven Techniques to Improve Trading Profits
1 × $6.00 -
×
 Advanced Spread Trading with Guy Bower - MasterClass Trader
1 × $15.00
Advanced Spread Trading with Guy Bower - MasterClass Trader
1 × $15.00 -
×
 How To Read The Market Professionally with TradeSmart
1 × $27.00
How To Read The Market Professionally with TradeSmart
1 × $27.00 -
×
 Forecast 2024 Clarification with Larry Williams
1 × $15.00
Forecast 2024 Clarification with Larry Williams
1 × $15.00 -
×
 Coulda, woulda, shoulda with Charles Cottle
1 × $6.00
Coulda, woulda, shoulda with Charles Cottle
1 × $6.00 -
×
 White Phoenix’s The Smart (Money) Approach to Trading with Jayson Casper
1 × $39.00
White Phoenix’s The Smart (Money) Approach to Trading with Jayson Casper
1 × $39.00 -
×
 High Probability Trading Using Elliott Wave And Fibonacci Analysis withVic Patel - Forex Training Group
1 × $10.00
High Probability Trading Using Elliott Wave And Fibonacci Analysis withVic Patel - Forex Training Group
1 × $10.00 -
×
 Crystal Ball Pack PLUS bonus Live Trade By Pat Mitchell - Trick Trades
1 × $20.00
Crystal Ball Pack PLUS bonus Live Trade By Pat Mitchell - Trick Trades
1 × $20.00 -
×
 Artificial Neural Networks Technology with Dave Anderson, George McNeill
1 × $6.00
Artificial Neural Networks Technology with Dave Anderson, George McNeill
1 × $6.00 -
×
 A14 Weekly Options Strategy Workshop 2023 with Amy Meissner - Aeromir
1 × $23.00
A14 Weekly Options Strategy Workshop 2023 with Amy Meissner - Aeromir
1 × $23.00 -
×
 TRADING NFX Course with Andrew NFX
1 × $5.00
TRADING NFX Course with Andrew NFX
1 × $5.00 -
×
 AI For Traders with Trading Markets
1 × $31.00
AI For Traders with Trading Markets
1 × $31.00 -
×
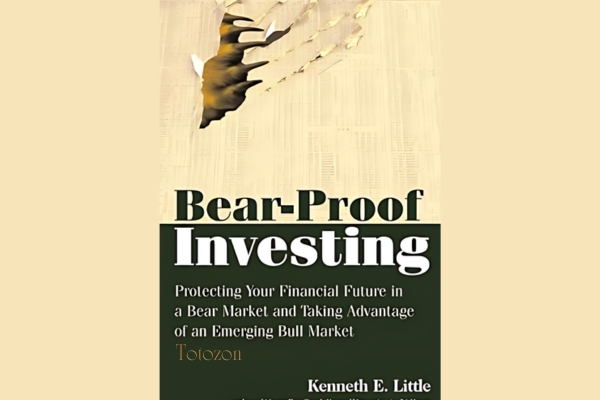 BearProof Investing with Kenneth Little
1 × $6.00
BearProof Investing with Kenneth Little
1 × $6.00 -
×
 Bond Market Course with The Macro Compass
1 × $15.00
Bond Market Course with The Macro Compass
1 × $15.00 -
×
 The Python for Traders Masterclass with Mr James
1 × $10.00
The Python for Traders Masterclass with Mr James
1 × $10.00 -
×
 0 DTE Options Trading Workshop with Aeromir Corporation
1 × $15.00
0 DTE Options Trading Workshop with Aeromir Corporation
1 × $15.00 -
×
 Core Strategy Program + Extended Learning Track with Ota Courses
1 × $124.00
Core Strategy Program + Extended Learning Track with Ota Courses
1 × $124.00 -
×
 ICT Prodigy Trading Course – $650K in Payouts with Alex Solignani
1 × $15.00
ICT Prodigy Trading Course – $650K in Payouts with Alex Solignani
1 × $15.00 -
×
 Ultimate Trading Course with Dodgy's Dungeon
1 × $8.00
Ultimate Trading Course with Dodgy's Dungeon
1 × $8.00 -
×
 Compass Trading System with Right Line Trading
1 × $39.00
Compass Trading System with Right Line Trading
1 × $39.00 -
×
 7 Days Options Masters Course with John Carter
1 × $54.00
7 Days Options Masters Course with John Carter
1 × $54.00 -
×
 The Prop Trading Code with Brannigan Barrett - Axia Futures
1 × $23.00
The Prop Trading Code with Brannigan Barrett - Axia Futures
1 × $23.00 -
×
 The Best Option Trading Course with David Jaffee - Best Stock Strategy
1 × $15.00
The Best Option Trading Course with David Jaffee - Best Stock Strategy
1 × $15.00 -
×
 Using Robert’s Indicators with Rob Hoffman
1 × $6.00
Using Robert’s Indicators with Rob Hoffman
1 × $6.00 -
×
 CREDIT SPREAD SURGERY - Bear Call and Bull Put Mastery with Hari Swaminathan
1 × $6.00
CREDIT SPREAD SURGERY - Bear Call and Bull Put Mastery with Hari Swaminathan
1 × $6.00 -
×
 The A14 Weekly Option Strategy Workshop with Amy Meissner
1 × $23.00
The A14 Weekly Option Strategy Workshop with Amy Meissner
1 × $23.00 -
×
 Order flow self-study training program with iMFtracker
1 × $10.00
Order flow self-study training program with iMFtracker
1 × $10.00 -
×
 Trading Short TermSame Day Trades Sep 2023 with Dan Sheridan & Mark Fenton - Sheridan Options Mentoring
1 × $31.00
Trading Short TermSame Day Trades Sep 2023 with Dan Sheridan & Mark Fenton - Sheridan Options Mentoring
1 × $31.00 -
×
 A Course in Trading with Donald Mack & Wetsel Market Bureau
1 × $6.00
A Course in Trading with Donald Mack & Wetsel Market Bureau
1 × $6.00 -
×
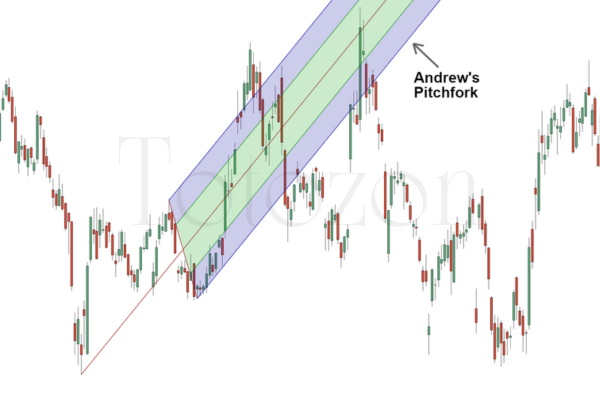 Andrews Pitchfork Basic
1 × $6.00
Andrews Pitchfork Basic
1 × $6.00 -
×
 30 Day Masterclass with Joe Elite Trader Hub ICT
1 × $6.00
30 Day Masterclass with Joe Elite Trader Hub ICT
1 × $6.00 -
×
 Currency Trading Seminar with Peter Bain
1 × $6.00
Currency Trading Seminar with Peter Bain
1 × $6.00 -
×
 Volatility and Timing with Jay Kaeppel – The Option Trader’s Guide to Probability
1 × $6.00
Volatility and Timing with Jay Kaeppel – The Option Trader’s Guide to Probability
1 × $6.00 -
×
 Beginners Guide to How SimplerOptions Uses ThinkorSwim with Henry Gambell
1 × $15.00
Beginners Guide to How SimplerOptions Uses ThinkorSwim with Henry Gambell
1 × $15.00 -
×
 TradeCraft: Your Path to Peak Performance Trading By Adam Grimes
1 × $15.00
TradeCraft: Your Path to Peak Performance Trading By Adam Grimes
1 × $15.00 -
×
 Best of the Best: Collars with Amy Meissner & Scott Ruble
1 × $15.00
Best of the Best: Collars with Amy Meissner & Scott Ruble
1 × $15.00 -
×
 Tradeguider - Wyckoff VSA eBook Collection
1 × $23.00
Tradeguider - Wyckoff VSA eBook Collection
1 × $23.00 -
×
 The Indices Orderflow Masterclass with The Forex Scalpers
1 × $23.00
The Indices Orderflow Masterclass with The Forex Scalpers
1 × $23.00 -
×
 Scalp Strategy and Flipping Small Accounts with Opes Trading Group
1 × $5.00
Scalp Strategy and Flipping Small Accounts with Opes Trading Group
1 × $5.00

Practical Applications of Candlestick Charts with Gary Wagner
$6.00
File Size: Coming soon!
Delivery Time: 1–12 hours
Media Type: Online Course
Content Proof: Watch Here!
You may check content proof of “Practical Applications of Candlestick Charts with Gary Wagner” below:

Practical Applications of Candlestick Charts with Gary Wagner
Candlestick charts are a powerful tool for traders looking to understand market movements and make informed trading decisions. Gary Wagner, an expert in technical analysis, has shared valuable insights into the practical applications of these charts. In this article, we will delve into the intricacies of candlestick charts and explore how they can be effectively utilized in trading.
Introduction to Candlestick Charts
What Are Candlestick Charts?
Candlestick charts are a type of financial chart used to represent price movements over a specific period. Each candlestick displays four key pieces of information: the opening price, closing price, high, and low.
Who is Gary Wagner?
Gary Wagner is a renowned technical analyst and the co-founder of TheGoldForecast.com. With years of experience in the financial markets, he has become an authority on the use of candlestick charts for trading.
Components of a Candlestick
The Body
Bullish and Bearish Candles
The body of a candlestick represents the range between the opening and closing prices. A bullish candle indicates a price increase, while a bearish candle shows a price decrease.
The Wick
Upper and Lower Shadows
The wick, or shadow, represents the highest and lowest prices reached during the trading period. The upper shadow indicates the high, and the lower shadow shows the low.
Color and Patterns
Traditional Colors
Typically, a bullish candle is green or white, and a bearish candle is red or black. These colors help traders quickly identify market trends.
Reading Candlestick Charts
Single Candlestick Patterns
Doji
A doji occurs when the opening and closing prices are nearly the same, indicating market indecision.
Hammer
A hammer has a small body with a long lower wick, suggesting a potential reversal from a downtrend.
Multiple Candlestick Patterns
Engulfing Patterns
A bullish engulfing pattern occurs when a small bearish candle is followed by a larger bullish candle, indicating a potential upward reversal.
Harami
A harami pattern consists of a large candle followed by a smaller candle within the body of the first, signaling potential market reversals.
Practical Applications in Trading
Identifying Trends
Uptrends and Downtrends
Candlestick charts help identify trends. An uptrend is characterized by a series of bullish candles, while a downtrend consists of bearish candles.
Spotting Reversals
Key Reversal Patterns
Patterns like the doji, hammer, and engulfing patterns can signal potential market reversals, helping traders make timely decisions.
Supporting Indicators
Moving Averages
Combining candlestick patterns with moving averages can provide more accurate trading signals.
Relative Strength Index (RSI)
Using RSI alongside candlestick charts helps confirm overbought or oversold conditions.
Developing a Trading Strategy
Step-by-Step Guide
Step 1: Analyze Candlestick Patterns
Begin by identifying key candlestick patterns on your chart.
Step 2: Confirm with Indicators
Use supporting indicators like moving averages and RSI to confirm your analysis.
Step 3: Set Entry and Exit Points
Determine your entry and exit points based on identified patterns and confirmed signals.
Risk Management
Setting Stop-Loss Orders
Implement stop-loss orders to protect your trades from significant losses.
Position Sizing
Adjust your position size according to your risk tolerance and trading strategy.
Common Mistakes to Avoid
Overtrading
Avoiding Excessive Trades
Overtrading can lead to higher transaction costs and reduced profitability. Focus on quality trades rather than quantity.
Ignoring Confirmation
Importance of Confirmation
Relying solely on candlestick patterns without confirmation from other indicators can lead to false signals.
Tips for Success
Continuous Learning
Educational Resources
Continuously educate yourself on candlestick patterns and technical analysis to improve your trading skills.
Regular Practice
Paper Trading
Practice your strategies through paper trading to gain confidence and refine your techniques without risking real money.
Conclusion
Candlestick charts offer a wealth of information that can enhance your trading strategy. By understanding and applying the insights shared by Gary Wagner, traders can make more informed decisions and improve their trading performance. Whether you’re a novice or an experienced trader, mastering candlestick charts can provide a significant edge in the financial markets.
FAQs
1. What are the key components of a candlestick?
A candlestick has a body, which shows the range between the opening and closing prices, and wicks or shadows, which indicate the highest and lowest prices during the trading period.
2. How can candlestick patterns help identify market trends?
Candlestick patterns, such as uptrends and downtrends, help traders identify the overall direction of the market and potential reversal points.
3. Why is it important to confirm candlestick patterns with other indicators?
Confirming candlestick patterns with other indicators like moving averages and RSI reduces the risk of false signals and enhances the accuracy of trading decisions.
4. What are some common candlestick patterns to look for?
Common patterns include the doji, hammer, bullish engulfing, and harami, which can indicate market indecision, potential reversals, and trend continuations.
5. How can I manage risk when trading with candlestick charts?
Implement risk management strategies such as setting stop-loss orders and adjusting position sizes according to your risk tolerance and trading strategy.
Be the first to review “Practical Applications of Candlestick Charts with Gary Wagner”
You must be logged in to post a review.
Related products
Forex Trading
Original price was: $397.00.$31.00Current price is: $31.00.
Original price was: $997.00.$13.00Current price is: $13.00.

Forex Trading
Quantamentals – The Next Great Forefront Of Trading and Investing with Trading Markets
Original price was: $1,495.00.$8.00Current price is: $8.00.
Original price was: $497.00.$31.00Current price is: $31.00.
Forex Trading
Original price was: $1,098.00.$39.00Current price is: $39.00.
Forex Trading
Original price was: $4,997.00.$27.00Current price is: $27.00.
Original price was: $450.00.$23.00Current price is: $23.00.
Original price was: $799.00.$15.00Current price is: $15.00.

Forex Trading
Original price was: $850.00.$23.00Current price is: $23.00.
Forex Trading
Original price was: $550.00.$5.00Current price is: $5.00.
Forex Trading
The Complete Guide to Multiple Time Frame Analysis & Reading Price Action with Aiman Almansoori
Original price was: $1,399.00.$13.00Current price is: $13.00.
Original price was: $197.00.$5.00Current price is: $5.00.
Original price was: $2,120.00.$15.00Current price is: $15.00.
Forex Trading
Original price was: $2,995.00.$31.00Current price is: $31.00.
Forex Trading
Original price was: $1,898.00.$10.00Current price is: $10.00.

Forex Trading
Original price was: $2,997.00.$23.00Current price is: $23.00.
Forex Trading
Original price was: $999.00.$15.00Current price is: $15.00.
Original price was: $1,849.00.$15.00Current price is: $15.00.
Forex Trading
Original price was: $797.00.$10.00Current price is: $10.00.

Original price was: $299.00.$8.00Current price is: $8.00.

Reviews
There are no reviews yet.