-
×
 Wyckoff Stock Market Institute
1 × $5.00
Wyckoff Stock Market Institute
1 × $5.00 -
×
 Stock Trader`s Almanac 2012 with Jeffrey Hirsch & Yale Hirsch
1 × $6.00
Stock Trader`s Almanac 2012 with Jeffrey Hirsch & Yale Hirsch
1 × $6.00 -
×
 Dow Theory Redux with Michael Sheimo
1 × $6.00
Dow Theory Redux with Michael Sheimo
1 × $6.00 -
×
 Gold XAUUSD Trading Strategy - The Gold Box with The Trading Guide
1 × $5.00
Gold XAUUSD Trading Strategy - The Gold Box with The Trading Guide
1 × $5.00 -
×
 Market Fluidity
1 × $6.00
Market Fluidity
1 × $6.00 -
×
 OTC Oracle Course - PENNY WHALE with Simple Trade
1 × $31.00
OTC Oracle Course - PENNY WHALE with Simple Trade
1 × $31.00 -
×
 Forecast for 2010 with Larry Williams
1 × $6.00
Forecast for 2010 with Larry Williams
1 × $6.00 -
×
 The Complete Guide to Multiple Time Frame Analysis & Reading Price Action with Aiman Almansoori
1 × $13.00
The Complete Guide to Multiple Time Frame Analysis & Reading Price Action with Aiman Almansoori
1 × $13.00 -
×
 Day trading master class with BKForex
1 × $6.00
Day trading master class with BKForex
1 × $6.00 -
×
 George Bayer Soft 1.02
1 × $6.00
George Bayer Soft 1.02
1 × $6.00 -
×
 Elite Day Trading Bundle (Series 4) with The Swag Academy
1 × $101.00
Elite Day Trading Bundle (Series 4) with The Swag Academy
1 × $101.00 -
×
 W.D. Gann’s Best Trading Systems with Myles Wilson-Walker
1 × $27.00
W.D. Gann’s Best Trading Systems with Myles Wilson-Walker
1 × $27.00 -
×
 Killmex Academy Education Course
1 × $5.00
Killmex Academy Education Course
1 × $5.00 -
×
 Mindover Markets Enhanced: The Intensive Series 2 with Jim Dalton
1 × $20.00
Mindover Markets Enhanced: The Intensive Series 2 with Jim Dalton
1 × $20.00 -
×
 LIVE TRADERS - TECHNICAL STOCK TRADING
1 × $23.00
LIVE TRADERS - TECHNICAL STOCK TRADING
1 × $23.00 -
×
 Regression Diagnostics: Identifying Influential Data and Sources of Collinearity with David Belsey, Edwin Kuh & Roy Welsch
1 × $6.00
Regression Diagnostics: Identifying Influential Data and Sources of Collinearity with David Belsey, Edwin Kuh & Roy Welsch
1 × $6.00 -
×
 The Hedge Fund Edge. Maximum Profit, Minimum Risk. Global Trading Trend Strategies - Mark Boucher
1 × $6.00
The Hedge Fund Edge. Maximum Profit, Minimum Risk. Global Trading Trend Strategies - Mark Boucher
1 × $6.00 -
×
 One Shot One Kill Trading with John Netto
1 × $6.00
One Shot One Kill Trading with John Netto
1 × $6.00 -
×
 HYDRA 3 Day Bootcamp
1 × $5.00
HYDRA 3 Day Bootcamp
1 × $5.00 -
×
 Random Walk Trading - J.L.Lord - One Strategy for All Markets
1 × $6.00
Random Walk Trading - J.L.Lord - One Strategy for All Markets
1 × $6.00 -
×
 Learn to Trade Course with Mike Aston
1 × $6.00
Learn to Trade Course with Mike Aston
1 × $6.00 -
×
 Price Ladder Training
1 × $15.00
Price Ladder Training
1 × $15.00 -
×
 Short and Simple Guide to Smart Investing with Alan Lavine
1 × $6.00
Short and Simple Guide to Smart Investing with Alan Lavine
1 × $6.00 -
×
 High Probability Trading Using Elliott Wave And Fibonacci Analysis withVic Patel - Forex Training Group
1 × $10.00
High Probability Trading Using Elliott Wave And Fibonacci Analysis withVic Patel - Forex Training Group
1 × $10.00 -
×
 Dan Dowd Trading
1 × $5.00
Dan Dowd Trading
1 × $5.00 -
×
 Our 3 Bread and Butter Trades In This Low IV Market Advanced Class with Day Trading Zones
1 × $39.00
Our 3 Bread and Butter Trades In This Low IV Market Advanced Class with Day Trading Zones
1 × $39.00 -
×
 Momentum Explained
1 × $6.00
Momentum Explained
1 × $6.00 -
×
 Dan Sheridan 2011 Calendar Workshop
1 × $6.00
Dan Sheridan 2011 Calendar Workshop
1 × $6.00 -
×
 MTI - Basics UTP
1 × $6.00
MTI - Basics UTP
1 × $6.00 -
×
 Spread Trading
1 × $6.00
Spread Trading
1 × $6.00 -
×
 KASH-FX JOURNAL
1 × $10.00
KASH-FX JOURNAL
1 × $10.00 -
×
 The Best (Public) Trading Methods I’ve Found for Futures & Equities with Perry J.Kaufman
1 × $6.00
The Best (Public) Trading Methods I’ve Found for Futures & Equities with Perry J.Kaufman
1 × $6.00 -
×
 Dynamic Support and Resistance Indicator for MT4
1 × $23.00
Dynamic Support and Resistance Indicator for MT4
1 × $23.00 -
×
 Introduction to Stocks & Forex
1 × $15.00
Introduction to Stocks & Forex
1 × $15.00 -
×
 ICT Mentorship 2016-17 with Inner Circle Trading
1 × $6.00
ICT Mentorship 2016-17 with Inner Circle Trading
1 × $6.00 -
×
 Fantastic 4 Trading Strategies
1 × $15.00
Fantastic 4 Trading Strategies
1 × $15.00 -
×
 How to Make a Living Trading Foreign Exchange: A Guaranteed Income for Life with Courtney Smith
1 × $6.00
How to Make a Living Trading Foreign Exchange: A Guaranteed Income for Life with Courtney Smith
1 × $6.00 -
×
 Forex Trading Make Your First Trader Today with Corey Halliday
1 × $6.00
Forex Trading Make Your First Trader Today with Corey Halliday
1 × $6.00 -
×
 MACD Divergence Fully Automatic Indicator for ThinkOrSwim TOS
1 × $6.00
MACD Divergence Fully Automatic Indicator for ThinkOrSwim TOS
1 × $6.00 -
×
 Maximum Returns with Infinity Spreads Class with Don Kaufman
1 × $6.00
Maximum Returns with Infinity Spreads Class with Don Kaufman
1 × $6.00 -
×
 Metals Webinar
1 × $6.00
Metals Webinar
1 × $6.00 -
×
 Romeo’s University of Turtle Soup with Romeo
1 × $6.00
Romeo’s University of Turtle Soup with Romeo
1 × $6.00 -
×
 Profit Wave Trade Strategy with Base Camp Trading
1 × $4.00
Profit Wave Trade Strategy with Base Camp Trading
1 × $4.00 -
×
 IBD Advanced Buying Strategies Home Study Program
1 × $10.00
IBD Advanced Buying Strategies Home Study Program
1 × $10.00 -
×
 Market Evolution
1 × $6.00
Market Evolution
1 × $6.00 -
×
 Monetary Mechanics Course 2024 with The Macro Compass
1 × $139.00
Monetary Mechanics Course 2024 with The Macro Compass
1 × $139.00 -
×
 Money Miracle: Use Other Peoples Money to Make You Rich with George Angell
1 × $6.00
Money Miracle: Use Other Peoples Money to Make You Rich with George Angell
1 × $6.00 -
×
 Dynamic Trading Indicators with Mark W.Helweg, David C.Stendahl
1 × $6.00
Dynamic Trading Indicators with Mark W.Helweg, David C.Stendahl
1 × $6.00 -
×
 Security Analysis Sixth Edition, Foreword by Warren Buffett with Benjamin Graham, David Dodd
1 × $6.00
Security Analysis Sixth Edition, Foreword by Warren Buffett with Benjamin Graham, David Dodd
1 × $6.00 -
×
 Foundation of Successful Trading - 2 DVDs and Bonus Gann Time Factor 2 DVDs
1 × $31.00
Foundation of Successful Trading - 2 DVDs and Bonus Gann Time Factor 2 DVDs
1 × $31.00 -
×
 Trading Natural Resources in a Volatile Market with Kevin Kerr
1 × $6.00
Trading Natural Resources in a Volatile Market with Kevin Kerr
1 × $6.00 -
×
 Millionaire Traders with Kathy Lien & Boris Schlossberg
1 × $6.00
Millionaire Traders with Kathy Lien & Boris Schlossberg
1 × $6.00 -
×
 Cycles: What they are, what they mean, how to profit by them - Dick Stoken
1 × $6.00
Cycles: What they are, what they mean, how to profit by them - Dick Stoken
1 × $6.00 -
×
 ND10X - 10X Your Money In 10 Days with Nicola Delic
1 × $23.00
ND10X - 10X Your Money In 10 Days with Nicola Delic
1 × $23.00 -
×
 Marus FX 2023
1 × $5.00
Marus FX 2023
1 × $5.00 -
×
 Scalping Strategy Webinar! recorded. BEST WEBINAR
1 × $23.00
Scalping Strategy Webinar! recorded. BEST WEBINAR
1 × $23.00 -
×
 Get to know the VIX Index (aka The Fear Index)
1 × $15.00
Get to know the VIX Index (aka The Fear Index)
1 × $15.00 -
×
 Long/Short Market Dynamics: Trading Strategies for Today's Markets with Clive Corcoran
1 × $6.00
Long/Short Market Dynamics: Trading Strategies for Today's Markets with Clive Corcoran
1 × $6.00 -
×
 The Indices Orderflow Masterclass with The Forex Scalpers
1 × $23.00
The Indices Orderflow Masterclass with The Forex Scalpers
1 × $23.00 -
×
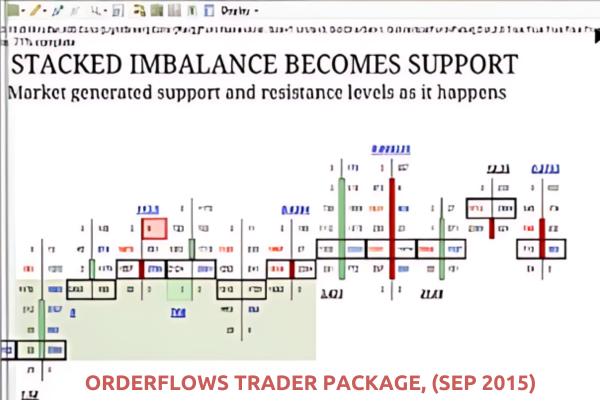 OrderFlows Trader Package, (Sep 2015)
1 × $54.00
OrderFlows Trader Package, (Sep 2015)
1 × $54.00 -
×
 New Generation Market Profile (May 2014)
1 × $15.00
New Generation Market Profile (May 2014)
1 × $15.00 -
×
 Guide to Winning with Automated Trading Systems with Jack Schwager
1 × $6.00
Guide to Winning with Automated Trading Systems with Jack Schwager
1 × $6.00 -
×
 Symmetry Wave Theory with Michael Gur
1 × $6.00
Symmetry Wave Theory with Michael Gur
1 × $6.00 -
×
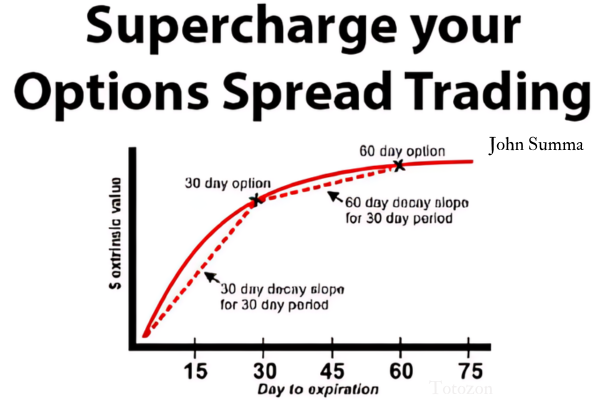 Supercharge your Options Spread Trading with John Summa
1 × $6.00
Supercharge your Options Spread Trading with John Summa
1 × $6.00 -
×
 The Orderflow Masterclass with PrimeTrading
1 × $17.00
The Orderflow Masterclass with PrimeTrading
1 × $17.00 -
×
 Programming in Python For Traders with Trading Markets
1 × $15.00
Programming in Python For Traders with Trading Markets
1 × $15.00 -
×
 Out of the Pits with Caitlin Zaloom
1 × $6.00
Out of the Pits with Caitlin Zaloom
1 × $6.00 -
×
 Forex Day Trading Course with Raul Gonzalez
1 × $5.00
Forex Day Trading Course with Raul Gonzalez
1 × $5.00 -
×
 Investment Psychology. Explained Classic Strategies to Beat the Markets with Martin Pring
1 × $6.00
Investment Psychology. Explained Classic Strategies to Beat the Markets with Martin Pring
1 × $6.00 -
×
 ICT Charter 2020 with Inner Circle Trader
1 × $13.00
ICT Charter 2020 with Inner Circle Trader
1 × $13.00 -
×
 Sacredscience - W.F.Whitehead – Occultism Simplified
1 × $6.00
Sacredscience - W.F.Whitehead – Occultism Simplified
1 × $6.00 -
×
 Newsbeat Master Class Recording
1 × $39.00
Newsbeat Master Class Recording
1 × $39.00 -
×
 News Profiteer System Manual & Members Area Videos with Henry Liu
1 × $6.00
News Profiteer System Manual & Members Area Videos with Henry Liu
1 × $6.00 -
×
 Full Members Area (Icludes 2006 Seminar & Webinars) with Tom Yeomans
1 × $6.00
Full Members Area (Icludes 2006 Seminar & Webinars) with Tom Yeomans
1 × $6.00 -
×
 How to Pick Hot Reverse Merger Penny Stocks with John Lux
1 × $5.00
How to Pick Hot Reverse Merger Penny Stocks with John Lux
1 × $5.00 -
×
 Investment Intelligence from Insider Trading with H.N.Seyhun
1 × $6.00
Investment Intelligence from Insider Trading with H.N.Seyhun
1 × $6.00 -
×
 PROFESSIONAL TRADING EDUCATION with The MarketDelta Edge
1 × $78.00
PROFESSIONAL TRADING EDUCATION with The MarketDelta Edge
1 × $78.00 -
×
 Pairs Trading: Quantitative Methods and Analysis with Ganapathy Vidyamurthy
1 × $6.00
Pairs Trading: Quantitative Methods and Analysis with Ganapathy Vidyamurthy
1 × $6.00 -
×
 Forex Trading using Intermarket Analysis with Louis Mendelsohn
1 × $6.00
Forex Trading using Intermarket Analysis with Louis Mendelsohn
1 × $6.00 -
×
 Read The Market RTM Master Trader Course + Journals
1 × $5.00
Read The Market RTM Master Trader Course + Journals
1 × $5.00 -
×
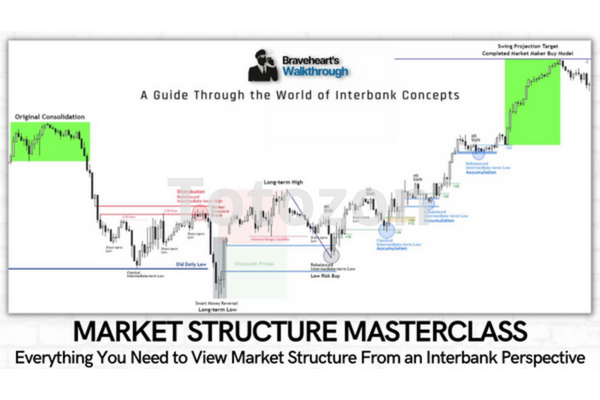 Market Structure Masterclass with Braveheart Trading
1 × $5.00
Market Structure Masterclass with Braveheart Trading
1 × $5.00 -
×
 Mindful Trading e-Workbook with Traders State Of Mind
1 × $6.00
Mindful Trading e-Workbook with Traders State Of Mind
1 × $6.00 -
×
 My Favorite Trades – Trading Mastery
1 × $6.00
My Favorite Trades – Trading Mastery
1 × $6.00 -
×
 Mission Million Money Management Course
1 × $31.00
Mission Million Money Management Course
1 × $31.00 -
×
 Investing in stocks: Avoid stock market loss
1 × $15.00
Investing in stocks: Avoid stock market loss
1 × $15.00 -
×
 Teresa Lo's PowerTools for eSignal (Dec. 2006) (powerswings.com)
1 × $6.00
Teresa Lo's PowerTools for eSignal (Dec. 2006) (powerswings.com)
1 × $6.00 -
×
 Risk Free Projections Course
1 × $85.00
Risk Free Projections Course
1 × $85.00 -
×
 ICT Charter Complete Course (2019)
1 × $13.00
ICT Charter Complete Course (2019)
1 × $13.00 -
×
 Overnight Trading with Nightly Patterns
1 × $5.00
Overnight Trading with Nightly Patterns
1 × $5.00 -
×
 Forex Mentor - FX Winning Strategies
1 × $15.00
Forex Mentor - FX Winning Strategies
1 × $15.00 -
×
 Trading the Post with Ron Friedman
1 × $5.00
Trading the Post with Ron Friedman
1 × $5.00 -
×
 The Prop Trading Code with Brannigan Barrett - Axia Futures
1 × $23.00
The Prop Trading Code with Brannigan Barrett - Axia Futures
1 × $23.00 -
×
 Market Risk Analysis, Volume IV, Value at Risk Models with Carol Alexander
1 × $6.00
Market Risk Analysis, Volume IV, Value at Risk Models with Carol Alexander
1 × $6.00 -
×
 GLOBAL MACRO PRO TRADING COURSE
1 × $31.00
GLOBAL MACRO PRO TRADING COURSE
1 × $31.00 -
×
 How to Make 1 Million Per Year Like Larry Williams with Larry Williams
1 × $6.00
How to Make 1 Million Per Year Like Larry Williams with Larry Williams
1 × $6.00 -
×
 The Best Option Trading Course with David Jaffee - Best Stock Strategy
1 × $15.00
The Best Option Trading Course with David Jaffee - Best Stock Strategy
1 × $15.00

The Active Investor Blueprint with Steve Nison – Candle Charts
Original price was: $249.00.$23.00Current price is: $23.00.
File Size: 294.2 MB
Delivery Time: 1–12 hours
Media Type: Online Course
Content Proof: Watch Here!
You may check content proof of “The Active Investor Blueprint with Steve Nison – Candle Charts” below:
The Active Investor Blueprint with Steve Nison – Candle Charts
Are you looking to elevate your trading skills and enhance your investment strategies? “The Active Investor Blueprint” with Steve Nison, focusing on candle charts, offers a comprehensive guide to mastering the art of trading. This article will delve into the key components of this blueprint, providing you with insights to maximize your trading performance.
Introduction to Candle Charts
What Are Candle Charts?
Candle charts, also known as candlestick charts, are a type of financial chart used to represent price movements of an asset. Each candlestick typically shows one day, displaying the opening, closing, high, and low prices.
Why Use Candle Charts?
- Visual Clarity: They offer a clear visual representation of price movements.
- Trend Identification: Help in identifying trends and potential reversals.
- Versatility: Useful for all trading timeframes.
Steve Nison and Candle Charts
Who is Steve Nison?
Steve Nison is widely recognized as the pioneer who introduced Japanese candlestick charting to the Western world. His expertise has made him a respected figure in technical analysis.
The Importance of Nison’s Work
- Educational Impact: Nison’s books and courses have educated thousands of traders.
- Innovative Techniques: He developed unique strategies combining candlesticks with other forms of analysis.
The Active Investor Blueprint
Comprehensive Learning
The Active Investor Blueprint offers a step-by-step guide to using candle charts effectively, blending theory with practical applications.
Expert Guidance
Steve Nison provides insights and techniques that are grounded in years of experience and research, making complex concepts accessible.
Key Components of Candle Charts
Candlestick Anatomy
- Body: Represents the opening and closing prices.
- Wicks (Shadows): Show the highest and lowest prices during the period.
- Color: Indicates price direction (typically green for up, red for down).
Basic Candlestick Patterns
Doji
- Description: The opening and closing prices are almost identical.
- Significance: Indicates market indecision and potential reversal.
Hammer and Hanging Man
- Description: Small body with a long lower wick.
- Significance: Hammer signals a bullish reversal, Hanging Man signals a bearish reversal.
Engulfing Patterns
- Description: A larger body engulfs the previous candle’s body.
- Significance: Bullish Engulfing indicates upward momentum, Bearish Engulfing indicates downward momentum.
Complex Candlestick Patterns
Morning Star and Evening Star
- Description: Three-candle patterns indicating potential reversal.
- Significance: Morning Star signals bullish reversal, Evening Star signals bearish reversal.
Three Black Crows and Three White Soldiers
- Description: Three consecutive long candles in the same direction.
- Significance: Three Black Crows indicate strong bearish trend, Three White Soldiers indicate strong bullish trend.
Applying Candle Charts to Trading
Trend Analysis
- Identifying Trends: Use candlestick patterns to confirm the direction of the trend.
- Reversal Signals: Look for patterns indicating potential reversals to time entry and exit points.
Support and Resistance
- Defining Levels: Identify support and resistance levels using candlestick patterns.
- Trading the Levels: Use these levels to set stop-loss and take-profit orders.
Combining with Other Indicators
- Moving Averages: Confirm trends and reversals.
- Relative Strength Index (RSI): Identify overbought or oversold conditions.
- Bollinger Bands: Gauge market volatility and potential breakouts.
Developing a Trading Plan with Candle Charts
Setting Objectives
- Short-Term vs Long-Term: Define your trading goals based on your timeframe.
- Risk Management: Establish your risk tolerance and manage it through proper position sizing.
Strategy Formulation
- Entry and Exit Criteria: Define specific criteria based on candlestick patterns.
- Backtesting: Test your strategy on historical data to ensure its effectiveness.
Monitoring and Adjustment
- Regular Review: Continuously monitor your trades and adjust your strategy as needed.
- Learning from Mistakes: Analyze losses to understand what went wrong and improve your approach.
Benefits of Using Candle Charts
Improved Decision Making
Candlestick patterns provide clear signals that help traders make informed decisions.
Enhanced Market Understanding
Understanding candlestick patterns improves your overall grasp of market psychology and dynamics.
Versatility Across Markets
Candle charts can be applied to various markets, including stocks, forex, and commodities, making them a versatile tool for any trader.
Conclusion
“The Active Investor Blueprint” with Steve Nison – Candle Charts offers traders a powerful tool to enhance their trading strategies. By understanding and applying candlestick patterns, you can improve your market analysis, make more informed decisions, and achieve greater success in your trading endeavors. Start leveraging the insights from Steve Nison’s blueprint today to elevate your trading game.
Commonly Asked Questions:
- Business Model Innovation: Accept the truth of a legitimate business! Our strategy is organising a group buy in which participants share the costs. We use these cash to acquire popular courses from sale pages and make them available to people with limited financial resources. Despite the authors’ worries, our clients love the cost and accessibility we give.
- The Legal Environment: Yes or No The legality of our activity is ambiguous. While we don’t have specific permission from the course authors to resell the material, there is a technicality at work. The author did not specify any limits on resale when purchasing the course. This legal intricacy is both an opportunity for us and a boon for individuals looking for low-cost access.
- Quality Control: Uncovering the Truth
Getting to the heart of the issue – quality. Purchasing the course straight from the sale page guarantees that all documents and resources are the same as those obtained through traditional channels.
However, we distinguish ourselves by going beyond personal research and resale. It is crucial to note that we are not the official course providers, which means that the following premium services are not included in our package:
- There are no scheduled coaching calls or sessions with the author.
- Access to the author’s private Facebook group or web portal is not permitted.
- No access to the author’s private membership forum.
- There is no direct email support available from the author or their team.
We operate independently, with the goal of bridging the pricing gap without the extra services provided by official course channels. Your comprehension of our distinct approach is much appreciated.
Be the first to review “The Active Investor Blueprint with Steve Nison – Candle Charts”
You must be logged in to post a review.
Related products

Forex Trading
Original price was: $850.00.$23.00Current price is: $23.00.

Forex Trading
Original price was: $697.00.$5.00Current price is: $5.00.

Original price was: $1,800.00.$54.00Current price is: $54.00.

Forex Trading
Original price was: $500.00.$5.00Current price is: $5.00.

Original price was: $2,120.00.$15.00Current price is: $15.00.

Original price was: $695.00.$41.00Current price is: $41.00.

Original price was: $4,995.00.$15.00Current price is: $15.00.

Forex Trading
Original price was: $1,098.00.$39.00Current price is: $39.00.

Original price was: $197.00.$5.00Current price is: $5.00.

Original price was: $997.00.$13.00Current price is: $13.00.

Forex Trading
Original price was: $799.00.$15.00Current price is: $15.00.

Forex Trading
Original price was: $499.00.$15.00Current price is: $15.00.

Forex Trading
Original price was: $239.00.$8.00Current price is: $8.00.
Forex Trading
Original price was: $125.00.$17.00Current price is: $17.00.

Original price was: $700.00.$39.00Current price is: $39.00.

Original price was: $299.00.$8.00Current price is: $8.00.
Forex Trading
Original price was: $1,898.00.$10.00Current price is: $10.00.

Forex Trading
Original price was: $999.00.$15.00Current price is: $15.00.

Forex Trading
Original price was: $397.00.$31.00Current price is: $31.00.

Original price was: $139.00.$23.00Current price is: $23.00.

Reviews
There are no reviews yet.