-
×
 Handbook on the Knowledge Economy with David Rooney
1 × $6.00
Handbook on the Knowledge Economy with David Rooney
1 × $6.00 -
×
 Qualitative - Financial Statement Analysis with Sandesh Banger
1 × $5.00
Qualitative - Financial Statement Analysis with Sandesh Banger
1 × $5.00 -
×
 Futures Trading Secrets Home Study with Bill McCready
1 × $6.00
Futures Trading Secrets Home Study with Bill McCready
1 × $6.00 -
×
 The Traders Mindset Course (the-traders-mindset.com) with Chris Mathews
1 × $6.00
The Traders Mindset Course (the-traders-mindset.com) with Chris Mathews
1 × $6.00 -
×
 The London Close Trade Strategy with Shirley Hudson & Vic Noble
1 × $4.00
The London Close Trade Strategy with Shirley Hudson & Vic Noble
1 × $4.00 -
×
 Latent Curve Models with Kenneth Bollen
1 × $6.00
Latent Curve Models with Kenneth Bollen
1 × $6.00 -
×
 New Blueprints for Gains in Stocks and Grains & One-Way Formula for Trading in Stocks and Commodities (Traders' Masterclass) - William Dunnigan
1 × $6.00
New Blueprints for Gains in Stocks and Grains & One-Way Formula for Trading in Stocks and Commodities (Traders' Masterclass) - William Dunnigan
1 × $6.00 -
×
 The Indices Orderflow Masterclass with The Forex Scalpers
1 × $23.00
The Indices Orderflow Masterclass with The Forex Scalpers
1 × $23.00 -
×
 Forex Trading Education Program (Apr-June 2010) with Jimmy Young
1 × $6.00
Forex Trading Education Program (Apr-June 2010) with Jimmy Young
1 × $6.00 -
×
 A Seminar On Ocean Theory Home Study Trading Course with Pat Raffalovich
1 × $6.00
A Seminar On Ocean Theory Home Study Trading Course with Pat Raffalovich
1 × $6.00 -
×
 Master Trader - Advander Management Strategies
1 × $39.00
Master Trader - Advander Management Strategies
1 × $39.00 -
×
 Market Energy Trader with Top Trade Tools
1 × $5.00
Market Energy Trader with Top Trade Tools
1 × $5.00 -
×
 Forex Trading Course with Zack Kolundzic
1 × $6.00
Forex Trading Course with Zack Kolundzic
1 × $6.00 -
×
 Kicker Signals with Stephen W.Bigalow
1 × $6.00
Kicker Signals with Stephen W.Bigalow
1 × $6.00 -
×
 Original Curriculum with Home Options Trading Course
1 × $6.00
Original Curriculum with Home Options Trading Course
1 × $6.00 -
×
 HandBook of Parametric and Nonparametric Statistical Procedures with David J.Sheskin
1 × $6.00
HandBook of Parametric and Nonparametric Statistical Procedures with David J.Sheskin
1 × $6.00 -
×
 $20 – 52k 20 pips a day challange with Rafał Zuchowicz - TopMasterTrader
1 × $5.00
$20 – 52k 20 pips a day challange with Rafał Zuchowicz - TopMasterTrader
1 × $5.00 -
×
 The Orderflow Masterclass with PrimeTrading
1 × $17.00
The Orderflow Masterclass with PrimeTrading
1 × $17.00 -
×
 Divorcing the Dow: Using Revolutionary Market Indicators to Profit from the Stealth Boom Ahead - Jim Troup & Sharon Michalsky
1 × $6.00
Divorcing the Dow: Using Revolutionary Market Indicators to Profit from the Stealth Boom Ahead - Jim Troup & Sharon Michalsky
1 × $6.00 -
×
 Best of the Best: Collars with Amy Meissner & Scott Ruble
1 × $15.00
Best of the Best: Collars with Amy Meissner & Scott Ruble
1 × $15.00 -
×
 Options Bootcamp with Sid Woolfolk
1 × $6.00
Options Bootcamp with Sid Woolfolk
1 × $6.00 -
×
 Trading Options Effectively with Paul Forchione
1 × $4.00
Trading Options Effectively with Paul Forchione
1 × $4.00 -
×
 Compass Trading System with Right Line Trading
1 × $39.00
Compass Trading System with Right Line Trading
1 × $39.00 -
×
 Four Dimensional Stock Market Structures & Cycles with Bradley Cowan
1 × $6.00
Four Dimensional Stock Market Structures & Cycles with Bradley Cowan
1 × $6.00 -
×
 Defending Options with Simpler Options
1 × $6.00
Defending Options with Simpler Options
1 × $6.00 -
×
 Forex Education Trading System (Video 469 MB)
1 × $23.00
Forex Education Trading System (Video 469 MB)
1 × $23.00 -
×
 X-Factor Day-Trading
1 × $5.00
X-Factor Day-Trading
1 × $5.00 -
×
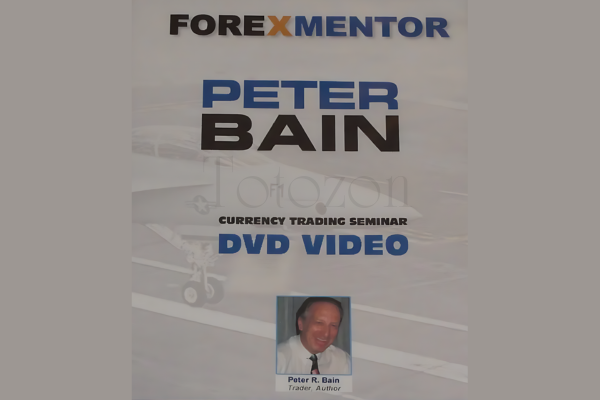 Currency Trading Seminar with Peter Bain
1 × $6.00
Currency Trading Seminar with Peter Bain
1 × $6.00 -
×
 Predators & Profits with Martin Howell & John Bogle
1 × $6.00
Predators & Profits with Martin Howell & John Bogle
1 × $6.00 -
×
 Alexander Elder Full Courses Package
1 × $6.00
Alexander Elder Full Courses Package
1 × $6.00 -
×
 Candlestick and Pivot Point Trading Triggers with John Person
1 × $6.00
Candlestick and Pivot Point Trading Triggers with John Person
1 × $6.00 -
×
 The Naked Eye: Raw Data Analytics with Edgar Torres - Raw Data Analytics
1 × $8.00
The Naked Eye: Raw Data Analytics with Edgar Torres - Raw Data Analytics
1 × $8.00 -
×
 Options Trading. The Hidden Reality Course with Charles Cottle
1 × $6.00
Options Trading. The Hidden Reality Course with Charles Cottle
1 × $6.00 -
×
 A Treasure House of Bayer. 32 Articles and Forecasts with George Bayer
1 × $6.00
A Treasure House of Bayer. 32 Articles and Forecasts with George Bayer
1 × $6.00 -
×
 A Mathematician Plays The Stock Market with John Allen Paulos
1 × $6.00
A Mathematician Plays The Stock Market with John Allen Paulos
1 × $6.00 -
×
 NASDAQ Level II Trading Strategies
1 × $6.00
NASDAQ Level II Trading Strategies
1 × $6.00 -
×
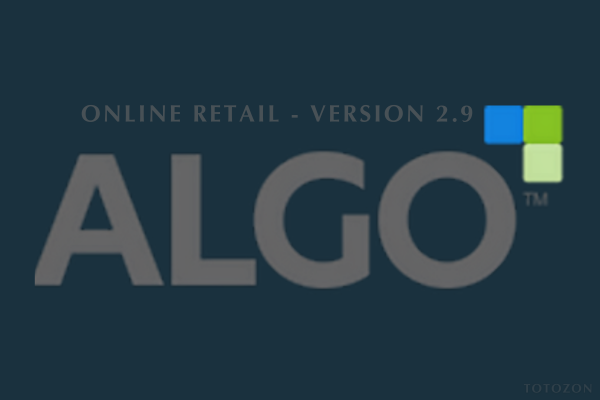 ALGO™ Online Retail - Version 2.9
1 × $155.00
ALGO™ Online Retail - Version 2.9
1 × $155.00 -
×
 Master Commodities Course
1 × $6.00
Master Commodities Course
1 × $6.00 -
×
 Volume Profile 2023 (Order Flow Pack) with Trader Dale
1 × $5.00
Volume Profile 2023 (Order Flow Pack) with Trader Dale
1 × $5.00 -
×
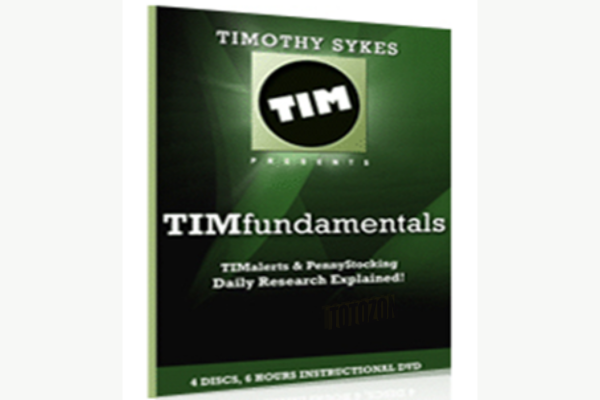 TIMfundamentals with Timothy Sykes
1 × $5.00
TIMfundamentals with Timothy Sykes
1 × $5.00 -
×
 WondaFX Signature Strategy with WondaFX
1 × $5.00
WondaFX Signature Strategy with WondaFX
1 × $5.00 -
×
 How to Make the Stock Market Make Money For You with Ted Warren
1 × $6.00
How to Make the Stock Market Make Money For You with Ted Warren
1 × $6.00 -
×
 Dynamic Time and Price Analysis of Market Trends with Bruce Gilmore
1 × $6.00
Dynamic Time and Price Analysis of Market Trends with Bruce Gilmore
1 × $6.00 -
×
 The Aggressive Investor. Case Studies with Colin Nicholson
1 × $6.00
The Aggressive Investor. Case Studies with Colin Nicholson
1 × $6.00 -
×
 Essentials in Quantitative Trading QT01 By HangukQuant's
1 × $23.00
Essentials in Quantitative Trading QT01 By HangukQuant's
1 × $23.00 -
×
 Quantamentals - The Next Great Forefront Of Trading and Investing with Trading Markets
1 × $8.00
Quantamentals - The Next Great Forefront Of Trading and Investing with Trading Markets
1 × $8.00 -
×
 The Prop Trading Code with Brannigan Barrett - Axia Futures
1 × $23.00
The Prop Trading Code with Brannigan Barrett - Axia Futures
1 × $23.00 -
×
 TradeCraft: Your Path to Peak Performance Trading By Adam Grimes
1 × $15.00
TradeCraft: Your Path to Peak Performance Trading By Adam Grimes
1 × $15.00

The Active Investor Blueprint with Steve Nison – Candle Charts
Original price was: $249.00.$23.00Current price is: $23.00.
File Size: 294.2 MB
Delivery Time: 1–12 hours
Media Type: Online Course
Content Proof: Watch Here!
You may check content proof of “The Active Investor Blueprint with Steve Nison – Candle Charts” below:
The Active Investor Blueprint with Steve Nison – Candle Charts
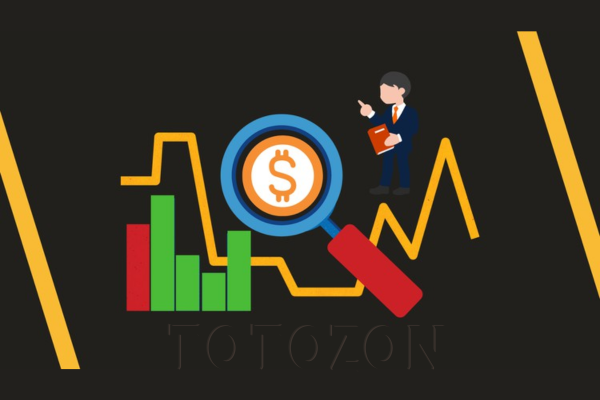
Are you looking to elevate your trading skills and enhance your investment strategies? “The Active Investor Blueprint” with Steve Nison, focusing on candle charts, offers a comprehensive guide to mastering the art of trading. This article will delve into the key components of this blueprint, providing you with insights to maximize your trading performance.
Introduction to Candle Charts
What Are Candle Charts?
Candle charts, also known as candlestick charts, are a type of financial chart used to represent price movements of an asset. Each candlestick typically shows one day, displaying the opening, closing, high, and low prices.
Why Use Candle Charts?
- Visual Clarity: They offer a clear visual representation of price movements.
- Trend Identification: Help in identifying trends and potential reversals.
- Versatility: Useful for all trading timeframes.
Steve Nison and Candle Charts
Who is Steve Nison?
Steve Nison is widely recognized as the pioneer who introduced Japanese candlestick charting to the Western world. His expertise has made him a respected figure in technical analysis.
The Importance of Nison’s Work
- Educational Impact: Nison’s books and courses have educated thousands of traders.
- Innovative Techniques: He developed unique strategies combining candlesticks with other forms of analysis.
The Active Investor Blueprint
Comprehensive Learning
The Active Investor Blueprint offers a step-by-step guide to using candle charts effectively, blending theory with practical applications.
Expert Guidance
Steve Nison provides insights and techniques that are grounded in years of experience and research, making complex concepts accessible.
Key Components of Candle Charts
Candlestick Anatomy
- Body: Represents the opening and closing prices.
- Wicks (Shadows): Show the highest and lowest prices during the period.
- Color: Indicates price direction (typically green for up, red for down).
Basic Candlestick Patterns
Doji
- Description: The opening and closing prices are almost identical.
- Significance: Indicates market indecision and potential reversal.
Hammer and Hanging Man
- Description: Small body with a long lower wick.
- Significance: Hammer signals a bullish reversal, Hanging Man signals a bearish reversal.
Engulfing Patterns
- Description: A larger body engulfs the previous candle’s body.
- Significance: Bullish Engulfing indicates upward momentum, Bearish Engulfing indicates downward momentum.
Complex Candlestick Patterns
Morning Star and Evening Star
- Description: Three-candle patterns indicating potential reversal.
- Significance: Morning Star signals bullish reversal, Evening Star signals bearish reversal.
Three Black Crows and Three White Soldiers
- Description: Three consecutive long candles in the same direction.
- Significance: Three Black Crows indicate strong bearish trend, Three White Soldiers indicate strong bullish trend.
Applying Candle Charts to Trading
Trend Analysis
- Identifying Trends: Use candlestick patterns to confirm the direction of the trend.
- Reversal Signals: Look for patterns indicating potential reversals to time entry and exit points.
Support and Resistance
- Defining Levels: Identify support and resistance levels using candlestick patterns.
- Trading the Levels: Use these levels to set stop-loss and take-profit orders.
Combining with Other Indicators
- Moving Averages: Confirm trends and reversals.
- Relative Strength Index (RSI): Identify overbought or oversold conditions.
- Bollinger Bands: Gauge market volatility and potential breakouts.
Developing a Trading Plan with Candle Charts
Setting Objectives
- Short-Term vs Long-Term: Define your trading goals based on your timeframe.
- Risk Management: Establish your risk tolerance and manage it through proper position sizing.
Strategy Formulation
- Entry and Exit Criteria: Define specific criteria based on candlestick patterns.
- Backtesting: Test your strategy on historical data to ensure its effectiveness.
Monitoring and Adjustment
- Regular Review: Continuously monitor your trades and adjust your strategy as needed.
- Learning from Mistakes: Analyze losses to understand what went wrong and improve your approach.
Benefits of Using Candle Charts
Improved Decision Making
Candlestick patterns provide clear signals that help traders make informed decisions.
Enhanced Market Understanding
Understanding candlestick patterns improves your overall grasp of market psychology and dynamics.
Versatility Across Markets
Candle charts can be applied to various markets, including stocks, forex, and commodities, making them a versatile tool for any trader.
Conclusion
“The Active Investor Blueprint” with Steve Nison – Candle Charts offers traders a powerful tool to enhance their trading strategies. By understanding and applying candlestick patterns, you can improve your market analysis, make more informed decisions, and achieve greater success in your trading endeavors. Start leveraging the insights from Steve Nison’s blueprint today to elevate your trading game.
Commonly Asked Questions:
- Business Model Innovation: Accept the truth of a legitimate business! Our strategy is organising a group buy in which participants share the costs. We use these cash to acquire popular courses from sale pages and make them available to people with limited financial resources. Despite the authors’ worries, our clients love the cost and accessibility we give.
- The Legal Environment: Yes or No The legality of our activity is ambiguous. While we don’t have specific permission from the course authors to resell the material, there is a technicality at work. The author did not specify any limits on resale when purchasing the course. This legal intricacy is both an opportunity for us and a boon for individuals looking for low-cost access.
- Quality Control: Uncovering the Truth
Getting to the heart of the issue – quality. Purchasing the course straight from the sale page guarantees that all documents and resources are the same as those obtained through traditional channels.
However, we distinguish ourselves by going beyond personal research and resale. It is crucial to note that we are not the official course providers, which means that the following premium services are not included in our package:
- There are no scheduled coaching calls or sessions with the author.
- Access to the author’s private Facebook group or web portal is not permitted.
- No access to the author’s private membership forum.
- There is no direct email support available from the author or their team.
We operate independently, with the goal of bridging the pricing gap without the extra services provided by official course channels. Your comprehension of our distinct approach is much appreciated.
Be the first to review “The Active Investor Blueprint with Steve Nison – Candle Charts”
You must be logged in to post a review.
Related products
Original price was: $1,200.00.$23.00Current price is: $23.00.

Forex Trading
The Complete Guide to Multiple Time Frame Analysis & Reading Price Action with Aiman Almansoori
Original price was: $1,399.00.$13.00Current price is: $13.00.

Forex Trading
Original price was: $799.00.$15.00Current price is: $15.00.

Forex Trading
Original price was: $797.00.$10.00Current price is: $10.00.

Original price was: $649.00.$20.00Current price is: $20.00.

Original price was: $1,849.00.$15.00Current price is: $15.00.

Forex Trading
Original price was: $397.00.$31.00Current price is: $31.00.
Original price was: $4,995.00.$15.00Current price is: $15.00.

Original price was: $310.00.$23.00Current price is: $23.00.
Forex Trading
Quantamentals – The Next Great Forefront Of Trading and Investing with Trading Markets
Original price was: $1,495.00.$8.00Current price is: $8.00.

Original price was: $2,120.00.$15.00Current price is: $15.00.

Original price was: $1,800.00.$54.00Current price is: $54.00.

Forex Trading
Original price was: $4,997.00.$27.00Current price is: $27.00.

Forex Trading
Original price was: $2,997.00.$23.00Current price is: $23.00.

Original price was: $999.00.$5.00Current price is: $5.00.
Forex Trading
Original price was: $1,898.00.$10.00Current price is: $10.00.

Original price was: $299.00.$8.00Current price is: $8.00.

Forex Trading
Original price was: $2,995.00.$31.00Current price is: $31.00.

Forex Trading
Original price was: $697.00.$5.00Current price is: $5.00.

Forex Trading
Original price was: $239.00.$8.00Current price is: $8.00.

Reviews
There are no reviews yet.