-
×
 Optionetics 2007 - Home Study Course, MP3
1 × $6.00
Optionetics 2007 - Home Study Course, MP3
1 × $6.00 -
×
 TradeCraft: Your Path to Peak Performance Trading By Adam Grimes
1 × $15.00
TradeCraft: Your Path to Peak Performance Trading By Adam Grimes
1 × $15.00 -
×
 Five Trading Trends of 2005 with Dan Denning
1 × $6.00
Five Trading Trends of 2005 with Dan Denning
1 × $6.00 -
×
 Trading Aplications of Japanese Candlestick Charting with Gary S.Wagner & Bradley L.Matheny
1 × $6.00
Trading Aplications of Japanese Candlestick Charting with Gary S.Wagner & Bradley L.Matheny
1 × $6.00 -
×
 Expert Forex Systems with Andrew Fields
1 × $6.00
Expert Forex Systems with Andrew Fields
1 × $6.00 -
×
 S&P Market Timing Course For E-mini & Options Traders
1 × $6.00
S&P Market Timing Course For E-mini & Options Traders
1 × $6.00 -
×
 Core Concepts Mastery with DreamsFX
1 × $5.00
Core Concepts Mastery with DreamsFX
1 × $5.00 -
×
 Day One Trader with John Sussex
1 × $6.00
Day One Trader with John Sussex
1 × $6.00 -
×
 Finserv Corp Complete Course
1 × $4.00
Finserv Corp Complete Course
1 × $4.00 -
×
 Create Your Own Hedge Fund with Mark Wolfinger
1 × $6.00
Create Your Own Hedge Fund with Mark Wolfinger
1 × $6.00 -
×
 Order flow self-study training program with iMFtracker
1 × $10.00
Order flow self-study training program with iMFtracker
1 × $10.00 -
×
 The Orderflow Masterclass with PrimeTrading
1 × $17.00
The Orderflow Masterclass with PrimeTrading
1 × $17.00 -
×
 FMG Online Course with FMG Traders
1 × $6.00
FMG Online Course with FMG Traders
1 × $6.00 -
×
 The Beginners Guide to Commodities Investing with Brian & Gayle Rice
1 × $6.00
The Beginners Guide to Commodities Investing with Brian & Gayle Rice
1 × $6.00 -
×
 The Any Hour Trading System with Markets Mastered
1 × $6.00
The Any Hour Trading System with Markets Mastered
1 × $6.00 -
×
 Cecil Robles Advent Forex Course & Indicators with Adventforex
1 × $6.00
Cecil Robles Advent Forex Course & Indicators with Adventforex
1 × $6.00 -
×
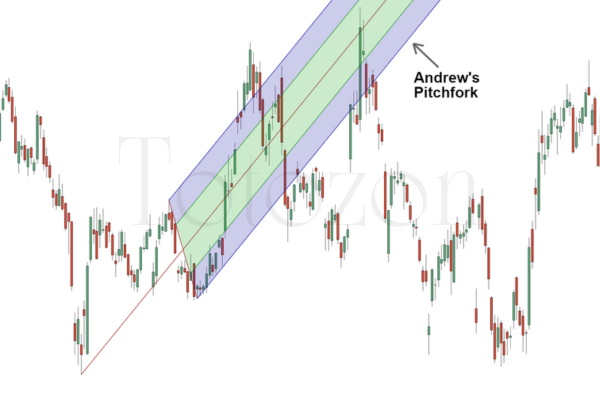 Andrews Pitchfork Basic
1 × $6.00
Andrews Pitchfork Basic
1 × $6.00 -
×
 3-Day Day Trading Seminar Online CD with John Carter & Hubert Senters
1 × $6.00
3-Day Day Trading Seminar Online CD with John Carter & Hubert Senters
1 × $6.00 -
×
 Trading Options Effectively with Paul Forchione
1 × $4.00
Trading Options Effectively with Paul Forchione
1 × $4.00 -
×
 Defending Options with Simpler Options
1 × $6.00
Defending Options with Simpler Options
1 × $6.00 -
×
 Trade the OEX with Arthur Darack
1 × $6.00
Trade the OEX with Arthur Darack
1 × $6.00 -
×
 Gap Trading for Stock and Options Traders with Damon Verial
1 × $6.00
Gap Trading for Stock and Options Traders with Damon Verial
1 × $6.00 -
×
 Futures & Options for Dummies with Joe Duarte
1 × $6.00
Futures & Options for Dummies with Joe Duarte
1 × $6.00 -
×
 KP Trading Room w/ Paladin and JadeCapFX
1 × $5.00
KP Trading Room w/ Paladin and JadeCapFX
1 × $5.00 -
×
 The Adventures of the Cycle Hunter. The Cyclist with Craig Bttlc
1 × $6.00
The Adventures of the Cycle Hunter. The Cyclist with Craig Bttlc
1 × $6.00 -
×
 Quantum Stone Capital
1 × $15.00
Quantum Stone Capital
1 × $15.00 -
×
 Fast Track Course with Tradelikerocket
1 × $233.00
Fast Track Course with Tradelikerocket
1 × $233.00 -
×
 The Complete Guide to Multiple Time Frame Analysis & Reading Price Action with Aiman Almansoori
1 × $13.00
The Complete Guide to Multiple Time Frame Analysis & Reading Price Action with Aiman Almansoori
1 × $13.00 -
×
 ICT Prodigy Trading Course – $650K in Payouts with Alex Solignani
1 × $15.00
ICT Prodigy Trading Course – $650K in Payouts with Alex Solignani
1 × $15.00 -
×
 Matrix Spread Options Trading Course with Base Camp Trading
1 × $31.00
Matrix Spread Options Trading Course with Base Camp Trading
1 × $31.00 -
×
 The New Technical Trader with Chande Kroll
1 × $6.00
The New Technical Trader with Chande Kroll
1 × $6.00 -
×
 Short-Term Trading with Precision Timing - Jack Bernstein
1 × $6.00
Short-Term Trading with Precision Timing - Jack Bernstein
1 × $6.00 -
×
 Financial Fortress with TradeSmart University
1 × $6.00
Financial Fortress with TradeSmart University
1 × $6.00 -
×
 Gillen Predicts with Jack Gillen
1 × $6.00
Gillen Predicts with Jack Gillen
1 × $6.00 -
×
 CANDLESTICKS APPLIED with Steve Nison & Syl Desaulniers - Candle Charts
1 × $15.00
CANDLESTICKS APPLIED with Steve Nison & Syl Desaulniers - Candle Charts
1 × $15.00 -
×
 How To Flip All Those “Hard To Flip” Deals
1 × $6.00
How To Flip All Those “Hard To Flip” Deals
1 × $6.00 -
×
 Preparing for the Worst: Incorporating Downside Risk in Stock Market Investments with Hrishikesh Vinod & Derrick Reagle
1 × $6.00
Preparing for the Worst: Incorporating Downside Risk in Stock Market Investments with Hrishikesh Vinod & Derrick Reagle
1 × $6.00 -
×
 Core Strategy Program + Extended Learning Track with Ota Courses
1 × $124.00
Core Strategy Program + Extended Learning Track with Ota Courses
1 × $124.00 -
×
 Futures Spreads Crash Course with Base Camp Trading
1 × $54.00
Futures Spreads Crash Course with Base Camp Trading
1 × $54.00 -
×
 High Probability Trading Using Elliott Wave And Fibonacci Analysis withVic Patel - Forex Training Group
1 × $10.00
High Probability Trading Using Elliott Wave And Fibonacci Analysis withVic Patel - Forex Training Group
1 × $10.00 -
×
 Candlestick and Pivot Point Trading Triggers with John Person
1 × $6.00
Candlestick and Pivot Point Trading Triggers with John Person
1 × $6.00 -
×
 Equities with Peter Martin
1 × $6.00
Equities with Peter Martin
1 × $6.00 -
×
 Sovereign Man Confidential
1 × $6.00
Sovereign Man Confidential
1 × $6.00 -
×
 How To Build An Automated Trading Robot In Excel with Peter Titus - Marwood Research
1 × $15.00
How To Build An Automated Trading Robot In Excel with Peter Titus - Marwood Research
1 × $15.00 -
×
 Algo Trading Masterclass with Ali Casey - StatOasis
1 × $23.00
Algo Trading Masterclass with Ali Casey - StatOasis
1 × $23.00 -
×
 Profitable Patterns for Stock Trading with Larry Pesavento
1 × $6.00
Profitable Patterns for Stock Trading with Larry Pesavento
1 × $6.00 -
×
 How to Build Fortune. Trading Stock Index Futures with Dennis Minogue
1 × $6.00
How to Build Fortune. Trading Stock Index Futures with Dennis Minogue
1 × $6.00 -
×
 TRADING NFX Course with Andrew NFX
1 × $5.00
TRADING NFX Course with Andrew NFX
1 × $5.00 -
×
 The Adventures of the Cycle Hunter. The Analyst with Craig Bttlc
1 × $6.00
The Adventures of the Cycle Hunter. The Analyst with Craig Bttlc
1 × $6.00 -
×
 Elite Gap Trading with Nick Santiago - InTheMoneyStocks
1 × $93.00
Elite Gap Trading with Nick Santiago - InTheMoneyStocks
1 × $93.00 -
×
 DAY TRADING OPTIONS For Beginners: Strategies to INVEST and WIN with Dylan Parker
1 × $5.00
DAY TRADING OPTIONS For Beginners: Strategies to INVEST and WIN with Dylan Parker
1 × $5.00 -
×
 Contrarian Investment Strategies: The Next Generation with David Dreman
1 × $4.00
Contrarian Investment Strategies: The Next Generation with David Dreman
1 × $4.00 -
×
 Secrets of Trading GBP, JPY, and CHF By Boris Schlossberg and Kathy Lien - Bkforex
1 × $6.00
Secrets of Trading GBP, JPY, and CHF By Boris Schlossberg and Kathy Lien - Bkforex
1 × $6.00 -
×
 Predicting Next Weeks’s Range with Charles Drummond
1 × $6.00
Predicting Next Weeks’s Range with Charles Drummond
1 × $6.00 -
×
 The Prop Trading Code with Brannigan Barrett - Axia Futures
1 × $23.00
The Prop Trading Code with Brannigan Barrett - Axia Futures
1 × $23.00

The Active Investor Blueprint with Steve Nison – Candle Charts
Original price was: $249.00.$23.00Current price is: $23.00.
File Size: 294.2 MB
Delivery Time: 1–12 hours
Media Type: Online Course
Content Proof: Watch Here!
You may check content proof of “The Active Investor Blueprint with Steve Nison – Candle Charts” below:
The Active Investor Blueprint with Steve Nison – Candle Charts
Are you looking to elevate your trading skills and enhance your investment strategies? “The Active Investor Blueprint” with Steve Nison, focusing on candle charts, offers a comprehensive guide to mastering the art of trading. This article will delve into the key components of this blueprint, providing you with insights to maximize your trading performance.
Introduction to Candle Charts
What Are Candle Charts?
Candle charts, also known as candlestick charts, are a type of financial chart used to represent price movements of an asset. Each candlestick typically shows one day, displaying the opening, closing, high, and low prices.
Why Use Candle Charts?
- Visual Clarity: They offer a clear visual representation of price movements.
- Trend Identification: Help in identifying trends and potential reversals.
- Versatility: Useful for all trading timeframes.
Steve Nison and Candle Charts
Who is Steve Nison?
Steve Nison is widely recognized as the pioneer who introduced Japanese candlestick charting to the Western world. His expertise has made him a respected figure in technical analysis.
The Importance of Nison’s Work
- Educational Impact: Nison’s books and courses have educated thousands of traders.
- Innovative Techniques: He developed unique strategies combining candlesticks with other forms of analysis.
The Active Investor Blueprint
Comprehensive Learning
The Active Investor Blueprint offers a step-by-step guide to using candle charts effectively, blending theory with practical applications.
Expert Guidance
Steve Nison provides insights and techniques that are grounded in years of experience and research, making complex concepts accessible.
Key Components of Candle Charts
Candlestick Anatomy
- Body: Represents the opening and closing prices.
- Wicks (Shadows): Show the highest and lowest prices during the period.
- Color: Indicates price direction (typically green for up, red for down).
Basic Candlestick Patterns
Doji
- Description: The opening and closing prices are almost identical.
- Significance: Indicates market indecision and potential reversal.
Hammer and Hanging Man
- Description: Small body with a long lower wick.
- Significance: Hammer signals a bullish reversal, Hanging Man signals a bearish reversal.
Engulfing Patterns
- Description: A larger body engulfs the previous candle’s body.
- Significance: Bullish Engulfing indicates upward momentum, Bearish Engulfing indicates downward momentum.
Complex Candlestick Patterns
Morning Star and Evening Star
- Description: Three-candle patterns indicating potential reversal.
- Significance: Morning Star signals bullish reversal, Evening Star signals bearish reversal.
Three Black Crows and Three White Soldiers
- Description: Three consecutive long candles in the same direction.
- Significance: Three Black Crows indicate strong bearish trend, Three White Soldiers indicate strong bullish trend.
Applying Candle Charts to Trading
Trend Analysis
- Identifying Trends: Use candlestick patterns to confirm the direction of the trend.
- Reversal Signals: Look for patterns indicating potential reversals to time entry and exit points.
Support and Resistance
- Defining Levels: Identify support and resistance levels using candlestick patterns.
- Trading the Levels: Use these levels to set stop-loss and take-profit orders.
Combining with Other Indicators
- Moving Averages: Confirm trends and reversals.
- Relative Strength Index (RSI): Identify overbought or oversold conditions.
- Bollinger Bands: Gauge market volatility and potential breakouts.
Developing a Trading Plan with Candle Charts
Setting Objectives
- Short-Term vs Long-Term: Define your trading goals based on your timeframe.
- Risk Management: Establish your risk tolerance and manage it through proper position sizing.
Strategy Formulation
- Entry and Exit Criteria: Define specific criteria based on candlestick patterns.
- Backtesting: Test your strategy on historical data to ensure its effectiveness.
Monitoring and Adjustment
- Regular Review: Continuously monitor your trades and adjust your strategy as needed.
- Learning from Mistakes: Analyze losses to understand what went wrong and improve your approach.
Benefits of Using Candle Charts
Improved Decision Making
Candlestick patterns provide clear signals that help traders make informed decisions.
Enhanced Market Understanding
Understanding candlestick patterns improves your overall grasp of market psychology and dynamics.
Versatility Across Markets
Candle charts can be applied to various markets, including stocks, forex, and commodities, making them a versatile tool for any trader.
Conclusion
“The Active Investor Blueprint” with Steve Nison – Candle Charts offers traders a powerful tool to enhance their trading strategies. By understanding and applying candlestick patterns, you can improve your market analysis, make more informed decisions, and achieve greater success in your trading endeavors. Start leveraging the insights from Steve Nison’s blueprint today to elevate your trading game.
Commonly Asked Questions:
- Business Model Innovation: Accept the truth of a legitimate business! Our strategy is organising a group buy in which participants share the costs. We use these cash to acquire popular courses from sale pages and make them available to people with limited financial resources. Despite the authors’ worries, our clients love the cost and accessibility we give.
- The Legal Environment: Yes or No The legality of our activity is ambiguous. While we don’t have specific permission from the course authors to resell the material, there is a technicality at work. The author did not specify any limits on resale when purchasing the course. This legal intricacy is both an opportunity for us and a boon for individuals looking for low-cost access.
- Quality Control: Uncovering the Truth
Getting to the heart of the issue – quality. Purchasing the course straight from the sale page guarantees that all documents and resources are the same as those obtained through traditional channels.
However, we distinguish ourselves by going beyond personal research and resale. It is crucial to note that we are not the official course providers, which means that the following premium services are not included in our package:
- There are no scheduled coaching calls or sessions with the author.
- Access to the author’s private Facebook group or web portal is not permitted.
- No access to the author’s private membership forum.
- There is no direct email support available from the author or their team.
We operate independently, with the goal of bridging the pricing gap without the extra services provided by official course channels. Your comprehension of our distinct approach is much appreciated.
Be the first to review “The Active Investor Blueprint with Steve Nison – Candle Charts”
You must be logged in to post a review.
Related products
Original price was: $2,120.00.$15.00Current price is: $15.00.
Forex Trading
Original price was: $125.00.$17.00Current price is: $17.00.

Original price was: $999.00.$5.00Current price is: $5.00.
Forex Trading
Original price was: $797.00.$10.00Current price is: $10.00.

Forex Trading
Original price was: $1,098.00.$39.00Current price is: $39.00.

Forex Trading
Original price was: $249.00.$15.00Current price is: $15.00.

Forex Trading
Original price was: $850.00.$23.00Current price is: $23.00.

Original price was: $450.00.$23.00Current price is: $23.00.

Original price was: $700.00.$39.00Current price is: $39.00.

Original price was: $299.00.$8.00Current price is: $8.00.

Original price was: $197.00.$5.00Current price is: $5.00.

Forex Trading
Original price was: $2,995.00.$31.00Current price is: $31.00.
Original price was: $1,200.00.$23.00Current price is: $23.00.

Original price was: $895.00.$15.00Current price is: $15.00.

Original price was: $799.00.$15.00Current price is: $15.00.
Forex Trading
The Complete Guide to Multiple Time Frame Analysis & Reading Price Action with Aiman Almansoori
Original price was: $1,399.00.$13.00Current price is: $13.00.
Original price was: $497.00.$31.00Current price is: $31.00.
Original price was: $4,995.00.$15.00Current price is: $15.00.

Original price was: $1,800.00.$54.00Current price is: $54.00.

Original price was: $1,849.00.$15.00Current price is: $15.00.

Reviews
There are no reviews yet.