-
×
 Learning How to Successfully Trade the E-mini & S&P 500 Markets
1 × $6.00
Learning How to Successfully Trade the E-mini & S&P 500 Markets
1 × $6.00 -
×
 Unlock the Millionaire Within with Dan Lok
1 × $15.00
Unlock the Millionaire Within with Dan Lok
1 × $15.00 -
×
 Consistent Intraday Strategies and Setups Class with Don Kaufman
1 × $6.00
Consistent Intraday Strategies and Setups Class with Don Kaufman
1 × $6.00 -
×
 Pro Online Trader. Trade Like a Pro (Video 1.30 GB)
1 × $6.00
Pro Online Trader. Trade Like a Pro (Video 1.30 GB)
1 × $6.00 -
×
 Bulls on Wall Street Mentorship
1 × $31.00
Bulls on Wall Street Mentorship
1 × $31.00 -
×
 Rocking Wall Street with Gary Marks
1 × $6.00
Rocking Wall Street with Gary Marks
1 × $6.00 -
×
 WondaFX Signature Strategy with WondaFX
1 × $5.00
WondaFX Signature Strategy with WondaFX
1 × $5.00 -
×
 Bond Market Course with The Macro Compass
1 × $15.00
Bond Market Course with The Macro Compass
1 × $15.00 -
×
 Your Next Great Stock: How to Screen the Market for Tomorrow's Top Performers with Jack Hough
1 × $6.00
Your Next Great Stock: How to Screen the Market for Tomorrow's Top Performers with Jack Hough
1 × $6.00 -
×
 IRON CONDORS FOR INCOME 2017 with Sheridan Options Mentoring
1 × $6.00
IRON CONDORS FOR INCOME 2017 with Sheridan Options Mentoring
1 × $6.00 -
×
 Profit Freedom Blueprint with High Performance Trading
1 × $5.00
Profit Freedom Blueprint with High Performance Trading
1 × $5.00 -
×
 Trendfans & Trendline Breaks with Albert Yang
1 × $6.00
Trendfans & Trendline Breaks with Albert Yang
1 × $6.00 -
×
 Beat the Odds in Forex Trading: How to Identify and Profit from High Percentage Market Patterns with Igor Toshchakov
1 × $6.00
Beat the Odds in Forex Trading: How to Identify and Profit from High Percentage Market Patterns with Igor Toshchakov
1 × $6.00 -
×
 Master Class: Income Trading with Option Pit
1 × $101.00
Master Class: Income Trading with Option Pit
1 × $101.00 -
×
 Bear Market Strategies eLearning Course - Kirk - Van Tharp Institute
1 × $85.00
Bear Market Strategies eLearning Course - Kirk - Van Tharp Institute
1 × $85.00 -
×
 Market Controller Course with Controller FX
1 × $5.00
Market Controller Course with Controller FX
1 × $5.00 -
×
 The Indices Orderflow Masterclass with The Forex Scalpers
1 × $23.00
The Indices Orderflow Masterclass with The Forex Scalpers
1 × $23.00 -
×
 The Point of Control and Imbalance Course with Mike Valtos - Orderflows
1 × $15.00
The Point of Control and Imbalance Course with Mike Valtos - Orderflows
1 × $15.00 -
×
 Trading Like You’ve Never Heard Before – Digital Download
1 × $15.00
Trading Like You’ve Never Heard Before – Digital Download
1 × $15.00 -
×
 $20 – 52k 20 pips a day challange with Rafał Zuchowicz - TopMasterTrader
1 × $5.00
$20 – 52k 20 pips a day challange with Rafał Zuchowicz - TopMasterTrader
1 × $5.00 -
×
 Evolution Markets (Full Main Course)
1 × $5.00
Evolution Markets (Full Main Course)
1 × $5.00 -
×
 The Jupiter Effect with John Gribbin & Stephen Plagemann
1 × $6.00
The Jupiter Effect with John Gribbin & Stephen Plagemann
1 × $6.00 -
×
 W.D.Ganns Astrological Method
1 × $6.00
W.D.Ganns Astrological Method
1 × $6.00 -
×
 Insider Buying The Ultimate Leading Indicator with Alex Green
1 × $6.00
Insider Buying The Ultimate Leading Indicator with Alex Green
1 × $6.00 -
×
 Derivate Instruments by Brian A.Eales
1 × $6.00
Derivate Instruments by Brian A.Eales
1 × $6.00 -
×
 Humbled Trader Academy
1 × $5.00
Humbled Trader Academy
1 × $5.00 -
×
 MTA Master Trader Academy with Junior Charles
1 × $5.00
MTA Master Trader Academy with Junior Charles
1 × $5.00 -
×
 High Rollers Mega Course Bundle - 13 Market Moves
1 × $39.00
High Rollers Mega Course Bundle - 13 Market Moves
1 × $39.00 -
×
 Mechanical Timing Systems. The Key to Consistent Profits & Sharper Trading with Nelson Freeburg
1 × $6.00
Mechanical Timing Systems. The Key to Consistent Profits & Sharper Trading with Nelson Freeburg
1 × $6.00 -
×
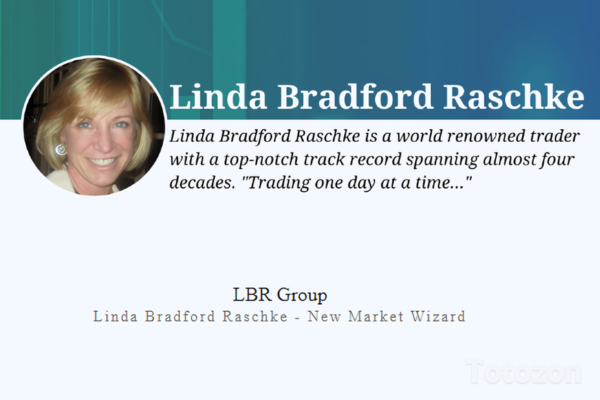 One Week S&P Workshop II with Linda Raschke
1 × $5.00
One Week S&P Workshop II with Linda Raschke
1 × $5.00 -
×
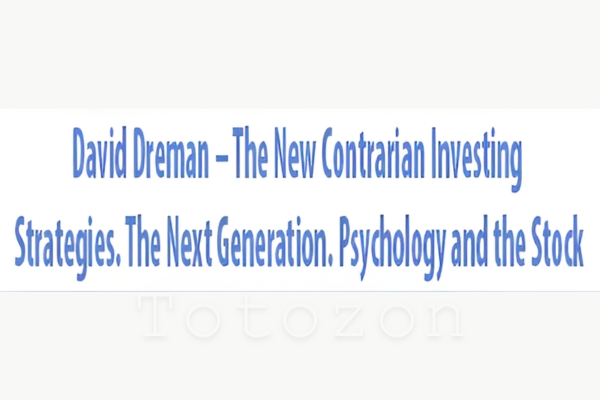 The New Contrarian Investing Strategies. The Next Generation. Psychology and the Stock with David Dreman
1 × $6.00
The New Contrarian Investing Strategies. The Next Generation. Psychology and the Stock with David Dreman
1 × $6.00 -
×
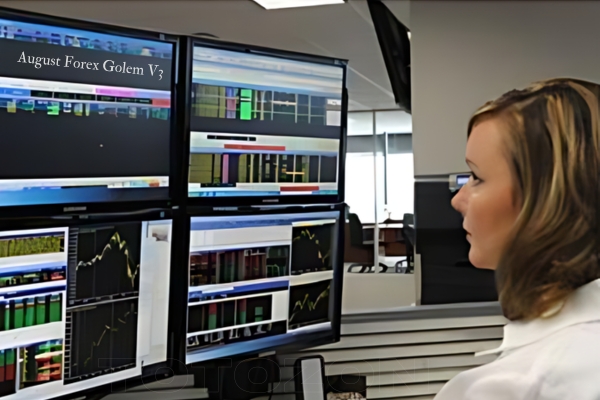 August Forex Golem V3
1 × $6.00
August Forex Golem V3
1 × $6.00 -
×
 Trading Signals And Training 100
1 × $6.00
Trading Signals And Training 100
1 × $6.00 -
×
 Matrix Spread Options Trading Course with Base Camp Trading
1 × $31.00
Matrix Spread Options Trading Course with Base Camp Trading
1 × $31.00 -
×
 Longlived Information & Intraday Pattern (Article) with Back and Andersen
1 × $6.00
Longlived Information & Intraday Pattern (Article) with Back and Andersen
1 × $6.00 -
×
 Video Bundle - 4d & "Into The Abyss" with Blackrabbitfx
1 × $6.00
Video Bundle - 4d & "Into The Abyss" with Blackrabbitfx
1 × $6.00 -
×
 Level 2 Trading Warfare
1 × $6.00
Level 2 Trading Warfare
1 × $6.00 -
×
 Active Investing courses notes with Alan Hull
1 × $6.00
Active Investing courses notes with Alan Hull
1 × $6.00 -
×
 The New Multi-10x on Steroids Pro Package
1 × $78.00
The New Multi-10x on Steroids Pro Package
1 × $78.00 -
×
 Zero to Hero Course with EVO Capital
1 × $13.00
Zero to Hero Course with EVO Capital
1 × $13.00 -
×
 SRs Trend Rider 2.0
1 × $6.00
SRs Trend Rider 2.0
1 × $6.00 -
×
 The Naked Eye: Raw Data Analytics with Edgar Torres - Raw Data Analytics
1 × $8.00
The Naked Eye: Raw Data Analytics with Edgar Torres - Raw Data Analytics
1 × $8.00

The Active Investor Blueprint with Steve Nison – Candle Charts
Original price was: $249.00.$23.00Current price is: $23.00.
File Size: 294.2 MB
Delivery Time: 1–12 hours
Media Type: Online Course
Content Proof: Watch Here!
You may check content proof of “The Active Investor Blueprint with Steve Nison – Candle Charts” below:
The Active Investor Blueprint with Steve Nison – Candle Charts
Are you looking to elevate your trading skills and enhance your investment strategies? “The Active Investor Blueprint” with Steve Nison, focusing on candle charts, offers a comprehensive guide to mastering the art of trading. This article will delve into the key components of this blueprint, providing you with insights to maximize your trading performance.
Introduction to Candle Charts
What Are Candle Charts?
Candle charts, also known as candlestick charts, are a type of financial chart used to represent price movements of an asset. Each candlestick typically shows one day, displaying the opening, closing, high, and low prices.
Why Use Candle Charts?
- Visual Clarity: They offer a clear visual representation of price movements.
- Trend Identification: Help in identifying trends and potential reversals.
- Versatility: Useful for all trading timeframes.
Steve Nison and Candle Charts
Who is Steve Nison?
Steve Nison is widely recognized as the pioneer who introduced Japanese candlestick charting to the Western world. His expertise has made him a respected figure in technical analysis.
The Importance of Nison’s Work
- Educational Impact: Nison’s books and courses have educated thousands of traders.
- Innovative Techniques: He developed unique strategies combining candlesticks with other forms of analysis.
The Active Investor Blueprint
Comprehensive Learning
The Active Investor Blueprint offers a step-by-step guide to using candle charts effectively, blending theory with practical applications.
Expert Guidance
Steve Nison provides insights and techniques that are grounded in years of experience and research, making complex concepts accessible.
Key Components of Candle Charts
Candlestick Anatomy
- Body: Represents the opening and closing prices.
- Wicks (Shadows): Show the highest and lowest prices during the period.
- Color: Indicates price direction (typically green for up, red for down).
Basic Candlestick Patterns
Doji
- Description: The opening and closing prices are almost identical.
- Significance: Indicates market indecision and potential reversal.
Hammer and Hanging Man
- Description: Small body with a long lower wick.
- Significance: Hammer signals a bullish reversal, Hanging Man signals a bearish reversal.
Engulfing Patterns
- Description: A larger body engulfs the previous candle’s body.
- Significance: Bullish Engulfing indicates upward momentum, Bearish Engulfing indicates downward momentum.
Complex Candlestick Patterns
Morning Star and Evening Star
- Description: Three-candle patterns indicating potential reversal.
- Significance: Morning Star signals bullish reversal, Evening Star signals bearish reversal.
Three Black Crows and Three White Soldiers
- Description: Three consecutive long candles in the same direction.
- Significance: Three Black Crows indicate strong bearish trend, Three White Soldiers indicate strong bullish trend.
Applying Candle Charts to Trading
Trend Analysis
- Identifying Trends: Use candlestick patterns to confirm the direction of the trend.
- Reversal Signals: Look for patterns indicating potential reversals to time entry and exit points.
Support and Resistance
- Defining Levels: Identify support and resistance levels using candlestick patterns.
- Trading the Levels: Use these levels to set stop-loss and take-profit orders.
Combining with Other Indicators
- Moving Averages: Confirm trends and reversals.
- Relative Strength Index (RSI): Identify overbought or oversold conditions.
- Bollinger Bands: Gauge market volatility and potential breakouts.
Developing a Trading Plan with Candle Charts
Setting Objectives
- Short-Term vs Long-Term: Define your trading goals based on your timeframe.
- Risk Management: Establish your risk tolerance and manage it through proper position sizing.
Strategy Formulation
- Entry and Exit Criteria: Define specific criteria based on candlestick patterns.
- Backtesting: Test your strategy on historical data to ensure its effectiveness.
Monitoring and Adjustment
- Regular Review: Continuously monitor your trades and adjust your strategy as needed.
- Learning from Mistakes: Analyze losses to understand what went wrong and improve your approach.
Benefits of Using Candle Charts
Improved Decision Making
Candlestick patterns provide clear signals that help traders make informed decisions.
Enhanced Market Understanding
Understanding candlestick patterns improves your overall grasp of market psychology and dynamics.
Versatility Across Markets
Candle charts can be applied to various markets, including stocks, forex, and commodities, making them a versatile tool for any trader.
Conclusion
“The Active Investor Blueprint” with Steve Nison – Candle Charts offers traders a powerful tool to enhance their trading strategies. By understanding and applying candlestick patterns, you can improve your market analysis, make more informed decisions, and achieve greater success in your trading endeavors. Start leveraging the insights from Steve Nison’s blueprint today to elevate your trading game.
Commonly Asked Questions:
- Business Model Innovation: Accept the truth of a legitimate business! Our strategy is organising a group buy in which participants share the costs. We use these cash to acquire popular courses from sale pages and make them available to people with limited financial resources. Despite the authors’ worries, our clients love the cost and accessibility we give.
- The Legal Environment: Yes or No The legality of our activity is ambiguous. While we don’t have specific permission from the course authors to resell the material, there is a technicality at work. The author did not specify any limits on resale when purchasing the course. This legal intricacy is both an opportunity for us and a boon for individuals looking for low-cost access.
- Quality Control: Uncovering the Truth
Getting to the heart of the issue – quality. Purchasing the course straight from the sale page guarantees that all documents and resources are the same as those obtained through traditional channels.
However, we distinguish ourselves by going beyond personal research and resale. It is crucial to note that we are not the official course providers, which means that the following premium services are not included in our package:
- There are no scheduled coaching calls or sessions with the author.
- Access to the author’s private Facebook group or web portal is not permitted.
- No access to the author’s private membership forum.
- There is no direct email support available from the author or their team.
We operate independently, with the goal of bridging the pricing gap without the extra services provided by official course channels. Your comprehension of our distinct approach is much appreciated.
Be the first to review “The Active Investor Blueprint with Steve Nison – Candle Charts”
You must be logged in to post a review.
Related products

Original price was: $649.00.$20.00Current price is: $20.00.

Forex Trading
Original price was: $2,997.00.$23.00Current price is: $23.00.

Forex Trading
Original price was: $4,997.00.$27.00Current price is: $27.00.

Forex Trading
Original price was: $2,000.00.$23.00Current price is: $23.00.

Forex Trading
Original price was: $1,098.00.$39.00Current price is: $39.00.

Forex Trading
Original price was: $125.00.$17.00Current price is: $17.00.
Original price was: $197.00.$5.00Current price is: $5.00.

Original price was: $799.00.$15.00Current price is: $15.00.
Forex Trading
Original price was: $499.00.$15.00Current price is: $15.00.

Original price was: $695.00.$41.00Current price is: $41.00.

Original price was: $497.00.$11.00Current price is: $11.00.

Forex Trading
Original price was: $697.00.$5.00Current price is: $5.00.

Original price was: $1,800.00.$54.00Current price is: $54.00.
Original price was: $450.00.$23.00Current price is: $23.00.

Original price was: $1,200.00.$23.00Current price is: $23.00.

Original price was: $997.00.$13.00Current price is: $13.00.

Forex Trading
Quantamentals – The Next Great Forefront Of Trading and Investing with Trading Markets
Original price was: $1,495.00.$8.00Current price is: $8.00.

Original price was: $310.00.$23.00Current price is: $23.00.

Forex Trading
Original price was: $850.00.$23.00Current price is: $23.00.

Original price was: $1,849.00.$15.00Current price is: $15.00.

Reviews
There are no reviews yet.