-
×
 Credit Spread Trading Made Simple 3.0
1 × $6.00
Credit Spread Trading Made Simple 3.0
1 × $6.00 -
×
 Adx Mastery Complete Course
1 × $6.00
Adx Mastery Complete Course
1 × $6.00 -
×
 How To Trade Forex Using Support & Resistance Levels with Vic Noble
1 × $6.00
How To Trade Forex Using Support & Resistance Levels with Vic Noble
1 × $6.00 -
×
 Quant Edge with T3 Live
1 × $6.00
Quant Edge with T3 Live
1 × $6.00 -
×
 PayTrading with Eric Shawn
1 × $6.00
PayTrading with Eric Shawn
1 × $6.00 -
×
 Behavior and Performance of Investment Newsletter Analysts (Article) with Alok Kumar
1 × $6.00
Behavior and Performance of Investment Newsletter Analysts (Article) with Alok Kumar
1 × $6.00 -
×
 Setups of a Winning Trader with Gareth Soloway
1 × $521.00
Setups of a Winning Trader with Gareth Soloway
1 × $521.00 -
×
 Team Bull Trading Academy
1 × $5.00
Team Bull Trading Academy
1 × $5.00 -
×
 Fibonacci for the Active Trader with Derrik Hobbs
1 × $6.00
Fibonacci for the Active Trader with Derrik Hobbs
1 × $6.00 -
×
 Qualitative - Financial Statement Analysis with Sandesh Banger
1 × $5.00
Qualitative - Financial Statement Analysis with Sandesh Banger
1 × $5.00 -
×
 Computational Financial Mathematics with Mathematica
1 × $6.00
Computational Financial Mathematics with Mathematica
1 × $6.00 -
×
 Preview of Markets with George Bayer
1 × $6.00
Preview of Markets with George Bayer
1 × $6.00 -
×
 Design for Six Sigma with Subir Chowdhury
1 × $6.00
Design for Six Sigma with Subir Chowdhury
1 × $6.00 -
×
 The Delphi Scalper 4 - Video + Metatrader Indicators with Jason Fielder
1 × $6.00
The Delphi Scalper 4 - Video + Metatrader Indicators with Jason Fielder
1 × $6.00 -
×
 High Probability Trading Using Elliott Wave And Fibonacci Analysis withVic Patel - Forex Training Group
1 × $10.00
High Probability Trading Using Elliott Wave And Fibonacci Analysis withVic Patel - Forex Training Group
1 × $10.00 -
×
 MACK - PATS Simple ES Scalping Strategy
1 × $15.00
MACK - PATS Simple ES Scalping Strategy
1 × $15.00 -
×
 Trade What You See, Not What You Believe with Larry Pesavento
1 × $6.00
Trade What You See, Not What You Believe with Larry Pesavento
1 × $6.00 -
×
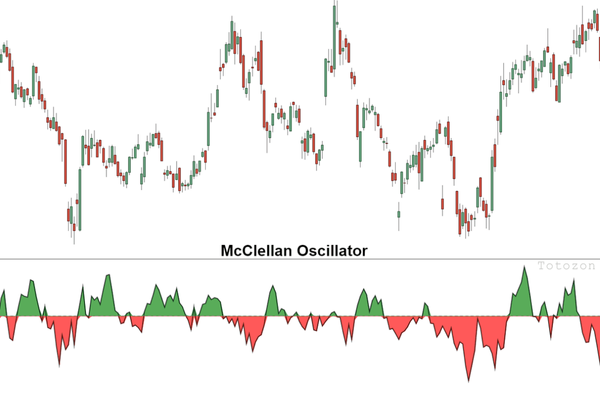 The McClellan Oscillator and Other Tools for with Tom McClellan
1 × $6.00
The McClellan Oscillator and Other Tools for with Tom McClellan
1 × $6.00 -
×
 Power Cycle Trading - Boot Camp for Swing Trading
1 × $6.00
Power Cycle Trading - Boot Camp for Swing Trading
1 × $6.00 -
×
 Hedge Fund Market Wizards: How Winning Traders Win with Jack Schwager
1 × $6.00
Hedge Fund Market Wizards: How Winning Traders Win with Jack Schwager
1 × $6.00 -
×
 How I use Technical Analysis & Orderflow with Adam Webb - Traderskew
1 × $54.00
How I use Technical Analysis & Orderflow with Adam Webb - Traderskew
1 × $54.00 -
×
 Scalping Master Course with Dayonetraders
1 × $6.00
Scalping Master Course with Dayonetraders
1 × $6.00 -
×
 Getting New Insights from Old Indicators with Martin Pring
1 × $6.00
Getting New Insights from Old Indicators with Martin Pring
1 × $6.00 -
×
 Fibonacci Trading & Dynamic Profit Targeting with Base Camp Trading
1 × $15.00
Fibonacci Trading & Dynamic Profit Targeting with Base Camp Trading
1 × $15.00 -
×
 T3 Live - The Simple Art of Trading
1 × $31.00
T3 Live - The Simple Art of Trading
1 × $31.00 -
×
 Technical Analysis 101: A Comprehensive Guide to Becoming a Better Trader Class with Jeff Bierman
1 × $6.00
Technical Analysis 101: A Comprehensive Guide to Becoming a Better Trader Class with Jeff Bierman
1 × $6.00 -
×
 Spread Trading
1 × $6.00
Spread Trading
1 × $6.00 -
×
 Financial Fortress with TradeSmart University
1 × $6.00
Financial Fortress with TradeSmart University
1 × $6.00 -
×
 FuturesTrader71 - webinar series (4 webinars)
1 × $6.00
FuturesTrader71 - webinar series (4 webinars)
1 × $6.00 -
×
 Algo Trading Masterclass with Ali Casey - StatOasis
1 × $23.00
Algo Trading Masterclass with Ali Casey - StatOasis
1 × $23.00

Marber on Markets – How to Make Money from Charts with Brian Marber
$6.00
File Size: Coming soon!
Delivery Time: 1–12 hours
Media Type: Online Course
Content Proof: Watch Here!
You may check content proof of “Marber on Markets – How to Make Money from Charts with Brian Marber” below:

Marber on Markets – How to Make Money from Charts with Brian Marber
Introduction
Navigating the financial markets can be daunting, but with Brian Marber’s insights in “Marber on Markets,” traders can learn the art of making money from charts. This approach blends technical analysis with market psychology to optimize trading strategies.
Understanding Chart Analysis
What is Chart Analysis?
Chart analysis involves examining graphical representations of market data to forecast future price movements.
Types of Charts
- Line Charts: Simplistic and show price trends over time.
- Bar Charts: Provide more data including opening, closing, high, and low prices.
- Candlestick Charts: Offer detailed information about market sentiment and potential reversals.
The Philosophy of Brian Marber
Marber’s Market Views
Brian Marber’s techniques are grounded in understanding that markets are driven by human emotions as much as by economic fundamentals.
The Importance of Price Behavior
Marber emphasizes that price action itself can often indicate what the market will do next, more so than external factors.
Key Concepts in Chart Analysis
Support and Resistance
Identify where prices are likely to halt and reverse, which are crucial for entry and exit points.
Trend Lines
Drawn to connect highs or lows to represent the trend direction and speed.
Applying Marber’s Methods
Step-by-Step Guide
- Identify the trend: Use trend lines to determine the market direction.
- Spot patterns: Look for common patterns like head and shoulders, double tops, and triangles.
- Wait for confirmation: Confirm patterns with additional indicators like volume or a moving average.
Using Moving Averages
Integrate moving averages to smooth out price data and verify trends.
Common Mistakes to Avoid
Overreliance on Indicators
While indicators are useful, Marber warns against using too many as it can lead to analysis paralysis.
Ignoring the Bigger Picture
Always consider the broader market conditions alongside the chart patterns.
Marber’s Insights on Market Psychology
Emotional Trading
Understanding the emotional aspect of trading is crucial. Recognize fear and greed in the chart patterns.
The Trader’s Mindset
Develop a disciplined trading strategy, focusing on long-term goals rather than short-term fluctuations.
Tools for Effective Chart Analysis
Recommended Software
- TradingView: Offers extensive charting tools and indicators.
- MetaTrader: Widely used for Forex and other financial market charts.
Advanced Techniques
Fibonacci Retracement
Use Fibonacci levels to identify potential reversal levels on the charts.
Elliott Wave Theory
Apply Elliott Wave principles to anticipate market moves based on trader psychology and price movements.
Conclusion
Brian Marber’s approach to making money from charts provides a comprehensive guide to navigating the markets with confidence. By mastering these techniques, traders can enhance their ability to make informed decisions based on chart analysis.
Frequently Asked Questions:
- What is the first step in learning chart analysis according to Brian Marber?
- The first step is to understand the basic types of charts and how they depict market data.
- How important is psychology in chart analysis?
- Psychology is crucial as it helps traders understand the emotional elements that drive market movements.
- Can chart analysis be used for all types of markets?
- Yes, chart analysis is versatile and can be applied to stocks, forex, commodities, and more.
- What is one common mistake new traders make?
- New traders often rely too heavily on indicators without understanding market context.
- How can one improve their chart analysis skills?
- Continuous practice, studying historical charts, and staying updated with new analysis techniques.
Be the first to review “Marber on Markets – How to Make Money from Charts with Brian Marber”
You must be logged in to post a review.
Related products

Original price was: $999.00.$5.00Current price is: $5.00.

Original price was: $299.00.$8.00Current price is: $8.00.

Original price was: $1,800.00.$54.00Current price is: $54.00.

Original price was: $497.00.$11.00Current price is: $11.00.

Original price was: $497.00.$31.00Current price is: $31.00.
Forex Trading
Original price was: $1,898.00.$10.00Current price is: $10.00.

Forex Trading
Original price was: $239.00.$8.00Current price is: $8.00.

Forex Trading
Quantamentals – The Next Great Forefront Of Trading and Investing with Trading Markets
Original price was: $1,495.00.$8.00Current price is: $8.00.

Forex Trading
Original price was: $125.00.$17.00Current price is: $17.00.

Forex Trading
Original price was: $999.00.$15.00Current price is: $15.00.

Original price was: $799.00.$15.00Current price is: $15.00.

Forex Trading
Original price was: $249.00.$15.00Current price is: $15.00.

Original price was: $1,200.00.$23.00Current price is: $23.00.

Original price was: $4,995.00.$15.00Current price is: $15.00.

Original price was: $2,120.00.$15.00Current price is: $15.00.

Forex Trading
Original price was: $397.00.$31.00Current price is: $31.00.
Forex Trading
Original price was: $797.00.$10.00Current price is: $10.00.

Original price was: $700.00.$39.00Current price is: $39.00.

Original price was: $1,849.00.$15.00Current price is: $15.00.

Original price was: $310.00.$23.00Current price is: $23.00.

Reviews
There are no reviews yet.