-
×
 Daily Price Action
1 × $23.00
Daily Price Action
1 × $23.00 -
×
 501 Stock Market Tips & Guidelines with Arshad Khan
1 × $6.00
501 Stock Market Tips & Guidelines with Arshad Khan
1 × $6.00 -
×
 Power Cycle Trading - Boot Camp for Swing Trading
1 × $6.00
Power Cycle Trading - Boot Camp for Swing Trading
1 × $6.00 -
×
 QuickBooks 2003 Official Guide
1 × $6.00
QuickBooks 2003 Official Guide
1 × $6.00 -
×
 Patterns of Speculation with Bertrand M.Roehner
1 × $6.00
Patterns of Speculation with Bertrand M.Roehner
1 × $6.00 -
×
 Marder Videos Reports 2019-2022 with Kevin Marder
1 × $104.00
Marder Videos Reports 2019-2022 with Kevin Marder
1 × $104.00 -
×
 Market Maps. High Probability Trading Techniques with Timothy Morge
1 × $6.00
Market Maps. High Probability Trading Techniques with Timothy Morge
1 × $6.00 -
×
 ICT Mentorship – 2019
1 × $13.00
ICT Mentorship – 2019
1 × $13.00 -
×
 Futures Trading (German)
1 × $6.00
Futures Trading (German)
1 × $6.00 -
×
 YTC Price Action Trader
1 × $6.00
YTC Price Action Trader
1 × $6.00 -
×
 Evolution Course with Kevin Trades
1 × $15.00
Evolution Course with Kevin Trades
1 × $15.00 -
×
 Exploring MetaStock Basic with Martin Pring
1 × $6.00
Exploring MetaStock Basic with Martin Pring
1 × $6.00 -
×
 VXX Made Easy By Option Pit
1 × $62.00
VXX Made Easy By Option Pit
1 × $62.00 -
×
 Slapped by the Invisible Hand: The Panic of 2007 with Gary Gorton
1 × $6.00
Slapped by the Invisible Hand: The Panic of 2007 with Gary Gorton
1 × $6.00 -
×
 Gap Trading for Stock and Options Traders with Damon Verial
1 × $6.00
Gap Trading for Stock and Options Traders with Damon Verial
1 × $6.00 -
×
 BWT Precision 7.0.2.3 (bluewavetrading.com)
1 × $31.00
BWT Precision 7.0.2.3 (bluewavetrading.com)
1 × $31.00 -
×
 New Generation Market Profile (May 2014)
1 × $15.00
New Generation Market Profile (May 2014)
1 × $15.00 -
×
 Stock Trader`s Almanac 2012 with Jeffrey Hirsch & Yale Hirsch
1 × $6.00
Stock Trader`s Almanac 2012 with Jeffrey Hirsch & Yale Hirsch
1 × $6.00 -
×
 7 Commandments of Stock Investing with Gene Marcial
1 × $6.00
7 Commandments of Stock Investing with Gene Marcial
1 × $6.00 -
×
 Handbook on the Knowledge Economy with David Rooney
1 × $6.00
Handbook on the Knowledge Economy with David Rooney
1 × $6.00 -
×
 A PLAN TO MAKE $4K MONTHLY ON $20K with Dan Sheridan - Sheridan Options Mentoring
1 × $15.00
A PLAN TO MAKE $4K MONTHLY ON $20K with Dan Sheridan - Sheridan Options Mentoring
1 × $15.00 -
×
 How to Pick Hot Reverse Merger Penny Stocks with John Lux
1 × $5.00
How to Pick Hot Reverse Merger Penny Stocks with John Lux
1 × $5.00 -
×
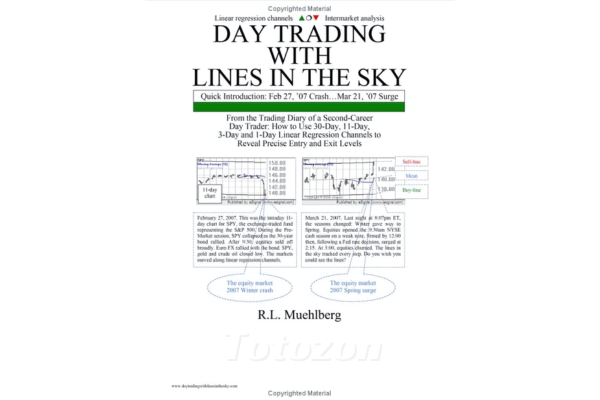 Day Trading with Lines in the Sky By R.L.Muehlberg
1 × $6.00
Day Trading with Lines in the Sky By R.L.Muehlberg
1 × $6.00 -
×
 Home Run Options Trading Course with Dave Aquino - Base Camp Trading
1 × $11.00
Home Run Options Trading Course with Dave Aquino - Base Camp Trading
1 × $11.00 -
×
 Options Trading & Ultimate MasterClass With Tyrone Abela - FX Evolution
1 × $54.00
Options Trading & Ultimate MasterClass With Tyrone Abela - FX Evolution
1 × $54.00 -
×
 Gillen Predicts with Jack Gillen
1 × $6.00
Gillen Predicts with Jack Gillen
1 × $6.00 -
×
 Yes You Can Time the Market! with Ben Stein
1 × $6.00
Yes You Can Time the Market! with Ben Stein
1 × $6.00 -
×
 Forecast 2012 Report with Larry Williams
1 × $6.00
Forecast 2012 Report with Larry Williams
1 × $6.00 -
×
 Manage By The Greeks 2016 with Sheridan
1 × $6.00
Manage By The Greeks 2016 with Sheridan
1 × $6.00 -
×
 Advanced Management Strategies - Home Study with Pristine Capital
1 × $27.00
Advanced Management Strategies - Home Study with Pristine Capital
1 × $27.00 -
×
 Trading Non-Farm Payroll Report
1 × $6.00
Trading Non-Farm Payroll Report
1 × $6.00 -
×
 Confidence to Hypnotize
1 × $6.00
Confidence to Hypnotize
1 × $6.00 -
×
 The Bare Essentials Of Investing: Teaching The Horse To Talk with Harold Bierman
1 × $6.00
The Bare Essentials Of Investing: Teaching The Horse To Talk with Harold Bierman
1 × $6.00 -
×
 Investment Philosophies
1 × $6.00
Investment Philosophies
1 × $6.00 -
×
 Lee Gettess’s Package
1 × $6.00
Lee Gettess’s Package
1 × $6.00 -
×
 ICT Trading Models with The Prop Trader
1 × $5.00
ICT Trading Models with The Prop Trader
1 × $5.00 -
×
 Elite Trader Package
1 × $31.00
Elite Trader Package
1 × $31.00 -
×
 Forex Mentor 2007 with Peter Bain
1 × $6.00
Forex Mentor 2007 with Peter Bain
1 × $6.00 -
×
 Latent Curve Models with Kenneth Bollen
1 × $6.00
Latent Curve Models with Kenneth Bollen
1 × $6.00 -
×
 WondaFX Signature Strategy with WondaFX
1 × $5.00
WondaFX Signature Strategy with WondaFX
1 × $5.00 -
×
 Forex Time Machine with Bill Poulos
1 × $6.00
Forex Time Machine with Bill Poulos
1 × $6.00 -
×
 ICT Prodigy Trading Course – $650K in Payouts with Alex Solignani
1 × $15.00
ICT Prodigy Trading Course – $650K in Payouts with Alex Solignani
1 × $15.00 -
×
 Planting Landmines for Explosive Profits with Dave Slingshot
1 × $6.00
Planting Landmines for Explosive Profits with Dave Slingshot
1 × $6.00 -
×
 Fibonacci Swing Trader 2.0 with Frank Paul - Forexmentor
1 × $6.00
Fibonacci Swing Trader 2.0 with Frank Paul - Forexmentor
1 × $6.00 -
×
 A Trader's Guide to Self-Discipline: Proven Techniques to Improve Trading Profits
1 × $6.00
A Trader's Guide to Self-Discipline: Proven Techniques to Improve Trading Profits
1 × $6.00 -
×
 How Big Money Trades A Key Aspect of Systems Thinking - Van Tharp and Chuck Whitman – Van Tharp
1 × $46.00
How Big Money Trades A Key Aspect of Systems Thinking - Van Tharp and Chuck Whitman – Van Tharp
1 × $46.00 -
×
 Pentagonal Time Cycle Theory
1 × $6.00
Pentagonal Time Cycle Theory
1 × $6.00 -
×
 Market Neutral Strategies with Bruce I.Jacobs & Kenneth N.Levy
1 × $6.00
Market Neutral Strategies with Bruce I.Jacobs & Kenneth N.Levy
1 × $6.00 -
×
 Practical Portfolio Performance Measurement and Attribution (2nd Ed.) with Carl Bacon
1 × $6.00
Practical Portfolio Performance Measurement and Attribution (2nd Ed.) with Carl Bacon
1 × $6.00 -
×
 Access All Areas with Marwood Research
1 × $54.00
Access All Areas with Marwood Research
1 × $54.00 -
×
 The Complete Guide to Multiple Time Frame Analysis & Reading Price Action with Aiman Almansoori
1 × $13.00
The Complete Guide to Multiple Time Frame Analysis & Reading Price Action with Aiman Almansoori
1 × $13.00 -
×
 Creating the Optimal Trade for Explosive Profits with George A.Fontanills
1 × $6.00
Creating the Optimal Trade for Explosive Profits with George A.Fontanills
1 × $6.00 -
×
 Trading Floor Training
1 × $6.00
Trading Floor Training
1 × $6.00 -
×
 TenfoldFX Academy Course with Kenneth John
1 × $17.00
TenfoldFX Academy Course with Kenneth John
1 × $17.00 -
×
 Volatility Position Risk Management with Cynthia Kase
1 × $6.00
Volatility Position Risk Management with Cynthia Kase
1 × $6.00 -
×
 Practical Elliott Wave Trading Strategies with Robert Miner
1 × $6.00
Practical Elliott Wave Trading Strategies with Robert Miner
1 × $6.00 -
×
 Advanced Trading Course - Footprint Charts, Market Profile & TPO with Jayson Casper
1 × $31.00
Advanced Trading Course - Footprint Charts, Market Profile & TPO with Jayson Casper
1 × $31.00 -
×
 Forex & Fibonacci Day Trading Seminar - $695
1 × $6.00
Forex & Fibonacci Day Trading Seminar - $695
1 × $6.00 -
×
 The Trading Blueprint with Brad Goh - The Trading Geek
1 × $5.00
The Trading Blueprint with Brad Goh - The Trading Geek
1 × $5.00 -
×
 Forex Trading Plan - Learn How To Set SMART Trading Goals! with Anas Abba & FXMindTrix Academy
1 × $6.00
Forex Trading Plan - Learn How To Set SMART Trading Goals! with Anas Abba & FXMindTrix Academy
1 × $6.00 -
×
 Option Greeks Class with Don Kaufman
1 × $6.00
Option Greeks Class with Don Kaufman
1 × $6.00 -
×
 Forex Mastery with Willis University
1 × $6.00
Forex Mastery with Willis University
1 × $6.00 -
×
 ICT Charter Complete Course (2019)
1 × $13.00
ICT Charter Complete Course (2019)
1 × $13.00 -
×
 Essentials in Quantitative Trading QT01 By HangukQuant's
1 × $23.00
Essentials in Quantitative Trading QT01 By HangukQuant's
1 × $23.00

Bollinger Bands Trading Strategies That Work
$6.00
File Size: Coming soon!
Delivery Time: 1–12 hours
Media Type: Online Course
Bollinger Bands Trading Strategies That Work
Understanding Bollinger Bands
Bollinger Bands, created by John Bollinger, are one of the most versatile and effective tools in a trader’s arsenal. These bands consist of a middle band (usually a 20-day simple moving average), an upper band (2 standard deviations above the middle band), and a lower band (2 standard deviations below the middle band). They help traders identify overbought and oversold conditions in the market.
How Bollinger Bands Work
The Concept of Volatility
Volatility is a key aspect of Bollinger Bands. The bands expand and contract based on market volatility. When the market is volatile, the bands widen, and when the market is stable, they contract. This behavior makes Bollinger Bands an excellent indicator for anticipating price movements.
The Middle Band
The middle band, which is typically a 20-day simple moving average, serves as the baseline for the upper and lower bands. It represents the average price over a specific period and helps in identifying the overall trend.
The Upper and Lower Bands
The upper and lower bands are set at 2 standard deviations away from the middle band. These bands act as dynamic support and resistance levels, which help traders make informed decisions.
Bollinger Bands Trading Strategies
Strategy 1: Bollinger Bounce
What is the Bollinger Bounce?
The Bollinger Bounce strategy relies on the concept that prices tend to revert to the mean. When the price touches the upper or lower band, it often bounces back towards the middle band.
How to Trade the Bollinger Bounce
- Identify the Touch: Wait for the price to touch the upper or lower band.
- Confirm the Bounce: Look for a reversal candlestick pattern to confirm the bounce.
- Enter the Trade: Enter the trade once the bounce is confirmed, aiming for the middle band as the target.
Strategy 2: Bollinger Squeeze
What is the Bollinger Squeeze?
The Bollinger Squeeze occurs when the bands contract, indicating low volatility. This situation often precedes a significant price movement, making it a great setup for breakout trades.
How to Trade the Bollinger Squeeze
- Identify the Squeeze: Look for the bands to contract tightly.
- Confirm the Breakout: Use additional indicators like the Relative Strength Index (RSI) to confirm the breakout direction.
- Enter the Trade: Enter the trade in the direction of the breakout, placing stop-loss orders just outside the bands.
Strategy 3: Riding the Bands
What is Riding the Bands?
Riding the Bands involves trading with the trend, where the price stays close to the upper or lower band for an extended period.
How to Trade by Riding the Bands
- Identify the Trend: Use the middle band to determine the trend direction.
- Confirm the Trend: Ensure the price consistently touches the upper or lower band without significant pullbacks.
- Enter the Trade: Enter the trade in the direction of the trend, using the opposite band as a trailing stop.
Strategy 4: Bollinger Band Breakouts
What are Bollinger Band Breakouts?
Breakouts occur when the price moves outside the bands, indicating a strong directional movement.
How to Trade Bollinger Band Breakouts
- Identify the Breakout: Look for the price to close outside the bands.
- Confirm the Strength: Use volume indicators to confirm the strength of the breakout.
- Enter the Trade: Enter the trade in the direction of the breakout, setting stop-loss orders within the bands.
Combining Bollinger Bands with Other Indicators
Relative Strength Index (RSI)
Combining Bollinger Bands with the RSI can enhance the reliability of trading signals. The RSI helps confirm overbought or oversold conditions, providing additional context for Bollinger Band signals.
Moving Averages
Using moving averages alongside Bollinger Bands can help in identifying the overall trend. For example, a 50-day moving average can be used to confirm long-term trends.
Volume Indicators
Volume indicators, such as the On-Balance Volume (OBV), can confirm the strength of breakouts and bounces, making them valuable tools in conjunction with Bollinger Bands.
Risk Management in Bollinger Bands Trading
Setting Stop-Loss Orders
Stop-loss orders are crucial in Bollinger Bands trading to manage risk effectively. Place stop-loss orders just outside the bands to minimize losses in case of false signals.
Position Sizing
Proper position sizing ensures that you do not risk too much on a single trade. Use a fixed percentage of your trading capital for each trade to manage risk effectively.
Regular Review and Adjustment
Regularly review your trading strategy and adjust the parameters of the Bollinger Bands to suit changing market conditions. This ongoing adjustment helps in maintaining the effectiveness of the strategy.
Conclusion
Bollinger Bands Trading Strategies are powerful tools for both novice and experienced traders. By understanding the principles behind Bollinger Bands and implementing these strategies, you can enhance your trading performance and achieve consistent results. Remember to combine Bollinger Bands with other indicators, practice risk management, and stay disciplined in your trading approach.
FAQs
What are Bollinger Bands?
Bollinger Bands are a technical analysis tool that consists of a middle band (usually a 20-day simple moving average) and two outer bands set at 2 standard deviations away from the middle band. They help identify overbought and oversold conditions.
How do Bollinger Bands help in trading?
Bollinger Bands help in identifying volatility and potential price reversals. They provide dynamic support and resistance levels, making them useful for various trading strategies.
What is the Bollinger Bounce strategy?
The Bollinger Bounce strategy involves trading based on the idea that prices tend to revert to the mean. When the price touches the upper or lower band, it often bounces back towards the middle band.
Can Bollinger Bands be used with other indicators?
Yes, Bollinger Bands can be combined with indicators like the Relative Strength Index (RSI), moving averages, and volume indicators to enhance the reliability of trading signals.
What is the Bollinger Squeeze?
The Bollinger Squeeze occurs when the bands contract, indicating low volatility. This situation often precedes a significant price movement, making it a great setup for breakout trades.
Be the first to review “Bollinger Bands Trading Strategies That Work”
You must be logged in to post a review.
Related products

Original price was: $310.00.$23.00Current price is: $23.00.

Original price was: $895.00.$15.00Current price is: $15.00.

Forex Trading
Original price was: $499.00.$15.00Current price is: $15.00.

Original price was: $700.00.$39.00Current price is: $39.00.

Forex Trading
Original price was: $799.00.$15.00Current price is: $15.00.

Forex Trading
Original price was: $125.00.$17.00Current price is: $17.00.
Forex Trading
Original price was: $550.00.$5.00Current price is: $5.00.

Original price was: $1,849.00.$15.00Current price is: $15.00.

Forex Trading
Original price was: $2,997.00.$23.00Current price is: $23.00.

Original price was: $695.00.$41.00Current price is: $41.00.
Forex Trading
Original price was: $697.00.$5.00Current price is: $5.00.

Forex Trading
Original price was: $2,995.00.$31.00Current price is: $31.00.

Forex Trading
Original price was: $239.00.$8.00Current price is: $8.00.

Original price was: $997.00.$13.00Current price is: $13.00.

Original price was: $799.00.$15.00Current price is: $15.00.
Original price was: $497.00.$11.00Current price is: $11.00.

Forex Trading
Quantamentals – The Next Great Forefront Of Trading and Investing with Trading Markets
Original price was: $1,495.00.$8.00Current price is: $8.00.

Forex Trading
Original price was: $797.00.$10.00Current price is: $10.00.

Original price was: $299.00.$8.00Current price is: $8.00.

Forex Trading
Original price was: $999.00.$15.00Current price is: $15.00.
Reviews
There are no reviews yet.