-
×
 Trading Price Action Reversals (Kindle) with Al Brooks
1 × $6.00
Trading Price Action Reversals (Kindle) with Al Brooks
1 × $6.00 -
×
 WondaFX Signature Strategy with WondaFX
1 × $5.00
WondaFX Signature Strategy with WondaFX
1 × $5.00 -
×
 The Better Butterfly Course with David Vallieres – Tradingology
1 × $39.00
The Better Butterfly Course with David Vallieres – Tradingology
1 × $39.00 -
×
 Trading Tuitions - Mastering Amibroker Formula Language (AFL)
1 × $15.00
Trading Tuitions - Mastering Amibroker Formula Language (AFL)
1 × $15.00 -
×
 The Tickmaster Indicator
1 × $54.00
The Tickmaster Indicator
1 × $54.00 -
×
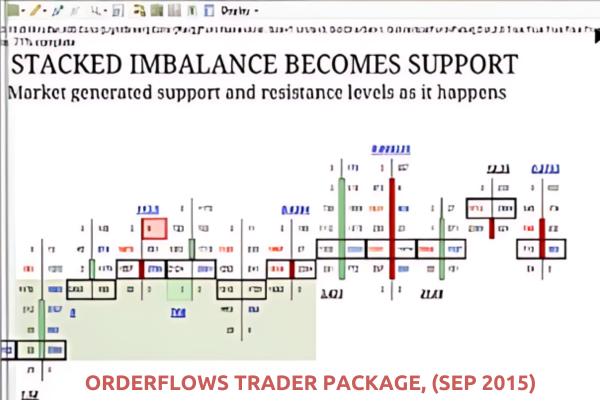 OrderFlows Trader Package, (Sep 2015)
1 × $54.00
OrderFlows Trader Package, (Sep 2015)
1 × $54.00 -
×
 Inner Circle Course with Darius Fx
1 × $24.00
Inner Circle Course with Darius Fx
1 × $24.00 -
×
 Penny Stock Mastery
1 × $31.00
Penny Stock Mastery
1 × $31.00 -
×
 Trading Dave Landry’s Ultimate Bow Ties Strategy with Dave Landry
1 × $6.00
Trading Dave Landry’s Ultimate Bow Ties Strategy with Dave Landry
1 × $6.00 -
×
 The Orderflows Trade Opportunities Encyclopedia with Michael Valtos
1 × $8.00
The Orderflows Trade Opportunities Encyclopedia with Michael Valtos
1 × $8.00 -
×
 Trading Non-Farm Payroll Report
1 × $6.00
Trading Non-Farm Payroll Report
1 × $6.00 -
×
 Learn to Trade Forex and Stocks – From Beginner to Advanced
1 × $6.00
Learn to Trade Forex and Stocks – From Beginner to Advanced
1 × $6.00 -
×
 Essentials in Quantitative Trading QT01 By HangukQuant's
1 × $23.00
Essentials in Quantitative Trading QT01 By HangukQuant's
1 × $23.00 -
×
 News FX Strategy with Zain Agha
1 × $6.00
News FX Strategy with Zain Agha
1 × $6.00 -
×
 Street Smarts & TS Code with Larry Connors & Linda Bradford Rashcke
1 × $6.00
Street Smarts & TS Code with Larry Connors & Linda Bradford Rashcke
1 × $6.00 -
×
 The Complete Guide to Multiple Time Frame Analysis & Reading Price Action with Aiman Almansoori
1 × $13.00
The Complete Guide to Multiple Time Frame Analysis & Reading Price Action with Aiman Almansoori
1 × $13.00 -
×
 Options Trading & Ultimate MasterClass With Tyrone Abela - FX Evolution
1 × $54.00
Options Trading & Ultimate MasterClass With Tyrone Abela - FX Evolution
1 × $54.00 -
×
 The Naked Eye: Raw Data Analytics with Edgar Torres - Raw Data Analytics
1 × $8.00
The Naked Eye: Raw Data Analytics with Edgar Torres - Raw Data Analytics
1 × $8.00 -
×
 Mission Million Money Management Course
1 × $31.00
Mission Million Money Management Course
1 × $31.00 -
×
 Crystal Ball Pack PLUS bonus Live Trade By Pat Mitchell - Trick Trades
1 × $20.00
Crystal Ball Pack PLUS bonus Live Trade By Pat Mitchell - Trick Trades
1 × $20.00 -
×
 War Room Technicals Vol 1 with Trick Traders
1 × $6.00
War Room Technicals Vol 1 with Trick Traders
1 × $6.00 -
×
 Trend Hunter Strategy
1 × $5.00
Trend Hunter Strategy
1 × $5.00 -
×
 Restore & Enhance Your Biofield (Advanced) by Spirituality Zone
1 × $15.40
Restore & Enhance Your Biofield (Advanced) by Spirituality Zone
1 × $15.40 -
×
 White Phoenix’s The Smart (Money) Approach to Trading with Jayson Casper
1 × $39.00
White Phoenix’s The Smart (Money) Approach to Trading with Jayson Casper
1 × $39.00 -
×
 The Fx220 1 on 1 Mentoring Program
1 × $5.00
The Fx220 1 on 1 Mentoring Program
1 × $5.00 -
×
 Markers System Plus v5 (Oct 2016)
1 × $31.00
Markers System Plus v5 (Oct 2016)
1 × $31.00 -
×
 CFA Level 1 – PassMaster 2004 CD with Stalla
1 × $6.00
CFA Level 1 – PassMaster 2004 CD with Stalla
1 × $6.00 -
×
 Vertical Spreads. Strategy Intensive
1 × $4.00
Vertical Spreads. Strategy Intensive
1 × $4.00 -
×
 Quantamentals - The Next Great Forefront Of Trading and Investing with Trading Markets
1 × $8.00
Quantamentals - The Next Great Forefront Of Trading and Investing with Trading Markets
1 × $8.00 -
×
 Forex Advanced with Prophetic Pips Academy
1 × $5.00
Forex Advanced with Prophetic Pips Academy
1 × $5.00 -
×
 Alpesh Patel Indicator with Alpesh Patel
1 × $62.00
Alpesh Patel Indicator with Alpesh Patel
1 × $62.00 -
×
 Foundation & Application of the Market with Jim Dalton - JimDalton Trading
1 × $5.00
Foundation & Application of the Market with Jim Dalton - JimDalton Trading
1 × $5.00 -
×
 GLOBAL MACRO PRO TRADING COURSE
1 × $31.00
GLOBAL MACRO PRO TRADING COURSE
1 × $31.00 -
×
 George Bayer Soft 1.02
1 × $6.00
George Bayer Soft 1.02
1 × $6.00 -
×
 The Bible of Options Strategies: The Definitive Guide for Practical Trading Strategies with Guy Cohen
1 × $6.00
The Bible of Options Strategies: The Definitive Guide for Practical Trading Strategies with Guy Cohen
1 × $6.00 -
×
 Small Account Growth Class – Strategies Course
1 × $23.00
Small Account Growth Class – Strategies Course
1 × $23.00 -
×
 Tomorrow Hot New Indicators (Video) with Thomas Demark
1 × $6.00
Tomorrow Hot New Indicators (Video) with Thomas Demark
1 × $6.00 -
×
 Stock Trading Success - You Make The Call - How To Set Entries And Exits with Steve Nison and K.Cal
1 × $6.00
Stock Trading Success - You Make The Call - How To Set Entries And Exits with Steve Nison and K.Cal
1 × $6.00 -
×
 A Bull in China with Jim Rogers
1 × $6.00
A Bull in China with Jim Rogers
1 × $6.00 -
×
 A Seminar On Ocean Theory Home Study Trading Course with Pat Raffalovich
1 × $6.00
A Seminar On Ocean Theory Home Study Trading Course with Pat Raffalovich
1 × $6.00 -
×
 Reedstrader 101: Mechanical Trading Strategy Workshop - REEDSTRADER
1 × $31.00
Reedstrader 101: Mechanical Trading Strategy Workshop - REEDSTRADER
1 × $31.00 -
×
 Market Structure Masterclass with Braveheart Trading
1 × $5.00
Market Structure Masterclass with Braveheart Trading
1 × $5.00 -
×
 Wyckoff Analytics Courses Collection
1 × $27.00
Wyckoff Analytics Courses Collection
1 × $27.00 -
×
 Profiletraders - MARKET PROFILE TACTICAL STRATEGIES FOR DAY TRADING
1 × $23.00
Profiletraders - MARKET PROFILE TACTICAL STRATEGIES FOR DAY TRADING
1 × $23.00 -
×
 Evolution Markets FX – TPOT 2.0
1 × $5.00
Evolution Markets FX – TPOT 2.0
1 × $5.00 -
×
 Van Tharp Courses Collection
1 × $41.00
Van Tharp Courses Collection
1 × $41.00 -
×
 Compass Trading System with Right Line Trading
1 × $39.00
Compass Trading System with Right Line Trading
1 × $39.00 -
×
 Forex Power Strategy Course with Jason Steele
1 × $6.00
Forex Power Strategy Course with Jason Steele
1 × $6.00 -
×
 The Indices Orderflow Masterclass with The Forex Scalpers
1 × $23.00
The Indices Orderflow Masterclass with The Forex Scalpers
1 × $23.00 -
×
 Trading Trainer - 6 Percent Protocol
1 × $39.00
Trading Trainer - 6 Percent Protocol
1 × $39.00 -
×
 How Charts Can Help You in the Stock Market with William Jiller
1 × $6.00
How Charts Can Help You in the Stock Market with William Jiller
1 × $6.00 -
×
 How To Read The Market Professionally with TradeSmart
1 × $27.00
How To Read The Market Professionally with TradeSmart
1 × $27.00 -
×
 Main Online Course with FestX
1 × $5.00
Main Online Course with FestX
1 × $5.00 -
×
 Active Beta Indexes with Khalid Ghayur
1 × $6.00
Active Beta Indexes with Khalid Ghayur
1 × $6.00 -
×
 The Inner Circle Seminar
1 × $15.00
The Inner Circle Seminar
1 × $15.00 -
×
 Price Action Stock Day Trading Course with Trade That Swing
1 × $62.00
Price Action Stock Day Trading Course with Trade That Swing
1 × $62.00 -
×
 A Day In The Life Of A Forex Trader with Vic Noble & Shirley Hudson
1 × $23.00
A Day In The Life Of A Forex Trader with Vic Noble & Shirley Hudson
1 × $23.00 -
×
 War Room Psychology Vol. 4 with Pat Mitchell – Trick Trades
1 × $23.00
War Room Psychology Vol. 4 with Pat Mitchell – Trick Trades
1 × $23.00 -
×
 Crypto Trading Academy with Cheeky Investor - Aussie Day Trader
1 × $13.00
Crypto Trading Academy with Cheeky Investor - Aussie Day Trader
1 × $13.00 -
×
 Rich in America: Secrets to Creating and Preserving Wealth with Jeffrey Maurer
1 × $6.00
Rich in America: Secrets to Creating and Preserving Wealth with Jeffrey Maurer
1 × $6.00 -
×
 Create A Forex Trading Cash Money Machine
1 × $54.00
Create A Forex Trading Cash Money Machine
1 × $54.00 -
×
 Self-Managed Trading with Stochastics By George Lane
1 × $4.00
Self-Managed Trading with Stochastics By George Lane
1 × $4.00 -
×
 How To Successfully Trade The Haggerty 1,2,3 Strategy Home Study Trading Course with Kevin Haggerty
1 × $6.00
How To Successfully Trade The Haggerty 1,2,3 Strategy Home Study Trading Course with Kevin Haggerty
1 × $6.00 -
×
 Option Trader Magazine (optionstradermag.com) with Magazine
1 × $6.00
Option Trader Magazine (optionstradermag.com) with Magazine
1 × $6.00 -
×
 Forex Powerband Dominator
1 × $6.00
Forex Powerband Dominator
1 × $6.00 -
×
 Practical Speculation with Victor Niederhoffer, Laurel Kenner
1 × $6.00
Practical Speculation with Victor Niederhoffer, Laurel Kenner
1 × $6.00 -
×
 SQX Mentorship with Tip Toe Hippo
1 × $23.00
SQX Mentorship with Tip Toe Hippo
1 × $23.00 -
×
 Hot Trading Investing Strategy: ETF and Futures with QSB Funds
1 × $6.00
Hot Trading Investing Strategy: ETF and Futures with QSB Funds
1 × $6.00

Bollinger Bands Trading Strategies That Work
$6.00
File Size: Coming soon!
Delivery Time: 1–12 hours
Media Type: Online Course
Bollinger Bands Trading Strategies That Work
Understanding Bollinger Bands
Bollinger Bands, created by John Bollinger, are one of the most versatile and effective tools in a trader’s arsenal. These bands consist of a middle band (usually a 20-day simple moving average), an upper band (2 standard deviations above the middle band), and a lower band (2 standard deviations below the middle band). They help traders identify overbought and oversold conditions in the market.
How Bollinger Bands Work
The Concept of Volatility
Volatility is a key aspect of Bollinger Bands. The bands expand and contract based on market volatility. When the market is volatile, the bands widen, and when the market is stable, they contract. This behavior makes Bollinger Bands an excellent indicator for anticipating price movements.
The Middle Band
The middle band, which is typically a 20-day simple moving average, serves as the baseline for the upper and lower bands. It represents the average price over a specific period and helps in identifying the overall trend.
The Upper and Lower Bands
The upper and lower bands are set at 2 standard deviations away from the middle band. These bands act as dynamic support and resistance levels, which help traders make informed decisions.
Bollinger Bands Trading Strategies
Strategy 1: Bollinger Bounce
What is the Bollinger Bounce?
The Bollinger Bounce strategy relies on the concept that prices tend to revert to the mean. When the price touches the upper or lower band, it often bounces back towards the middle band.
How to Trade the Bollinger Bounce
- Identify the Touch: Wait for the price to touch the upper or lower band.
- Confirm the Bounce: Look for a reversal candlestick pattern to confirm the bounce.
- Enter the Trade: Enter the trade once the bounce is confirmed, aiming for the middle band as the target.
Strategy 2: Bollinger Squeeze
What is the Bollinger Squeeze?
The Bollinger Squeeze occurs when the bands contract, indicating low volatility. This situation often precedes a significant price movement, making it a great setup for breakout trades.
How to Trade the Bollinger Squeeze
- Identify the Squeeze: Look for the bands to contract tightly.
- Confirm the Breakout: Use additional indicators like the Relative Strength Index (RSI) to confirm the breakout direction.
- Enter the Trade: Enter the trade in the direction of the breakout, placing stop-loss orders just outside the bands.
Strategy 3: Riding the Bands
What is Riding the Bands?
Riding the Bands involves trading with the trend, where the price stays close to the upper or lower band for an extended period.
How to Trade by Riding the Bands
- Identify the Trend: Use the middle band to determine the trend direction.
- Confirm the Trend: Ensure the price consistently touches the upper or lower band without significant pullbacks.
- Enter the Trade: Enter the trade in the direction of the trend, using the opposite band as a trailing stop.
Strategy 4: Bollinger Band Breakouts
What are Bollinger Band Breakouts?
Breakouts occur when the price moves outside the bands, indicating a strong directional movement.
How to Trade Bollinger Band Breakouts
- Identify the Breakout: Look for the price to close outside the bands.
- Confirm the Strength: Use volume indicators to confirm the strength of the breakout.
- Enter the Trade: Enter the trade in the direction of the breakout, setting stop-loss orders within the bands.
Combining Bollinger Bands with Other Indicators
Relative Strength Index (RSI)
Combining Bollinger Bands with the RSI can enhance the reliability of trading signals. The RSI helps confirm overbought or oversold conditions, providing additional context for Bollinger Band signals.
Moving Averages
Using moving averages alongside Bollinger Bands can help in identifying the overall trend. For example, a 50-day moving average can be used to confirm long-term trends.
Volume Indicators
Volume indicators, such as the On-Balance Volume (OBV), can confirm the strength of breakouts and bounces, making them valuable tools in conjunction with Bollinger Bands.
Risk Management in Bollinger Bands Trading
Setting Stop-Loss Orders
Stop-loss orders are crucial in Bollinger Bands trading to manage risk effectively. Place stop-loss orders just outside the bands to minimize losses in case of false signals.
Position Sizing
Proper position sizing ensures that you do not risk too much on a single trade. Use a fixed percentage of your trading capital for each trade to manage risk effectively.
Regular Review and Adjustment
Regularly review your trading strategy and adjust the parameters of the Bollinger Bands to suit changing market conditions. This ongoing adjustment helps in maintaining the effectiveness of the strategy.
Conclusion
Bollinger Bands Trading Strategies are powerful tools for both novice and experienced traders. By understanding the principles behind Bollinger Bands and implementing these strategies, you can enhance your trading performance and achieve consistent results. Remember to combine Bollinger Bands with other indicators, practice risk management, and stay disciplined in your trading approach.
FAQs
What are Bollinger Bands?
Bollinger Bands are a technical analysis tool that consists of a middle band (usually a 20-day simple moving average) and two outer bands set at 2 standard deviations away from the middle band. They help identify overbought and oversold conditions.
How do Bollinger Bands help in trading?
Bollinger Bands help in identifying volatility and potential price reversals. They provide dynamic support and resistance levels, making them useful for various trading strategies.
What is the Bollinger Bounce strategy?
The Bollinger Bounce strategy involves trading based on the idea that prices tend to revert to the mean. When the price touches the upper or lower band, it often bounces back towards the middle band.
Can Bollinger Bands be used with other indicators?
Yes, Bollinger Bands can be combined with indicators like the Relative Strength Index (RSI), moving averages, and volume indicators to enhance the reliability of trading signals.
What is the Bollinger Squeeze?
The Bollinger Squeeze occurs when the bands contract, indicating low volatility. This situation often precedes a significant price movement, making it a great setup for breakout trades.
Be the first to review “Bollinger Bands Trading Strategies That Work”
You must be logged in to post a review.
Related products
Original price was: $649.00.$20.00Current price is: $20.00.

Forex Trading
Original price was: $125.00.$17.00Current price is: $17.00.

Original price was: $695.00.$41.00Current price is: $41.00.

Original price was: $1,200.00.$23.00Current price is: $23.00.
Forex Trading
Original price was: $850.00.$23.00Current price is: $23.00.

Original price was: $999.00.$5.00Current price is: $5.00.

Forex Trading
Original price was: $499.00.$15.00Current price is: $15.00.

Original price was: $197.00.$5.00Current price is: $5.00.
Original price was: $1,800.00.$54.00Current price is: $54.00.

Original price was: $310.00.$23.00Current price is: $23.00.

Forex Trading
Original price was: $799.00.$15.00Current price is: $15.00.
Original price was: $450.00.$23.00Current price is: $23.00.

Original price was: $1,849.00.$15.00Current price is: $15.00.

Forex Trading
Original price was: $697.00.$5.00Current price is: $5.00.
Forex Trading
Quantamentals – The Next Great Forefront Of Trading and Investing with Trading Markets
Original price was: $1,495.00.$8.00Current price is: $8.00.
Original price was: $997.00.$13.00Current price is: $13.00.

Forex Trading
Original price was: $239.00.$8.00Current price is: $8.00.

Forex Trading
Original price was: $2,000.00.$23.00Current price is: $23.00.

Original price was: $139.00.$23.00Current price is: $23.00.

Forex Trading
Original price was: $999.00.$15.00Current price is: $15.00.
Reviews
There are no reviews yet.