-
×
 TRADING NFX Course with Andrew NFX
1 × $5.00
TRADING NFX Course with Andrew NFX
1 × $5.00 -
×
 Algo Trading Masterclass with Ali Casey - StatOasis
1 × $23.00
Algo Trading Masterclass with Ali Casey - StatOasis
1 × $23.00 -
×
 W. D Gann 's Square Of 9 Applied To Modern Markets with Sean Avidar - Hexatrade350
1 × $23.00
W. D Gann 's Square Of 9 Applied To Modern Markets with Sean Avidar - Hexatrade350
1 × $23.00 -
×
 Markets 101 Complete Course with Joseph Wang - Central Banking 101
1 × $13.00
Markets 101 Complete Course with Joseph Wang - Central Banking 101
1 × $13.00 -
×
 All Weather Butterfly Program - A Deep Dive With Dan Sheridan
1 × $31.00
All Weather Butterfly Program - A Deep Dive With Dan Sheridan
1 × $31.00 -
×
 Reading The Tape Trade Series with CompassFX
1 × $10.00
Reading The Tape Trade Series with CompassFX
1 × $10.00 -
×
 Random Walk Trading - J.L.Lord - Option Greeks for Profit
1 × $15.00
Random Walk Trading - J.L.Lord - Option Greeks for Profit
1 × $15.00 -
×
 BigTrends Home Study Course
1 × $6.00
BigTrends Home Study Course
1 × $6.00 -
×
 The Mango Trade 2017
1 × $6.00
The Mango Trade 2017
1 × $6.00 -
×
 Forecast 2024 Clarification with Larry Williams
1 × $15.00
Forecast 2024 Clarification with Larry Williams
1 × $15.00 -
×
 A Day Trading Guide
1 × $54.00
A Day Trading Guide
1 × $54.00 -
×
 Krautgap By John Piper
1 × $6.00
Krautgap By John Piper
1 × $6.00 -
×
 FOREX MASTER TRADING COURSE with BKFOREX
1 × $5.00
FOREX MASTER TRADING COURSE with BKFOREX
1 × $5.00 -
×
 The Best Way to Trade Fibonacci On Demand
1 × $15.00
The Best Way to Trade Fibonacci On Demand
1 × $15.00 -
×
 Pay me in Stock Options with Carol Curtis
1 × $6.00
Pay me in Stock Options with Carol Curtis
1 × $6.00 -
×
 Mastering the Orderbook with Rowan Crawford
1 × $6.00
Mastering the Orderbook with Rowan Crawford
1 × $6.00 -
×
 Wallstreet Trappin with Wallstreet Trapper
1 × $31.00
Wallstreet Trappin with Wallstreet Trapper
1 × $31.00 -
×
 Computerized Trading. Maximizing Day Trading and Overnight Profits with Mark Jurik
1 × $6.00
Computerized Trading. Maximizing Day Trading and Overnight Profits with Mark Jurik
1 × $6.00 -
×
 LT Gamma Confirmation
1 × $23.00
LT Gamma Confirmation
1 × $23.00 -
×
 Futures Trading Blueprint with Day Trader Next Door
1 × $5.00
Futures Trading Blueprint with Day Trader Next Door
1 × $5.00 -
×
 Trade on the Fly
1 × $6.00
Trade on the Fly
1 × $6.00 -
×
 Trading Halls Of Knowledge - Road to Consistent Trading Profits with Jarrod Goodwin
1 × $6.00
Trading Halls Of Knowledge - Road to Consistent Trading Profits with Jarrod Goodwin
1 × $6.00 -
×
 $20 – 52k 20 pips a day challange with Rafał Zuchowicz - TopMasterTrader
1 × $5.00
$20 – 52k 20 pips a day challange with Rafał Zuchowicz - TopMasterTrader
1 × $5.00 -
×
 The Best Option Trading Course with David Jaffee - Best Stock Strategy
1 × $15.00
The Best Option Trading Course with David Jaffee - Best Stock Strategy
1 × $15.00 -
×
 Intra-Day Trading Nasdaq Futures Class with Tony Rago - Theo Trade
1 × $4.00
Intra-Day Trading Nasdaq Futures Class with Tony Rago - Theo Trade
1 × $4.00 -
×
 Flagship Trading Course with Llewelyn James
1 × $23.00
Flagship Trading Course with Llewelyn James
1 × $23.00 -
×
 Intermediate Weekly Calendars
1 × $4.00
Intermediate Weekly Calendars
1 × $4.00 -
×
 Protecting your Retirement Account in a Correction with Dan Sheridan - Sheridan Options Mentoring
1 × $31.00
Protecting your Retirement Account in a Correction with Dan Sheridan - Sheridan Options Mentoring
1 × $31.00 -
×
 Options on Futures Trading Course
1 × $15.00
Options on Futures Trading Course
1 × $15.00 -
×
 Growth Traders Toolbox Course with Julian Komar
1 × $5.00
Growth Traders Toolbox Course with Julian Komar
1 × $5.00 -
×
 Marder Videos Reports 2019 with Kevin Marder
1 × $34.00
Marder Videos Reports 2019 with Kevin Marder
1 × $34.00 -
×
 Learn To Profit From The Forex Market with FX Hustle
1 × $6.00
Learn To Profit From The Forex Market with FX Hustle
1 × $6.00 -
×
 Quantamentals - The Next Great Forefront Of Trading and Investing with Trading Markets
1 × $8.00
Quantamentals - The Next Great Forefront Of Trading and Investing with Trading Markets
1 × $8.00 -
×
 Art of Yen Course (Feb 2014)
1 × $23.00
Art of Yen Course (Feb 2014)
1 × $23.00 -
×
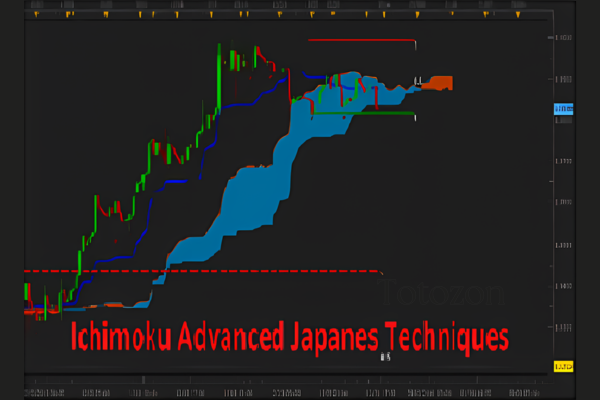 FX At One Glance - Ichimoku Advanced Japanese Techniques
1 × $15.00
FX At One Glance - Ichimoku Advanced Japanese Techniques
1 × $15.00 -
×
 Market Gems Manual with Barbara J.Simon
1 × $6.00
Market Gems Manual with Barbara J.Simon
1 × $6.00 -
×
 Investment Mathematics with Andrew Adams
1 × $6.00
Investment Mathematics with Andrew Adams
1 × $6.00 -
×
 QuickBooks 2003 Official Guide
1 × $6.00
QuickBooks 2003 Official Guide
1 × $6.00 -
×
 Modeling Financial Markets. Using Visual Basic Net & Databases To Create Pricing Trading & Risk Management Models
1 × $6.00
Modeling Financial Markets. Using Visual Basic Net & Databases To Create Pricing Trading & Risk Management Models
1 × $6.00 -
×
 Stonhill Forex 201 Advanced Course
1 × $5.00
Stonhill Forex 201 Advanced Course
1 × $5.00 -
×
 Options Trading & Ultimate MasterClass With Tyrone Abela - FX Evolution
1 × $54.00
Options Trading & Ultimate MasterClass With Tyrone Abela - FX Evolution
1 × $54.00 -
×
 Read the Greed. Take the Money & Teleseminar
1 × $6.00
Read the Greed. Take the Money & Teleseminar
1 × $6.00 -
×
 Security Analysis (The Classic 1934 Ed.) with Benjamin Graham
1 × $6.00
Security Analysis (The Classic 1934 Ed.) with Benjamin Graham
1 × $6.00 -
×
 Weekly Iron Condors For Income with Bruce Wayne
1 × $6.00
Weekly Iron Condors For Income with Bruce Wayne
1 × $6.00 -
×
 You can be a Stock Market Genious with Joel Greenblaat
1 × $6.00
You can be a Stock Market Genious with Joel Greenblaat
1 × $6.00 -
×
 May Madness with LIT Trading
1 × $5.00
May Madness with LIT Trading
1 × $5.00 -
×
 How To Read The Market Professionally with TradeSmart
1 × $27.00
How To Read The Market Professionally with TradeSmart
1 × $27.00 -
×
 Low Stress Options Trading with Low Stress Training
1 × $23.00
Low Stress Options Trading with Low Stress Training
1 × $23.00 -
×
 Smart Money with Chart Engineers
1 × $7.00
Smart Money with Chart Engineers
1 × $7.00 -
×
 Trading to Win with Ari Kiev
1 × $6.00
Trading to Win with Ari Kiev
1 × $6.00 -
×
 Sure Thing Stock Investing with Larry Williams
1 × $6.00
Sure Thing Stock Investing with Larry Williams
1 × $6.00 -
×
 The Orderflow Masterclass with PrimeTrading
1 × $17.00
The Orderflow Masterclass with PrimeTrading
1 × $17.00

Bollinger Bands Trading Strategies That Work
$6.00
File Size: Coming soon!
Delivery Time: 1–12 hours
Media Type: Online Course
Bollinger Bands Trading Strategies That Work
Understanding Bollinger Bands
Bollinger Bands, created by John Bollinger, are one of the most versatile and effective tools in a trader’s arsenal. These bands consist of a middle band (usually a 20-day simple moving average), an upper band (2 standard deviations above the middle band), and a lower band (2 standard deviations below the middle band). They help traders identify overbought and oversold conditions in the market.
How Bollinger Bands Work
The Concept of Volatility
Volatility is a key aspect of Bollinger Bands. The bands expand and contract based on market volatility. When the market is volatile, the bands widen, and when the market is stable, they contract. This behavior makes Bollinger Bands an excellent indicator for anticipating price movements.
The Middle Band
The middle band, which is typically a 20-day simple moving average, serves as the baseline for the upper and lower bands. It represents the average price over a specific period and helps in identifying the overall trend.
The Upper and Lower Bands
The upper and lower bands are set at 2 standard deviations away from the middle band. These bands act as dynamic support and resistance levels, which help traders make informed decisions.
Bollinger Bands Trading Strategies
Strategy 1: Bollinger Bounce
What is the Bollinger Bounce?
The Bollinger Bounce strategy relies on the concept that prices tend to revert to the mean. When the price touches the upper or lower band, it often bounces back towards the middle band.
How to Trade the Bollinger Bounce
- Identify the Touch: Wait for the price to touch the upper or lower band.
- Confirm the Bounce: Look for a reversal candlestick pattern to confirm the bounce.
- Enter the Trade: Enter the trade once the bounce is confirmed, aiming for the middle band as the target.
Strategy 2: Bollinger Squeeze
What is the Bollinger Squeeze?
The Bollinger Squeeze occurs when the bands contract, indicating low volatility. This situation often precedes a significant price movement, making it a great setup for breakout trades.
How to Trade the Bollinger Squeeze
- Identify the Squeeze: Look for the bands to contract tightly.
- Confirm the Breakout: Use additional indicators like the Relative Strength Index (RSI) to confirm the breakout direction.
- Enter the Trade: Enter the trade in the direction of the breakout, placing stop-loss orders just outside the bands.
Strategy 3: Riding the Bands
What is Riding the Bands?
Riding the Bands involves trading with the trend, where the price stays close to the upper or lower band for an extended period.
How to Trade by Riding the Bands
- Identify the Trend: Use the middle band to determine the trend direction.
- Confirm the Trend: Ensure the price consistently touches the upper or lower band without significant pullbacks.
- Enter the Trade: Enter the trade in the direction of the trend, using the opposite band as a trailing stop.
Strategy 4: Bollinger Band Breakouts
What are Bollinger Band Breakouts?
Breakouts occur when the price moves outside the bands, indicating a strong directional movement.
How to Trade Bollinger Band Breakouts
- Identify the Breakout: Look for the price to close outside the bands.
- Confirm the Strength: Use volume indicators to confirm the strength of the breakout.
- Enter the Trade: Enter the trade in the direction of the breakout, setting stop-loss orders within the bands.
Combining Bollinger Bands with Other Indicators
Relative Strength Index (RSI)
Combining Bollinger Bands with the RSI can enhance the reliability of trading signals. The RSI helps confirm overbought or oversold conditions, providing additional context for Bollinger Band signals.
Moving Averages
Using moving averages alongside Bollinger Bands can help in identifying the overall trend. For example, a 50-day moving average can be used to confirm long-term trends.
Volume Indicators
Volume indicators, such as the On-Balance Volume (OBV), can confirm the strength of breakouts and bounces, making them valuable tools in conjunction with Bollinger Bands.
Risk Management in Bollinger Bands Trading
Setting Stop-Loss Orders
Stop-loss orders are crucial in Bollinger Bands trading to manage risk effectively. Place stop-loss orders just outside the bands to minimize losses in case of false signals.
Position Sizing
Proper position sizing ensures that you do not risk too much on a single trade. Use a fixed percentage of your trading capital for each trade to manage risk effectively.
Regular Review and Adjustment
Regularly review your trading strategy and adjust the parameters of the Bollinger Bands to suit changing market conditions. This ongoing adjustment helps in maintaining the effectiveness of the strategy.
Conclusion
Bollinger Bands Trading Strategies are powerful tools for both novice and experienced traders. By understanding the principles behind Bollinger Bands and implementing these strategies, you can enhance your trading performance and achieve consistent results. Remember to combine Bollinger Bands with other indicators, practice risk management, and stay disciplined in your trading approach.
FAQs
What are Bollinger Bands?
Bollinger Bands are a technical analysis tool that consists of a middle band (usually a 20-day simple moving average) and two outer bands set at 2 standard deviations away from the middle band. They help identify overbought and oversold conditions.
How do Bollinger Bands help in trading?
Bollinger Bands help in identifying volatility and potential price reversals. They provide dynamic support and resistance levels, making them useful for various trading strategies.
What is the Bollinger Bounce strategy?
The Bollinger Bounce strategy involves trading based on the idea that prices tend to revert to the mean. When the price touches the upper or lower band, it often bounces back towards the middle band.
Can Bollinger Bands be used with other indicators?
Yes, Bollinger Bands can be combined with indicators like the Relative Strength Index (RSI), moving averages, and volume indicators to enhance the reliability of trading signals.
What is the Bollinger Squeeze?
The Bollinger Squeeze occurs when the bands contract, indicating low volatility. This situation often precedes a significant price movement, making it a great setup for breakout trades.
Be the first to review “Bollinger Bands Trading Strategies That Work”
You must be logged in to post a review.
Related products
Forex Trading
Original price was: $1,898.00.$10.00Current price is: $10.00.

Forex Trading
Original price was: $499.00.$15.00Current price is: $15.00.

Forex Trading
Original price was: $1,098.00.$39.00Current price is: $39.00.

Forex Trading
Original price was: $550.00.$5.00Current price is: $5.00.

Forex Trading
Original price was: $797.00.$10.00Current price is: $10.00.
Forex Trading
Original price was: $125.00.$17.00Current price is: $17.00.

Original price was: $1,200.00.$23.00Current price is: $23.00.

Original price was: $997.00.$8.00Current price is: $8.00.

Forex Trading
Original price was: $697.00.$5.00Current price is: $5.00.

Original price was: $450.00.$23.00Current price is: $23.00.
Forex Trading
Quantamentals – The Next Great Forefront Of Trading and Investing with Trading Markets
Original price was: $1,495.00.$8.00Current price is: $8.00.

Forex Trading
Original price was: $2,995.00.$31.00Current price is: $31.00.

Original price was: $649.00.$20.00Current price is: $20.00.
Forex Trading
Original price was: $249.00.$15.00Current price is: $15.00.

Forex Trading
Original price was: $239.00.$8.00Current price is: $8.00.

Forex Trading
Original price was: $799.00.$15.00Current price is: $15.00.

Original price was: $310.00.$23.00Current price is: $23.00.
Forex Trading
Original price was: $500.00.$5.00Current price is: $5.00.

Forex Trading
Original price was: $850.00.$23.00Current price is: $23.00.

Forex Trading
Original price was: $2,997.00.$23.00Current price is: $23.00.
Reviews
There are no reviews yet.