-
×
 Ultimate Trading Course with Dodgy's Dungeon
1 × $8.00
Ultimate Trading Course with Dodgy's Dungeon
1 × $8.00 -
×
 Deep Dive Butterfly Trading Strategy Class with SJG Trades
1 × $41.00
Deep Dive Butterfly Trading Strategy Class with SJG Trades
1 × $41.00 -
×
 AI For Traders with Trading Markets
1 × $31.00
AI For Traders with Trading Markets
1 × $31.00 -
×
 TRADING NFX Course with Andrew NFX
1 × $5.00
TRADING NFX Course with Andrew NFX
1 × $5.00 -
×
 Algo Trading Masterclass with Ali Casey - StatOasis
1 × $23.00
Algo Trading Masterclass with Ali Casey - StatOasis
1 × $23.00 -
×
 The Orderflows Trade Opportunities Encyclopedia with Michael Valtos
1 × $8.00
The Orderflows Trade Opportunities Encyclopedia with Michael Valtos
1 × $8.00 -
×
 Best of the Best: Collars with Amy Meissner & Scott Ruble
1 × $15.00
Best of the Best: Collars with Amy Meissner & Scott Ruble
1 × $15.00 -
×
 WondaFX Signature Strategy with WondaFX
1 × $5.00
WondaFX Signature Strategy with WondaFX
1 × $5.00 -
×
 The Naked Eye: Raw Data Analytics with Edgar Torres - Raw Data Analytics
1 × $8.00
The Naked Eye: Raw Data Analytics with Edgar Torres - Raw Data Analytics
1 × $8.00 -
×
 High Probability Trading Using Elliott Wave And Fibonacci Analysis withVic Patel - Forex Training Group
1 × $10.00
High Probability Trading Using Elliott Wave And Fibonacci Analysis withVic Patel - Forex Training Group
1 × $10.00 -
×
 Tandem Trader with Investors Underground
1 × $6.00
Tandem Trader with Investors Underground
1 × $6.00 -
×
 James Dalton Mind Over Markets Expanded Intensive Series 2018
1 × $6.00
James Dalton Mind Over Markets Expanded Intensive Series 2018
1 × $6.00 -
×
 Avoiding Trading Mistakes with Mark D.Cook
1 × $6.00
Avoiding Trading Mistakes with Mark D.Cook
1 × $6.00 -
×
 The Big 3 Squeeze Indicator TOS 2024 with Taylor Horton
1 × $69.00
The Big 3 Squeeze Indicator TOS 2024 with Taylor Horton
1 × $69.00 -
×
 TradeCraft: Your Path to Peak Performance Trading By Adam Grimes
1 × $15.00
TradeCraft: Your Path to Peak Performance Trading By Adam Grimes
1 × $15.00 -
×
 ICT Prodigy Trading Course – $650K in Payouts with Alex Solignani
1 × $15.00
ICT Prodigy Trading Course – $650K in Payouts with Alex Solignani
1 × $15.00 -
×
 The Trading Blueprint with Brad Goh - The Trading Geek
1 × $5.00
The Trading Blueprint with Brad Goh - The Trading Geek
1 × $5.00 -
×
 W. D Gann 's Square Of 9 Applied To Modern Markets with Sean Avidar - Hexatrade350
1 × $23.00
W. D Gann 's Square Of 9 Applied To Modern Markets with Sean Avidar - Hexatrade350
1 × $23.00 -
×
 The Aime Workshop with Clay Marafiote
1 × $6.00
The Aime Workshop with Clay Marafiote
1 × $6.00 -
×
 May Madness with LIT Trading
1 × $5.00
May Madness with LIT Trading
1 × $5.00 -
×
 Yin Yang Forex Training Program
1 × $85.00
Yin Yang Forex Training Program
1 × $85.00 -
×
 Intermediate Weekly Calendars
1 × $4.00
Intermediate Weekly Calendars
1 × $4.00 -
×
 Kaizen On-Demand By Candle Charts
1 × $6.00
Kaizen On-Demand By Candle Charts
1 × $6.00 -
×
 Module 1 & 2 Swing Trading Forex and Financial Futures with Trader Dante
1 × $15.00
Module 1 & 2 Swing Trading Forex and Financial Futures with Trader Dante
1 × $15.00 -
×
 Overnight Trading with Nightly Patterns
1 × $5.00
Overnight Trading with Nightly Patterns
1 × $5.00 -
×
 Options Plain & Simple with Lenni Jordan
1 × $6.00
Options Plain & Simple with Lenni Jordan
1 × $6.00 -
×
 Trade Execution with Yuri Shramenko
1 × $6.00
Trade Execution with Yuri Shramenko
1 × $6.00 -
×
 Price Action and Orderflow Course with Young Tilopa
1 × $17.00
Price Action and Orderflow Course with Young Tilopa
1 × $17.00 -
×
 Day Trading Systems & Methods with Charles Le Beau, David Lucas
1 × $6.00
Day Trading Systems & Methods with Charles Le Beau, David Lucas
1 × $6.00 -
×
 Triple Play Trading Ideas & Mentoring with MarketGauge
1 × $54.00
Triple Play Trading Ideas & Mentoring with MarketGauge
1 × $54.00 -
×
 Opportunity Investing with Gerald Appel
1 × $6.00
Opportunity Investing with Gerald Appel
1 × $6.00 -
×
 The C3PO Forex Trading Strategy with Jared Passey
1 × $4.00
The C3PO Forex Trading Strategy with Jared Passey
1 × $4.00 -
×
 Long-Term Secrets to Short-Term Trading (Ebook) with Larry Williams
1 × $6.00
Long-Term Secrets to Short-Term Trading (Ebook) with Larry Williams
1 × $6.00 -
×
 FOREX STRATEGY #1 with Steven Primo
1 × $39.00
FOREX STRATEGY #1 with Steven Primo
1 × $39.00 -
×
 Dynamic Trader 6 Dynamic Trader Real Time and End Of Day
1 × $6.00
Dynamic Trader 6 Dynamic Trader Real Time and End Of Day
1 × $6.00 -
×
 Stock Trader`s Almanac 2012 with Jeffrey Hirsch & Yale Hirsch
1 × $6.00
Stock Trader`s Almanac 2012 with Jeffrey Hirsch & Yale Hirsch
1 × $6.00 -
×
 Symmetry Wave Theory with Michael Gur
1 × $6.00
Symmetry Wave Theory with Michael Gur
1 × $6.00 -
×
 Mastering Candlestick Charts II with Greg Capra
1 × $6.00
Mastering Candlestick Charts II with Greg Capra
1 × $6.00 -
×
 Dynamic Trading Indicators with Mark W.Helweg, David C.Stendahl
1 × $6.00
Dynamic Trading Indicators with Mark W.Helweg, David C.Stendahl
1 × $6.00 -
×
 A Bull in China with Jim Rogers
1 × $6.00
A Bull in China with Jim Rogers
1 × $6.00 -
×
 Commodity Options: Trading and Hedging Volatility in the World’s Most Lucrative Market with Carley Garner & Paul Brittain
1 × $6.00
Commodity Options: Trading and Hedging Volatility in the World’s Most Lucrative Market with Carley Garner & Paul Brittain
1 × $6.00 -
×
 The Six Sigma Handbook with Thomas Pyzdek
1 × $6.00
The Six Sigma Handbook with Thomas Pyzdek
1 × $6.00 -
×
 Trading Option Greeks with Dan Passarelli
1 × $6.00
Trading Option Greeks with Dan Passarelli
1 × $6.00 -
×
 Four Steps to Trading Economic Indicators
1 × $6.00
Four Steps to Trading Economic Indicators
1 × $6.00 -
×
 Accumulation & Distribution with Larry Williams
1 × $4.00
Accumulation & Distribution with Larry Williams
1 × $4.00 -
×
 Manage the Greeks & the Risk of ODTE & 1-4 day Trades for October 2023 with Sheridan Options Mentoring
1 × $85.00
Manage the Greeks & the Risk of ODTE & 1-4 day Trades for October 2023 with Sheridan Options Mentoring
1 × $85.00 -
×
 Leading Indicators
1 × $23.00
Leading Indicators
1 × $23.00 -
×
 Vaga Academy with VAGAFX
1 × $5.00
Vaga Academy with VAGAFX
1 × $5.00 -
×
 Hit and Run Trading Updated Version with Jeff Cooper
1 × $6.00
Hit and Run Trading Updated Version with Jeff Cooper
1 × $6.00 -
×
 Trading Mastery Course 2009
1 × $6.00
Trading Mastery Course 2009
1 × $6.00 -
×
 ePass Platinum
1 × $31.00
ePass Platinum
1 × $31.00 -
×
 90 Minute Cycle withThe Algo Trader
1 × $5.00
90 Minute Cycle withThe Algo Trader
1 × $5.00 -
×
 The Best of the Professional Traders Journal: Day Trading with Larry Connors
1 × $6.00
The Best of the Professional Traders Journal: Day Trading with Larry Connors
1 × $6.00 -
×
 Pips&Profit Trading Course
1 × $13.00
Pips&Profit Trading Course
1 × $13.00 -
×
 Futures Foundation Program with SMS Capital
1 × $101.00
Futures Foundation Program with SMS Capital
1 × $101.00 -
×
 Tom Williams Final Mentorship Course
1 × $6.00
Tom Williams Final Mentorship Course
1 × $6.00 -
×
 Order flow self-study training program with iMFtracker
1 × $10.00
Order flow self-study training program with iMFtracker
1 × $10.00 -
×
 Protecting your Retirement Account in a Correction with Dan Sheridan - Sheridan Options Mentoring
1 × $31.00
Protecting your Retirement Account in a Correction with Dan Sheridan - Sheridan Options Mentoring
1 × $31.00 -
×
 JJ Dream Team Workshop Training Full Course
1 × $55.00
JJ Dream Team Workshop Training Full Course
1 × $55.00 -
×
 Level 1 - Japanese Candlesticks Trading Mastery Program with Rohit Musale & Rashmi Musale
1 × $5.00
Level 1 - Japanese Candlesticks Trading Mastery Program with Rohit Musale & Rashmi Musale
1 × $5.00 -
×
 The Blueprint Course 2.0 with Mike Anderson
1 × $17.00
The Blueprint Course 2.0 with Mike Anderson
1 × $17.00 -
×
 Bird Watch in Lion Country 2010 Ed with Dirk Du Toit
1 × $6.00
Bird Watch in Lion Country 2010 Ed with Dirk Du Toit
1 × $6.00 -
×
 Crypto Trading Academy with Cheeky Investor - Aussie Day Trader
1 × $13.00
Crypto Trading Academy with Cheeky Investor - Aussie Day Trader
1 × $13.00 -
×
 ITPM Professional Trading Masterclass (PTM) V2.0 with Anton Kreil
1 × $6.00
ITPM Professional Trading Masterclass (PTM) V2.0 with Anton Kreil
1 × $6.00 -
×
 Mastering the Stock Market with Andrew Baxter
1 × $6.00
Mastering the Stock Market with Andrew Baxter
1 × $6.00 -
×
 Options Trading Training. The Blend SF with Charles Cottle
1 × $6.00
Options Trading Training. The Blend SF with Charles Cottle
1 × $6.00 -
×
 CalendarMAX with Hari Swaminathan
1 × $15.00
CalendarMAX with Hari Swaminathan
1 × $15.00 -
×
 Tick Trader Day Trading Course with David Marsh
1 × $6.00
Tick Trader Day Trading Course with David Marsh
1 × $6.00 -
×
 White Phoenix’s The Smart (Money) Approach to Trading with Jayson Casper
1 × $39.00
White Phoenix’s The Smart (Money) Approach to Trading with Jayson Casper
1 × $39.00 -
×
 4D Bootcamp with Black Rabbit
1 × $10.00
4D Bootcamp with Black Rabbit
1 × $10.00 -
×
 Options, Futures & Other Derivatives (5th Ed.)
1 × $6.00
Options, Futures & Other Derivatives (5th Ed.)
1 × $6.00 -
×
 Market Profile Course
1 × $54.00
Market Profile Course
1 × $54.00 -
×
 FOREX GENERATION MASTER COURSE
1 × $6.00
FOREX GENERATION MASTER COURSE
1 × $6.00 -
×
 One Shot One Kill Trading with John Netto
1 × $6.00
One Shot One Kill Trading with John Netto
1 × $6.00 -
×
 Wysetrade Forex Masterclass 3.0
1 × $6.00
Wysetrade Forex Masterclass 3.0
1 × $6.00

Bollinger Bands Trading Strategies That Work
$6.00
File Size: Coming soon!
Delivery Time: 1–12 hours
Media Type: Online Course
Bollinger Bands Trading Strategies That Work
Understanding Bollinger Bands
Bollinger Bands, created by John Bollinger, are one of the most versatile and effective tools in a trader’s arsenal. These bands consist of a middle band (usually a 20-day simple moving average), an upper band (2 standard deviations above the middle band), and a lower band (2 standard deviations below the middle band). They help traders identify overbought and oversold conditions in the market.
How Bollinger Bands Work
The Concept of Volatility
Volatility is a key aspect of Bollinger Bands. The bands expand and contract based on market volatility. When the market is volatile, the bands widen, and when the market is stable, they contract. This behavior makes Bollinger Bands an excellent indicator for anticipating price movements.
The Middle Band
The middle band, which is typically a 20-day simple moving average, serves as the baseline for the upper and lower bands. It represents the average price over a specific period and helps in identifying the overall trend.
The Upper and Lower Bands
The upper and lower bands are set at 2 standard deviations away from the middle band. These bands act as dynamic support and resistance levels, which help traders make informed decisions.
Bollinger Bands Trading Strategies
Strategy 1: Bollinger Bounce
What is the Bollinger Bounce?
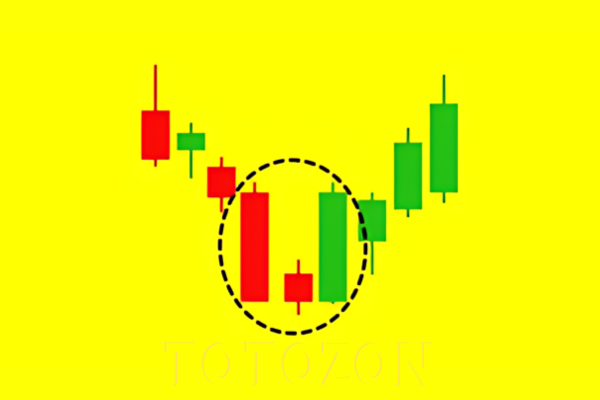
The Bollinger Bounce strategy relies on the concept that prices tend to revert to the mean. When the price touches the upper or lower band, it often bounces back towards the middle band.
How to Trade the Bollinger Bounce
- Identify the Touch: Wait for the price to touch the upper or lower band.
- Confirm the Bounce: Look for a reversal candlestick pattern to confirm the bounce.
- Enter the Trade: Enter the trade once the bounce is confirmed, aiming for the middle band as the target.
Strategy 2: Bollinger Squeeze
What is the Bollinger Squeeze?
The Bollinger Squeeze occurs when the bands contract, indicating low volatility. This situation often precedes a significant price movement, making it a great setup for breakout trades.
How to Trade the Bollinger Squeeze
- Identify the Squeeze: Look for the bands to contract tightly.
- Confirm the Breakout: Use additional indicators like the Relative Strength Index (RSI) to confirm the breakout direction.
- Enter the Trade: Enter the trade in the direction of the breakout, placing stop-loss orders just outside the bands.
Strategy 3: Riding the Bands
What is Riding the Bands?
Riding the Bands involves trading with the trend, where the price stays close to the upper or lower band for an extended period.
How to Trade by Riding the Bands
- Identify the Trend: Use the middle band to determine the trend direction.
- Confirm the Trend: Ensure the price consistently touches the upper or lower band without significant pullbacks.
- Enter the Trade: Enter the trade in the direction of the trend, using the opposite band as a trailing stop.
Strategy 4: Bollinger Band Breakouts
What are Bollinger Band Breakouts?
Breakouts occur when the price moves outside the bands, indicating a strong directional movement.
How to Trade Bollinger Band Breakouts
- Identify the Breakout: Look for the price to close outside the bands.
- Confirm the Strength: Use volume indicators to confirm the strength of the breakout.
- Enter the Trade: Enter the trade in the direction of the breakout, setting stop-loss orders within the bands.
Combining Bollinger Bands with Other Indicators
Relative Strength Index (RSI)
Combining Bollinger Bands with the RSI can enhance the reliability of trading signals. The RSI helps confirm overbought or oversold conditions, providing additional context for Bollinger Band signals.
Moving Averages
Using moving averages alongside Bollinger Bands can help in identifying the overall trend. For example, a 50-day moving average can be used to confirm long-term trends.
Volume Indicators
Volume indicators, such as the On-Balance Volume (OBV), can confirm the strength of breakouts and bounces, making them valuable tools in conjunction with Bollinger Bands.
Risk Management in Bollinger Bands Trading
Setting Stop-Loss Orders
Stop-loss orders are crucial in Bollinger Bands trading to manage risk effectively. Place stop-loss orders just outside the bands to minimize losses in case of false signals.
Position Sizing
Proper position sizing ensures that you do not risk too much on a single trade. Use a fixed percentage of your trading capital for each trade to manage risk effectively.
Regular Review and Adjustment
Regularly review your trading strategy and adjust the parameters of the Bollinger Bands to suit changing market conditions. This ongoing adjustment helps in maintaining the effectiveness of the strategy.
Conclusion
Bollinger Bands Trading Strategies are powerful tools for both novice and experienced traders. By understanding the principles behind Bollinger Bands and implementing these strategies, you can enhance your trading performance and achieve consistent results. Remember to combine Bollinger Bands with other indicators, practice risk management, and stay disciplined in your trading approach.
FAQs
What are Bollinger Bands?
Bollinger Bands are a technical analysis tool that consists of a middle band (usually a 20-day simple moving average) and two outer bands set at 2 standard deviations away from the middle band. They help identify overbought and oversold conditions.
How do Bollinger Bands help in trading?
Bollinger Bands help in identifying volatility and potential price reversals. They provide dynamic support and resistance levels, making them useful for various trading strategies.
What is the Bollinger Bounce strategy?
The Bollinger Bounce strategy involves trading based on the idea that prices tend to revert to the mean. When the price touches the upper or lower band, it often bounces back towards the middle band.
Can Bollinger Bands be used with other indicators?
Yes, Bollinger Bands can be combined with indicators like the Relative Strength Index (RSI), moving averages, and volume indicators to enhance the reliability of trading signals.
What is the Bollinger Squeeze?
The Bollinger Squeeze occurs when the bands contract, indicating low volatility. This situation often precedes a significant price movement, making it a great setup for breakout trades.
Be the first to review “Bollinger Bands Trading Strategies That Work”
You must be logged in to post a review.
Related products
Original price was: $700.00.$39.00Current price is: $39.00.
Forex Trading
Original price was: $797.00.$10.00Current price is: $10.00.
Forex Trading
Original price was: $2,000.00.$23.00Current price is: $23.00.
Forex Trading
Original price was: $500.00.$5.00Current price is: $5.00.

Original price was: $895.00.$15.00Current price is: $15.00.

Original price was: $497.00.$11.00Current price is: $11.00.

Original price was: $310.00.$23.00Current price is: $23.00.
Forex Trading
Original price was: $1,898.00.$10.00Current price is: $10.00.
Original price was: $799.00.$15.00Current price is: $15.00.
Forex Trading
Original price was: $550.00.$5.00Current price is: $5.00.

Forex Trading
Original price was: $999.00.$15.00Current price is: $15.00.

Forex Trading
Quantamentals – The Next Great Forefront Of Trading and Investing with Trading Markets
Original price was: $1,495.00.$8.00Current price is: $8.00.
Original price was: $139.00.$23.00Current price is: $23.00.
Forex Trading
Original price was: $2,995.00.$31.00Current price is: $31.00.

Forex Trading
Original price was: $249.00.$15.00Current price is: $15.00.

Original price was: $649.00.$20.00Current price is: $20.00.
Forex Trading
Original price was: $239.00.$8.00Current price is: $8.00.
Original price was: $2,120.00.$15.00Current price is: $15.00.

Forex Trading
Original price was: $850.00.$23.00Current price is: $23.00.

Original price was: $450.00.$23.00Current price is: $23.00.
Reviews
There are no reviews yet.