-
×
 Elite Mentorship Home Study - 3T Live with Sami Abusaad
1 × $5.00
Elite Mentorship Home Study - 3T Live with Sami Abusaad
1 × $5.00 -
×
 Pattern Cycles with Alan Farley
1 × $6.00
Pattern Cycles with Alan Farley
1 × $6.00 -
×
 MATS Market Auction Trading System with Ryan Watts
1 × $6.00
MATS Market Auction Trading System with Ryan Watts
1 × $6.00 -
×
 Professional Level Trading (IPLT) Online Video Series with Anton Kreil
1 × $6.00
Professional Level Trading (IPLT) Online Video Series with Anton Kreil
1 × $6.00 -
×
 Football Hedging System with Tony Langley
1 × $54.00
Football Hedging System with Tony Langley
1 × $54.00 -
×
 Inside the Mind of Trader Stewie - Art of Trading
1 × $23.00
Inside the Mind of Trader Stewie - Art of Trading
1 × $23.00 -
×
 How Do You See Risk? A Guide to Evaluating & Applying Technical Volatility Indicators class with Jeff Bierman
1 × $6.00
How Do You See Risk? A Guide to Evaluating & Applying Technical Volatility Indicators class with Jeff Bierman
1 × $6.00 -
×
 Money Miracle: Use Other Peoples Money to Make You Rich with George Angell
1 × $6.00
Money Miracle: Use Other Peoples Money to Make You Rich with George Angell
1 × $6.00 -
×
 How to Trade Better with Larry Williams
1 × $6.00
How to Trade Better with Larry Williams
1 × $6.00 -
×
 Out of the Pits with Caitlin Zaloom
1 × $6.00
Out of the Pits with Caitlin Zaloom
1 × $6.00 -
×
 Technical Analysis Applications in the Global Currency Markets (2nd Ed.) with Cornelius Luca
1 × $6.00
Technical Analysis Applications in the Global Currency Markets (2nd Ed.) with Cornelius Luca
1 × $6.00 -
×
 ICT Mentorship – 2019
1 × $13.00
ICT Mentorship – 2019
1 × $13.00 -
×
 Market Makers Method Forex Trading with Nick Nechanicky
1 × $5.00
Market Makers Method Forex Trading with Nick Nechanicky
1 × $5.00 -
×
 Investing Classroom 2022 with Danny Devan
1 × $15.00
Investing Classroom 2022 with Danny Devan
1 × $15.00 -
×
 Day Trade Online (2nd Ed.) with Christopher Farrell
1 × $6.00
Day Trade Online (2nd Ed.) with Christopher Farrell
1 × $6.00 -
×
 ShredderFX Compete Courses & Indicators
1 × $6.00
ShredderFX Compete Courses & Indicators
1 × $6.00 -
×
 Flux Investor Package v2.2.1, (Jan 2016) with Back To The Future Trading
1 × $85.00
Flux Investor Package v2.2.1, (Jan 2016) with Back To The Future Trading
1 × $85.00 -
×
 Forex Retracement Theory with CopperChips
1 × $6.00
Forex Retracement Theory with CopperChips
1 × $6.00 -
×
 Earnings Power Play with Dave Aquino
1 × $15.00
Earnings Power Play with Dave Aquino
1 × $15.00 -
×
 Sacredscience - Paul Councel – X Marks My Place
1 × $6.00
Sacredscience - Paul Councel – X Marks My Place
1 × $6.00 -
×
 Raghee’s Winners Circle Course
1 × $6.00
Raghee’s Winners Circle Course
1 × $6.00 -
×
 Romeo’s University of Turtle Soup with Romeo
1 × $6.00
Romeo’s University of Turtle Soup with Romeo
1 × $6.00 -
×
 Optimize Funding Program with Solo Network
1 × $5.00
Optimize Funding Program with Solo Network
1 × $5.00 -
×
 Evolutionary Decision Trees for Stock Index Options and Futures Arbitrage by S.Markose, E.Tsang,H.Er
1 × $6.00
Evolutionary Decision Trees for Stock Index Options and Futures Arbitrage by S.Markose, E.Tsang,H.Er
1 × $6.00 -
×
 Online Course - Why Wave Analysis Belongs in Every Trader's Toolbox with Jeffrey Kennedy - Elliott Wave
1 × $15.00
Online Course - Why Wave Analysis Belongs in Every Trader's Toolbox with Jeffrey Kennedy - Elliott Wave
1 × $15.00 -
×
 Options for Long Term Trading & Hedging with Option Pit
1 × $39.00
Options for Long Term Trading & Hedging with Option Pit
1 × $39.00 -
×
 Market Mindfields - 2 DVDs with Ryan Litchfield
1 × $6.00
Market Mindfields - 2 DVDs with Ryan Litchfield
1 × $6.00 -
×
 Price Action Trading Volume 1 with Fractal Flow Pro
1 × $6.00
Price Action Trading Volume 1 with Fractal Flow Pro
1 × $6.00 -
×
 Get 95% Win Rate With The Triple Candy Method - Eden
1 × $5.00
Get 95% Win Rate With The Triple Candy Method - Eden
1 × $5.00 -
×
 Marus FX 2023
1 × $5.00
Marus FX 2023
1 × $5.00 -
×
 Options University - Ron Ianieri – The Option Pricing Model
1 × $6.00
Options University - Ron Ianieri – The Option Pricing Model
1 × $6.00 -
×
 Mutual Funds: Fifty Years of Research Findings by Seth C. Anderson
1 × $6.00
Mutual Funds: Fifty Years of Research Findings by Seth C. Anderson
1 × $6.00 -
×
 Part I Basic and Part II Beyond the Basic with Strategic Trading
1 × $6.00
Part I Basic and Part II Beyond the Basic with Strategic Trading
1 × $6.00 -
×
 Predicting Next Weeks’s Range with Charles Drummond
1 × $6.00
Predicting Next Weeks’s Range with Charles Drummond
1 × $6.00 -
×
 HYDRA 3 Day Bootcamp
1 × $5.00
HYDRA 3 Day Bootcamp
1 × $5.00 -
×
 Foundational Chart Analysis Series: Support / Resistance Techniques of Professional Traders 6 DVD Home Study Course
1 × $54.00
Foundational Chart Analysis Series: Support / Resistance Techniques of Professional Traders 6 DVD Home Study Course
1 × $54.00 -
×
 Pristine - Cardinal Rules of Trading
1 × $6.00
Pristine - Cardinal Rules of Trading
1 × $6.00 -
×
 Jim Rickards Intelligence Triggers with Agora Financial
1 × $5.00
Jim Rickards Intelligence Triggers with Agora Financial
1 × $5.00 -
×
 The EAP Training Program (Apr 2019)
1 × $6.00
The EAP Training Program (Apr 2019)
1 × $6.00 -
×
 The Game In WallStreet & How to Play it Successfully with Hoyle
1 × $6.00
The Game In WallStreet & How to Play it Successfully with Hoyle
1 × $6.00 -
×
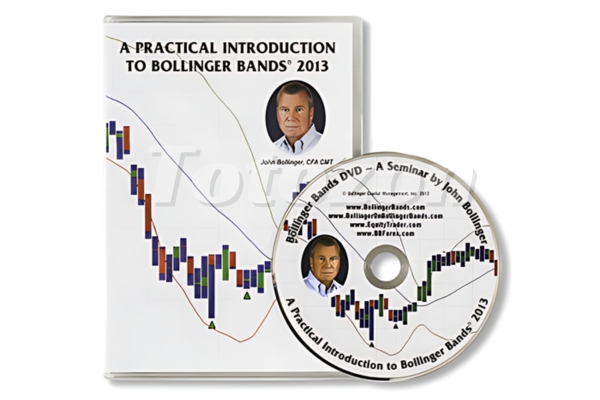 Practical Introduction to Bollinger Bands 2013
1 × $6.00
Practical Introduction to Bollinger Bands 2013
1 × $6.00 -
×
 RTM + Suppy and Demand with Nora Bystra
1 × $6.00
RTM + Suppy and Demand with Nora Bystra
1 × $6.00 -
×
 RVM Secrets with Sam Bart
1 × $23.00
RVM Secrets with Sam Bart
1 × $23.00 -
×
 Precise Planetary Timing for Stock Trading
1 × $6.00
Precise Planetary Timing for Stock Trading
1 × $6.00 -
×
 Option Hydra - Mar 2020 Edition - Basics with Rajandran R
1 × $23.00
Option Hydra - Mar 2020 Edition - Basics with Rajandran R
1 × $23.00 -
×
 Practical Astro with Ruth Miller & Iam Williams
1 × $6.00
Practical Astro with Ruth Miller & Iam Williams
1 × $6.00 -
×
 Metals Webinar
1 × $6.00
Metals Webinar
1 × $6.00 -
×
 Get to know the VIX Index (aka The Fear Index)
1 × $15.00
Get to know the VIX Index (aka The Fear Index)
1 × $15.00 -
×
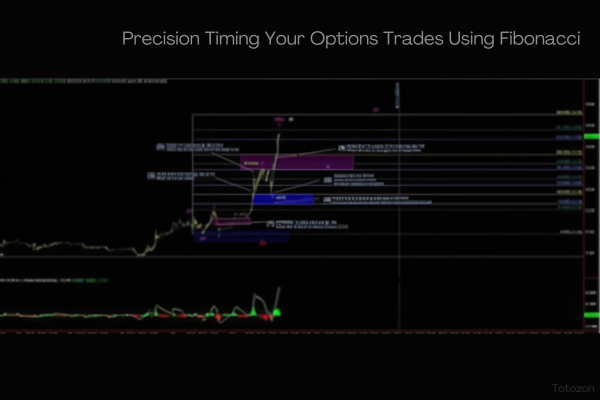 Precision Timing Your Options Trades Using Fibonacci with Trading Analysis
1 × $15.00
Precision Timing Your Options Trades Using Fibonacci with Trading Analysis
1 × $15.00 -
×
 Freak Forex Fundamentals with Ken FX Freak
1 × $6.00
Freak Forex Fundamentals with Ken FX Freak
1 × $6.00 -
×
 FTMO Academy Course
1 × $5.00
FTMO Academy Course
1 × $5.00 -
×
 ETFs for the Long Run: What They Are, How They Work, and Simple Strategies for Successful Long-Term Investing - Lawrence Carrel
1 × $6.00
ETFs for the Long Run: What They Are, How They Work, and Simple Strategies for Successful Long-Term Investing - Lawrence Carrel
1 × $6.00 -
×
 Extreme Events: Robust Portfolio Construction in the Presence of Fat Tails with Malcolm Kemp
1 × $6.00
Extreme Events: Robust Portfolio Construction in the Presence of Fat Tails with Malcolm Kemp
1 × $6.00 -
×
 Japanese Trading Systems with Tradesmart University
1 × $9.00
Japanese Trading Systems with Tradesmart University
1 × $9.00 -
×
 HEDGED STRATEGY SERIES IN VOLATILE MARKETS – HEDGED CREDIT SPREADS - Dan Sheridan
1 × $6.00
HEDGED STRATEGY SERIES IN VOLATILE MARKETS – HEDGED CREDIT SPREADS - Dan Sheridan
1 × $6.00 -
×
 Technical Timing Patterns
1 × $6.00
Technical Timing Patterns
1 × $6.00 -
×
 Naked Forex: High-Probability Techniques for Trading Without Indicators (2012) with Alex Nekritin & Walter Peters
1 × $6.00
Naked Forex: High-Probability Techniques for Trading Without Indicators (2012) with Alex Nekritin & Walter Peters
1 × $6.00 -
×
 FXStreet Unrecorded Webinars Sept & Oct, 2011 with Sam Seiden
1 × $6.00
FXStreet Unrecorded Webinars Sept & Oct, 2011 with Sam Seiden
1 × $6.00 -
×
 Hedges on Hedge Funds: How to Successfully Analyze and Select an Investment with James Hedges
1 × $6.00
Hedges on Hedge Funds: How to Successfully Analyze and Select an Investment with James Hedges
1 × $6.00 -
×
 The Indices Orderflow Masterclass with The Forex Scalpers
1 × $23.00
The Indices Orderflow Masterclass with The Forex Scalpers
1 × $23.00

Bollinger Bands Trading Strategies That Work
$6.00
File Size: Coming soon!
Delivery Time: 1–12 hours
Media Type: Online Course
Bollinger Bands Trading Strategies That Work
Understanding Bollinger Bands
Bollinger Bands, created by John Bollinger, are one of the most versatile and effective tools in a trader’s arsenal. These bands consist of a middle band (usually a 20-day simple moving average), an upper band (2 standard deviations above the middle band), and a lower band (2 standard deviations below the middle band). They help traders identify overbought and oversold conditions in the market.
How Bollinger Bands Work
The Concept of Volatility
Volatility is a key aspect of Bollinger Bands. The bands expand and contract based on market volatility. When the market is volatile, the bands widen, and when the market is stable, they contract. This behavior makes Bollinger Bands an excellent indicator for anticipating price movements.
The Middle Band
The middle band, which is typically a 20-day simple moving average, serves as the baseline for the upper and lower bands. It represents the average price over a specific period and helps in identifying the overall trend.
The Upper and Lower Bands
The upper and lower bands are set at 2 standard deviations away from the middle band. These bands act as dynamic support and resistance levels, which help traders make informed decisions.
Bollinger Bands Trading Strategies
Strategy 1: Bollinger Bounce
What is the Bollinger Bounce?
The Bollinger Bounce strategy relies on the concept that prices tend to revert to the mean. When the price touches the upper or lower band, it often bounces back towards the middle band.
How to Trade the Bollinger Bounce
- Identify the Touch: Wait for the price to touch the upper or lower band.
- Confirm the Bounce: Look for a reversal candlestick pattern to confirm the bounce.
- Enter the Trade: Enter the trade once the bounce is confirmed, aiming for the middle band as the target.
Strategy 2: Bollinger Squeeze
What is the Bollinger Squeeze?
The Bollinger Squeeze occurs when the bands contract, indicating low volatility. This situation often precedes a significant price movement, making it a great setup for breakout trades.
How to Trade the Bollinger Squeeze
- Identify the Squeeze: Look for the bands to contract tightly.
- Confirm the Breakout: Use additional indicators like the Relative Strength Index (RSI) to confirm the breakout direction.
- Enter the Trade: Enter the trade in the direction of the breakout, placing stop-loss orders just outside the bands.
Strategy 3: Riding the Bands
What is Riding the Bands?
Riding the Bands involves trading with the trend, where the price stays close to the upper or lower band for an extended period.
How to Trade by Riding the Bands
- Identify the Trend: Use the middle band to determine the trend direction.
- Confirm the Trend: Ensure the price consistently touches the upper or lower band without significant pullbacks.
- Enter the Trade: Enter the trade in the direction of the trend, using the opposite band as a trailing stop.
Strategy 4: Bollinger Band Breakouts
What are Bollinger Band Breakouts?
Breakouts occur when the price moves outside the bands, indicating a strong directional movement.
How to Trade Bollinger Band Breakouts
- Identify the Breakout: Look for the price to close outside the bands.
- Confirm the Strength: Use volume indicators to confirm the strength of the breakout.
- Enter the Trade: Enter the trade in the direction of the breakout, setting stop-loss orders within the bands.
Combining Bollinger Bands with Other Indicators
Relative Strength Index (RSI)
Combining Bollinger Bands with the RSI can enhance the reliability of trading signals. The RSI helps confirm overbought or oversold conditions, providing additional context for Bollinger Band signals.
Moving Averages
Using moving averages alongside Bollinger Bands can help in identifying the overall trend. For example, a 50-day moving average can be used to confirm long-term trends.
Volume Indicators
Volume indicators, such as the On-Balance Volume (OBV), can confirm the strength of breakouts and bounces, making them valuable tools in conjunction with Bollinger Bands.
Risk Management in Bollinger Bands Trading
Setting Stop-Loss Orders
Stop-loss orders are crucial in Bollinger Bands trading to manage risk effectively. Place stop-loss orders just outside the bands to minimize losses in case of false signals.
Position Sizing
Proper position sizing ensures that you do not risk too much on a single trade. Use a fixed percentage of your trading capital for each trade to manage risk effectively.
Regular Review and Adjustment
Regularly review your trading strategy and adjust the parameters of the Bollinger Bands to suit changing market conditions. This ongoing adjustment helps in maintaining the effectiveness of the strategy.
Conclusion
Bollinger Bands Trading Strategies are powerful tools for both novice and experienced traders. By understanding the principles behind Bollinger Bands and implementing these strategies, you can enhance your trading performance and achieve consistent results. Remember to combine Bollinger Bands with other indicators, practice risk management, and stay disciplined in your trading approach.
FAQs
What are Bollinger Bands?
Bollinger Bands are a technical analysis tool that consists of a middle band (usually a 20-day simple moving average) and two outer bands set at 2 standard deviations away from the middle band. They help identify overbought and oversold conditions.
How do Bollinger Bands help in trading?
Bollinger Bands help in identifying volatility and potential price reversals. They provide dynamic support and resistance levels, making them useful for various trading strategies.
What is the Bollinger Bounce strategy?
The Bollinger Bounce strategy involves trading based on the idea that prices tend to revert to the mean. When the price touches the upper or lower band, it often bounces back towards the middle band.
Can Bollinger Bands be used with other indicators?
Yes, Bollinger Bands can be combined with indicators like the Relative Strength Index (RSI), moving averages, and volume indicators to enhance the reliability of trading signals.
What is the Bollinger Squeeze?
The Bollinger Squeeze occurs when the bands contract, indicating low volatility. This situation often precedes a significant price movement, making it a great setup for breakout trades.
Be the first to review “Bollinger Bands Trading Strategies That Work”
You must be logged in to post a review.
Related products

Forex Trading
Original price was: $999.00.$15.00Current price is: $15.00.

Forex Trading
The Complete Guide to Multiple Time Frame Analysis & Reading Price Action with Aiman Almansoori
Original price was: $1,399.00.$13.00Current price is: $13.00.

Forex Trading
Original price was: $2,995.00.$31.00Current price is: $31.00.

Original price was: $895.00.$15.00Current price is: $15.00.

Original price was: $1,800.00.$54.00Current price is: $54.00.

Original price was: $999.00.$5.00Current price is: $5.00.

Original price was: $197.00.$5.00Current price is: $5.00.

Original price was: $799.00.$15.00Current price is: $15.00.
Original price was: $450.00.$23.00Current price is: $23.00.

Forex Trading
Original price was: $4,997.00.$27.00Current price is: $27.00.

Forex Trading
Original price was: $249.00.$15.00Current price is: $15.00.
Forex Trading
Original price was: $1,898.00.$10.00Current price is: $10.00.

Original price was: $700.00.$39.00Current price is: $39.00.

Forex Trading
Original price was: $799.00.$15.00Current price is: $15.00.

Forex Trading
Original price was: $125.00.$17.00Current price is: $17.00.

Forex Trading
Original price was: $239.00.$8.00Current price is: $8.00.

Original price was: $1,200.00.$23.00Current price is: $23.00.

Original price was: $997.00.$13.00Current price is: $13.00.

Original price was: $997.00.$8.00Current price is: $8.00.

Forex Trading
Original price was: $2,997.00.$23.00Current price is: $23.00.
Reviews
There are no reviews yet.