-
×
 Trading Indicators for the 21st Century
1 × $6.00
Trading Indicators for the 21st Century
1 × $6.00 -
×
 Butterfly and Condor Workshop with Aeromir
1 × $15.00
Butterfly and Condor Workshop with Aeromir
1 × $15.00 -
×
 ICT Prodigy Trading Course – $650K in Payouts with Alex Solignani
1 × $15.00
ICT Prodigy Trading Course – $650K in Payouts with Alex Solignani
1 × $15.00 -
×
 Mastering the Trade
1 × $6.00
Mastering the Trade
1 × $6.00 -
×
 WealthFRX Trading Mastery Course 2.0
1 × $5.00
WealthFRX Trading Mastery Course 2.0
1 × $5.00 -
×
 The Naked Eye: Raw Data Analytics with Edgar Torres - Raw Data Analytics
1 × $8.00
The Naked Eye: Raw Data Analytics with Edgar Torres - Raw Data Analytics
1 × $8.00 -
×
 Frank Paul – Fibonacci Swing Trader Foundation Course 2011 (Video, Manuals, 5.1 GB) with Forexmentor
1 × $6.00
Frank Paul – Fibonacci Swing Trader Foundation Course 2011 (Video, Manuals, 5.1 GB) with Forexmentor
1 × $6.00 -
×
 WondaFX Signature Strategy with WondaFX
1 × $5.00
WondaFX Signature Strategy with WondaFX
1 × $5.00 -
×
 Practical Speculation with Victor Niederhoffer, Laurel Kenner
1 × $6.00
Practical Speculation with Victor Niederhoffer, Laurel Kenner
1 × $6.00 -
×
 60 Minute Trader with Chris Kobewka
1 × $6.00
60 Minute Trader with Chris Kobewka
1 × $6.00 -
×
 Advanced Spread Trading with Guy Bower - MasterClass Trader
1 × $15.00
Advanced Spread Trading with Guy Bower - MasterClass Trader
1 × $15.00 -
×
 Bond Market Course with The Macro Compass
1 × $15.00
Bond Market Course with The Macro Compass
1 × $15.00 -
×
 Trading Short TermSame Day Trades Sep 2023 with Dan Sheridan & Mark Fenton - Sheridan Options Mentoring
1 × $31.00
Trading Short TermSame Day Trades Sep 2023 with Dan Sheridan & Mark Fenton - Sheridan Options Mentoring
1 × $31.00 -
×
 The Indices Orderflow Masterclass with The Forex Scalpers
1 × $23.00
The Indices Orderflow Masterclass with The Forex Scalpers
1 × $23.00 -
×
 Time Factors in the Stock Market
1 × $6.00
Time Factors in the Stock Market
1 × $6.00 -
×
 White Phoenix’s The Smart (Money) Approach to Trading with Jayson Casper
1 × $39.00
White Phoenix’s The Smart (Money) Approach to Trading with Jayson Casper
1 × $39.00 -
×
 Crypto Trading Academy with Cheeky Investor - Aussie Day Trader
1 × $13.00
Crypto Trading Academy with Cheeky Investor - Aussie Day Trader
1 × $13.00 -
×
 Mastering Daily Option Trading with Option Pit
1 × $93.00
Mastering Daily Option Trading with Option Pit
1 × $93.00 -
×
 Home Run Options Trading Course with Dave Aquino - Base Camp Trading
1 × $11.00
Home Run Options Trading Course with Dave Aquino - Base Camp Trading
1 × $11.00 -
×
 W. D Gann 's Square Of 9 Applied To Modern Markets with Sean Avidar - Hexatrade350
1 × $23.00
W. D Gann 's Square Of 9 Applied To Modern Markets with Sean Avidar - Hexatrade350
1 × $23.00 -
×
 Freedom Challenge ( May 2018 – May 2019)
1 × $54.00
Freedom Challenge ( May 2018 – May 2019)
1 × $54.00 -
×
 Pips University
1 × $6.00
Pips University
1 × $6.00 -
×
 Jarratt Davis Forex Trading Course
1 × $23.00
Jarratt Davis Forex Trading Course
1 × $23.00 -
×
 BCFX 2,0 and 2,5 with Brandon Carter
1 × $5.00
BCFX 2,0 and 2,5 with Brandon Carter
1 × $5.00 -
×
 Flagship Trading Course with Llewelyn James
1 × $23.00
Flagship Trading Course with Llewelyn James
1 × $23.00 -
×
 Day Trading For A Living
1 × $31.00
Day Trading For A Living
1 × $31.00 -
×
 Ultimate Trading Course with Dodgy's Dungeon
1 × $8.00
Ultimate Trading Course with Dodgy's Dungeon
1 × $8.00 -
×
 PRICE ACTION MASTERY
1 × $39.00
PRICE ACTION MASTERY
1 × $39.00 -
×
 High Probability Trading Using Elliott Wave And Fibonacci Analysis withVic Patel - Forex Training Group
1 × $10.00
High Probability Trading Using Elliott Wave And Fibonacci Analysis withVic Patel - Forex Training Group
1 × $10.00 -
×
 Options Trading & Ultimate MasterClass With Tyrone Abela - FX Evolution
1 × $54.00
Options Trading & Ultimate MasterClass With Tyrone Abela - FX Evolution
1 × $54.00 -
×
 The Complete Guide to Multiple Time Frame Analysis & Reading Price Action with Aiman Almansoori
1 × $13.00
The Complete Guide to Multiple Time Frame Analysis & Reading Price Action with Aiman Almansoori
1 × $13.00 -
×
 AI For Traders with Trading Markets
1 × $31.00
AI For Traders with Trading Markets
1 × $31.00 -
×
 Best of the Best: Collars with Amy Meissner & Scott Ruble
1 × $15.00
Best of the Best: Collars with Amy Meissner & Scott Ruble
1 × $15.00 -
×
 TradeCraft: Your Path to Peak Performance Trading By Adam Grimes
1 × $15.00
TradeCraft: Your Path to Peak Performance Trading By Adam Grimes
1 × $15.00 -
×
 Essentials in Quantitative Trading QT01 By HangukQuant's
1 × $23.00
Essentials in Quantitative Trading QT01 By HangukQuant's
1 × $23.00 -
×
 All Weather Butterfly Program - A Deep Dive With Dan Sheridan
1 × $31.00
All Weather Butterfly Program - A Deep Dive With Dan Sheridan
1 × $31.00 -
×
 $20 – 52k 20 pips a day challange with Rafał Zuchowicz - TopMasterTrader
1 × $5.00
$20 – 52k 20 pips a day challange with Rafał Zuchowicz - TopMasterTrader
1 × $5.00 -
×
 The Trading Blueprint with Brad Goh - The Trading Geek
1 × $5.00
The Trading Blueprint with Brad Goh - The Trading Geek
1 × $5.00 -
×
 Order flow self-study training program with iMFtracker
1 × $10.00
Order flow self-study training program with iMFtracker
1 × $10.00 -
×
 XJO Quant - High Probability Trading Setups on ASX 200 Index
1 × $31.00
XJO Quant - High Probability Trading Setups on ASX 200 Index
1 × $31.00 -
×
 The Basics of Swing Trading with Jason Bond
1 × $31.00
The Basics of Swing Trading with Jason Bond
1 × $31.00 -
×
 Compass Trading System with Right Line Trading
1 × $39.00
Compass Trading System with Right Line Trading
1 × $39.00 -
×
 Strategy Spotlight Series
1 × $15.00
Strategy Spotlight Series
1 × $15.00 -
×
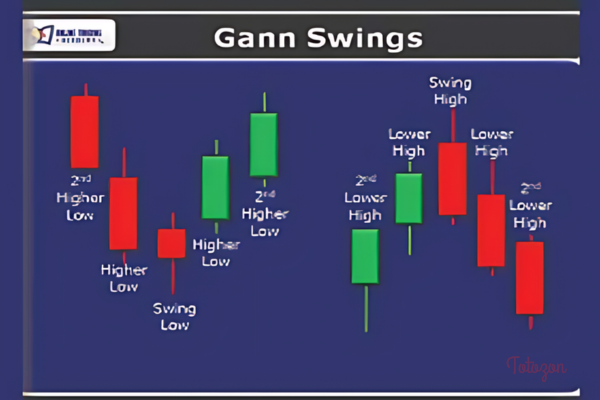 Terry Ashman’s Gann Swings Swing Trading Course (HotTrader Tutorial)
1 × $6.00
Terry Ashman’s Gann Swings Swing Trading Course (HotTrader Tutorial)
1 × $6.00 -
×
 The Orderflow Masterclass with PrimeTrading
1 × $17.00
The Orderflow Masterclass with PrimeTrading
1 × $17.00 -
×
 Arjoio’s MMT - Essential Package
1 × $5.00
Arjoio’s MMT - Essential Package
1 × $5.00 -
×
 LT Pulse and LT Trend/Ultra
1 × $23.00
LT Pulse and LT Trend/Ultra
1 × $23.00 -
×
 The Best Option Trading Course with David Jaffee - Best Stock Strategy
1 × $15.00
The Best Option Trading Course with David Jaffee - Best Stock Strategy
1 × $15.00 -
×
 Investors Live Textbook Trading DVD
1 × $15.00
Investors Live Textbook Trading DVD
1 × $15.00 -
×
 Million Dollar Traders Course with Lex Van Dam
1 × $5.00
Million Dollar Traders Course with Lex Van Dam
1 × $5.00 -
×
 Fast Track Forex Course
1 × $62.00
Fast Track Forex Course
1 × $62.00 -
×
 TRADING NFX Course with Andrew NFX
1 × $5.00
TRADING NFX Course with Andrew NFX
1 × $5.00 -
×
 Sacredscience - R.N.Elliott – Nature’s Law. The secret of the Universe
1 × $6.00
Sacredscience - R.N.Elliott – Nature’s Law. The secret of the Universe
1 × $6.00 -
×
 0 DTE Options Trading Workshop with Aeromir Corporation
1 × $15.00
0 DTE Options Trading Workshop with Aeromir Corporation
1 × $15.00 -
×
 Pinpoint Profit Method Class
1 × $31.00
Pinpoint Profit Method Class
1 × $31.00 -
×
 Matrix Spread Options Trading Course with Base Camp Trading
1 × $31.00
Matrix Spread Options Trading Course with Base Camp Trading
1 × $31.00 -
×
 Deep Dive Butterfly Trading Strategy Class with SJG Trades
1 × $41.00
Deep Dive Butterfly Trading Strategy Class with SJG Trades
1 × $41.00 -
×
 London Super Conference 2019
1 × $62.00
London Super Conference 2019
1 × $62.00 -
×
 Advanced Daytrading Seminar with Ken Calhoun
1 × $155.00
Advanced Daytrading Seminar with Ken Calhoun
1 × $155.00 -
×
 Algo Trading Masterclass with Ali Casey - StatOasis
1 × $23.00
Algo Trading Masterclass with Ali Casey - StatOasis
1 × $23.00 -
×
 Quantamentals - The Next Great Forefront Of Trading and Investing with Trading Markets
1 × $8.00
Quantamentals - The Next Great Forefront Of Trading and Investing with Trading Markets
1 × $8.00 -
×
 The Orderflows Trade Opportunities Encyclopedia with Michael Valtos
1 × $8.00
The Orderflows Trade Opportunities Encyclopedia with Michael Valtos
1 × $8.00 -
×
 SQX Mentorship with Tip Toe Hippo
1 × $23.00
SQX Mentorship with Tip Toe Hippo
1 × $23.00 -
×
 Toolkit For Thinkorswim with Bigtrends
1 × $54.00
Toolkit For Thinkorswim with Bigtrends
1 × $54.00 -
×
 How To Read The Market Professionally with TradeSmart
1 × $27.00
How To Read The Market Professionally with TradeSmart
1 × $27.00 -
×
 Apteros Trading Fall Intensive 2021 - Trading Intensive
1 × $54.00
Apteros Trading Fall Intensive 2021 - Trading Intensive
1 × $54.00 -
×
 Objective Evaluation of Indicators with Constance Brown
1 × $6.00
Objective Evaluation of Indicators with Constance Brown
1 × $6.00 -
×
 Unedited Superconference 2010
1 × $15.00
Unedited Superconference 2010
1 × $15.00 -
×
 Overnight Trading with Nightly Patterns
1 × $5.00
Overnight Trading with Nightly Patterns
1 × $5.00 -
×
 Module 3 – Volume, Trendlines and Indicators
1 × $31.00
Module 3 – Volume, Trendlines and Indicators
1 × $31.00 -
×
 How To Scale Up Your Trading - Online Trading Seminar Replay with Austin Silver - ASFX
1 × $31.00
How To Scale Up Your Trading - Online Trading Seminar Replay with Austin Silver - ASFX
1 × $31.00 -
×
 The Prop Trading Code with Brannigan Barrett - Axia Futures
1 × $23.00
The Prop Trading Code with Brannigan Barrett - Axia Futures
1 × $23.00

Bollinger Bands Trading Strategies That Work
$6.00
File Size: Coming soon!
Delivery Time: 1–12 hours
Media Type: Online Course
Bollinger Bands Trading Strategies That Work
Understanding Bollinger Bands
Bollinger Bands, created by John Bollinger, are one of the most versatile and effective tools in a trader’s arsenal. These bands consist of a middle band (usually a 20-day simple moving average), an upper band (2 standard deviations above the middle band), and a lower band (2 standard deviations below the middle band). They help traders identify overbought and oversold conditions in the market.
How Bollinger Bands Work
The Concept of Volatility
Volatility is a key aspect of Bollinger Bands. The bands expand and contract based on market volatility. When the market is volatile, the bands widen, and when the market is stable, they contract. This behavior makes Bollinger Bands an excellent indicator for anticipating price movements.
The Middle Band
The middle band, which is typically a 20-day simple moving average, serves as the baseline for the upper and lower bands. It represents the average price over a specific period and helps in identifying the overall trend.
The Upper and Lower Bands
The upper and lower bands are set at 2 standard deviations away from the middle band. These bands act as dynamic support and resistance levels, which help traders make informed decisions.
Bollinger Bands Trading Strategies
Strategy 1: Bollinger Bounce
What is the Bollinger Bounce?
The Bollinger Bounce strategy relies on the concept that prices tend to revert to the mean. When the price touches the upper or lower band, it often bounces back towards the middle band.
How to Trade the Bollinger Bounce
- Identify the Touch: Wait for the price to touch the upper or lower band.
- Confirm the Bounce: Look for a reversal candlestick pattern to confirm the bounce.
- Enter the Trade: Enter the trade once the bounce is confirmed, aiming for the middle band as the target.
Strategy 2: Bollinger Squeeze
What is the Bollinger Squeeze?
The Bollinger Squeeze occurs when the bands contract, indicating low volatility. This situation often precedes a significant price movement, making it a great setup for breakout trades.
How to Trade the Bollinger Squeeze
- Identify the Squeeze: Look for the bands to contract tightly.
- Confirm the Breakout: Use additional indicators like the Relative Strength Index (RSI) to confirm the breakout direction.
- Enter the Trade: Enter the trade in the direction of the breakout, placing stop-loss orders just outside the bands.
Strategy 3: Riding the Bands
What is Riding the Bands?
Riding the Bands involves trading with the trend, where the price stays close to the upper or lower band for an extended period.
How to Trade by Riding the Bands
- Identify the Trend: Use the middle band to determine the trend direction.
- Confirm the Trend: Ensure the price consistently touches the upper or lower band without significant pullbacks.
- Enter the Trade: Enter the trade in the direction of the trend, using the opposite band as a trailing stop.
Strategy 4: Bollinger Band Breakouts
What are Bollinger Band Breakouts?
Breakouts occur when the price moves outside the bands, indicating a strong directional movement.
How to Trade Bollinger Band Breakouts
- Identify the Breakout: Look for the price to close outside the bands.
- Confirm the Strength: Use volume indicators to confirm the strength of the breakout.
- Enter the Trade: Enter the trade in the direction of the breakout, setting stop-loss orders within the bands.
Combining Bollinger Bands with Other Indicators
Relative Strength Index (RSI)
Combining Bollinger Bands with the RSI can enhance the reliability of trading signals. The RSI helps confirm overbought or oversold conditions, providing additional context for Bollinger Band signals.
Moving Averages
Using moving averages alongside Bollinger Bands can help in identifying the overall trend. For example, a 50-day moving average can be used to confirm long-term trends.
Volume Indicators
Volume indicators, such as the On-Balance Volume (OBV), can confirm the strength of breakouts and bounces, making them valuable tools in conjunction with Bollinger Bands.
Risk Management in Bollinger Bands Trading
Setting Stop-Loss Orders
Stop-loss orders are crucial in Bollinger Bands trading to manage risk effectively. Place stop-loss orders just outside the bands to minimize losses in case of false signals.
Position Sizing
Proper position sizing ensures that you do not risk too much on a single trade. Use a fixed percentage of your trading capital for each trade to manage risk effectively.
Regular Review and Adjustment
Regularly review your trading strategy and adjust the parameters of the Bollinger Bands to suit changing market conditions. This ongoing adjustment helps in maintaining the effectiveness of the strategy.
Conclusion
Bollinger Bands Trading Strategies are powerful tools for both novice and experienced traders. By understanding the principles behind Bollinger Bands and implementing these strategies, you can enhance your trading performance and achieve consistent results. Remember to combine Bollinger Bands with other indicators, practice risk management, and stay disciplined in your trading approach.
FAQs
What are Bollinger Bands?
Bollinger Bands are a technical analysis tool that consists of a middle band (usually a 20-day simple moving average) and two outer bands set at 2 standard deviations away from the middle band. They help identify overbought and oversold conditions.
How do Bollinger Bands help in trading?
Bollinger Bands help in identifying volatility and potential price reversals. They provide dynamic support and resistance levels, making them useful for various trading strategies.
What is the Bollinger Bounce strategy?
The Bollinger Bounce strategy involves trading based on the idea that prices tend to revert to the mean. When the price touches the upper or lower band, it often bounces back towards the middle band.
Can Bollinger Bands be used with other indicators?
Yes, Bollinger Bands can be combined with indicators like the Relative Strength Index (RSI), moving averages, and volume indicators to enhance the reliability of trading signals.
What is the Bollinger Squeeze?
The Bollinger Squeeze occurs when the bands contract, indicating low volatility. This situation often precedes a significant price movement, making it a great setup for breakout trades.
Be the first to review “Bollinger Bands Trading Strategies That Work”
You must be logged in to post a review.
Related products
Original price was: $299.00.$8.00Current price is: $8.00.
Forex Trading
Original price was: $2,000.00.$23.00Current price is: $23.00.
Original price was: $895.00.$15.00Current price is: $15.00.
Original price was: $1,200.00.$23.00Current price is: $23.00.
Forex Trading
Original price was: $239.00.$8.00Current price is: $8.00.
Forex Trading
The Complete Guide to Multiple Time Frame Analysis & Reading Price Action with Aiman Almansoori
Original price was: $1,399.00.$13.00Current price is: $13.00.

Original price was: $999.00.$5.00Current price is: $5.00.
Forex Trading
Original price was: $2,995.00.$31.00Current price is: $31.00.
Original price was: $695.00.$41.00Current price is: $41.00.
Original price was: $997.00.$8.00Current price is: $8.00.
Forex Trading
Original price was: $1,098.00.$39.00Current price is: $39.00.
Forex Trading
Original price was: $850.00.$23.00Current price is: $23.00.
Forex Trading
Original price was: $999.00.$15.00Current price is: $15.00.
Original price was: $799.00.$15.00Current price is: $15.00.
Forex Trading
Original price was: $550.00.$5.00Current price is: $5.00.
Original price was: $1,800.00.$54.00Current price is: $54.00.
Original price was: $700.00.$39.00Current price is: $39.00.
Original price was: $450.00.$23.00Current price is: $23.00.
Original price was: $1,849.00.$15.00Current price is: $15.00.
Forex Trading
Original price was: $499.00.$15.00Current price is: $15.00.
Reviews
There are no reviews yet.