-
×
 Advanced Spread Trading with Guy Bower - MasterClass Trader
1 × $15.00
Advanced Spread Trading with Guy Bower - MasterClass Trader
1 × $15.00 -
×
 FX Video Course with Geri Trader
1 × $5.00
FX Video Course with Geri Trader
1 × $5.00 -
×
 Trading The Nasdaq Seminar with Alan Rich
1 × $6.00
Trading The Nasdaq Seminar with Alan Rich
1 × $6.00 -
×
 Chris Swaggy C Williams - The Swag Academy
1 × $6.00
Chris Swaggy C Williams - The Swag Academy
1 × $6.00 -
×
 TradeCraft: Your Path to Peak Performance Trading By Adam Grimes
1 × $15.00
TradeCraft: Your Path to Peak Performance Trading By Adam Grimes
1 × $15.00 -
×
 Pattern Recognition & Trading Decisions with Chris Satchwell
1 × $6.00
Pattern Recognition & Trading Decisions with Chris Satchwell
1 × $6.00 -
×
 Unlocking Wealth: Secret to Market Timing with John Crane
1 × $6.00
Unlocking Wealth: Secret to Market Timing with John Crane
1 × $6.00 -
×
 Bond Market Course with The Macro Compass
1 × $15.00
Bond Market Course with The Macro Compass
1 × $15.00 -
×
 B.O.S.S. SPY Sniper with Pat Mitchell – Trick Trades
1 × $39.00
B.O.S.S. SPY Sniper with Pat Mitchell – Trick Trades
1 × $39.00 -
×
 In Jeremy's Stock Market Brain
1 × $62.00
In Jeremy's Stock Market Brain
1 × $62.00 -
×
 Part I Basic and Part II Beyond the Basic with Strategic Trading
1 × $6.00
Part I Basic and Part II Beyond the Basic with Strategic Trading
1 × $6.00 -
×
 Patterns of Speculation with Bertrand M.Roehner
1 × $6.00
Patterns of Speculation with Bertrand M.Roehner
1 × $6.00 -
×
 Gann Course (Video & Audio 1.1 GB)
1 × $6.00
Gann Course (Video & Audio 1.1 GB)
1 × $6.00 -
×
 Crypto Trading Academy with Cheeky Investor - Aussie Day Trader
1 × $13.00
Crypto Trading Academy with Cheeky Investor - Aussie Day Trader
1 × $13.00 -
×
 Hiden Collective Factors in Speculative Trading with Bertrand Roehner
1 × $6.00
Hiden Collective Factors in Speculative Trading with Bertrand Roehner
1 × $6.00 -
×
 EZ2 Trade Charting Collection eSignal (ez2tradesoftware.com) - Raghee Horner
1 × $6.00
EZ2 Trade Charting Collection eSignal (ez2tradesoftware.com) - Raghee Horner
1 × $6.00 -
×
 Mastering Fundamental Analysis with Michael Thomsett
1 × $6.00
Mastering Fundamental Analysis with Michael Thomsett
1 × $6.00 -
×
 ICT Charter 2020 with Inner Circle Trader
1 × $13.00
ICT Charter 2020 with Inner Circle Trader
1 × $13.00 -
×
 Online Course - Why Wave Analysis Belongs in Every Trader's Toolbox with Jeffrey Kennedy - Elliott Wave
1 × $15.00
Online Course - Why Wave Analysis Belongs in Every Trader's Toolbox with Jeffrey Kennedy - Elliott Wave
1 × $15.00 -
×
 Order flow self-study training program with iMFtracker
1 × $10.00
Order flow self-study training program with iMFtracker
1 × $10.00 -
×
 Scalp Strategy and Flipping Small Accounts with Opes Trading Group
1 × $5.00
Scalp Strategy and Flipping Small Accounts with Opes Trading Group
1 × $5.00 -
×
 Trading Mindset, and Three Steps To Profitable Trading with Bruce Banks
1 × $6.00
Trading Mindset, and Three Steps To Profitable Trading with Bruce Banks
1 × $6.00 -
×
 Investment Strategies of Hedge Funds with Filippo Stefanini
1 × $6.00
Investment Strategies of Hedge Funds with Filippo Stefanini
1 × $6.00 -
×
 The A14 Weekly Option Strategy Workshop with Amy Meissner
1 × $23.00
The A14 Weekly Option Strategy Workshop with Amy Meissner
1 × $23.00 -
×
 NQ Price Action Mastery with Trade Smart
1 × $15.00
NQ Price Action Mastery with Trade Smart
1 × $15.00 -
×
 Stealth Trader (Ebook) with Andy Jordan - Trading Educators
1 × $132.00
Stealth Trader (Ebook) with Andy Jordan - Trading Educators
1 × $132.00 -
×
 Alternative Beta Strategies & Hedge Fund Replication with Lars Jaeger & Jeffrey Pease
1 × $6.00
Alternative Beta Strategies & Hedge Fund Replication with Lars Jaeger & Jeffrey Pease
1 × $6.00 -
×
 5 Part Daytrading Course with Kevin Haggerty
1 × $6.00
5 Part Daytrading Course with Kevin Haggerty
1 × $6.00 -
×
 Yin Yang Forex Training Program
1 × $85.00
Yin Yang Forex Training Program
1 × $85.00 -
×
 Introduction to the Elliot Wave Principle Seminar - Robert Prechter
1 × $6.00
Introduction to the Elliot Wave Principle Seminar - Robert Prechter
1 × $6.00 -
×
 White Phoenix’s The Smart (Money) Approach to Trading with Jayson Casper
1 × $39.00
White Phoenix’s The Smart (Money) Approach to Trading with Jayson Casper
1 × $39.00 -
×
 Matrix Options
1 × $6.00
Matrix Options
1 × $6.00 -
×
 Gamma Options Boot Camp with Bigtrends
1 × $74.00
Gamma Options Boot Camp with Bigtrends
1 × $74.00 -
×
 The Best Option Trading Course with David Jaffee - Best Stock Strategy
1 × $15.00
The Best Option Trading Course with David Jaffee - Best Stock Strategy
1 × $15.00 -
×
 Professional Sniper FX
1 × $6.00
Professional Sniper FX
1 × $6.00 -
×
 5-Step-Trading Stocks I and II with Lex Van Dam
1 × $4.00
5-Step-Trading Stocks I and II with Lex Van Dam
1 × $4.00 -
×
 High Probability Trading Using Elliott Wave And Fibonacci Analysis withVic Patel - Forex Training Group
1 × $10.00
High Probability Trading Using Elliott Wave And Fibonacci Analysis withVic Patel - Forex Training Group
1 × $10.00 -
×
 FXStreet Unrecorded Webinars Sept & Oct, 2011 with Sam Seiden
1 × $6.00
FXStreet Unrecorded Webinars Sept & Oct, 2011 with Sam Seiden
1 × $6.00 -
×
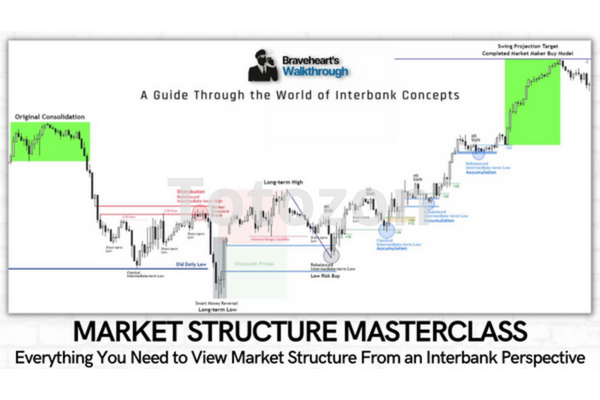 Market Structure Masterclass with Braveheart Trading
1 × $5.00
Market Structure Masterclass with Braveheart Trading
1 × $5.00 -
×
 Home Run Options Trading Course with Dave Aquino - Base Camp Trading
1 × $11.00
Home Run Options Trading Course with Dave Aquino - Base Camp Trading
1 × $11.00 -
×
 YTC Price Action Trader
1 × $6.00
YTC Price Action Trader
1 × $6.00 -
×
 Pattern, Price & Time: Using Gann Theory in Trading Systems (1st Edition) with James Hyerczyk
1 × $6.00
Pattern, Price & Time: Using Gann Theory in Trading Systems (1st Edition) with James Hyerczyk
1 × $6.00 -
×
 Traders Guide to Emotional Management with Brian McAboy
1 × $4.00
Traders Guide to Emotional Management with Brian McAboy
1 × $4.00 -
×
 The Trading Blueprint with Brad Goh - The Trading Geek
1 × $5.00
The Trading Blueprint with Brad Goh - The Trading Geek
1 × $5.00 -
×
 Value, Price & Profit with Karl Marx
1 × $6.00
Value, Price & Profit with Karl Marx
1 × $6.00 -
×
 ICT Mentorship – 2019
1 × $13.00
ICT Mentorship – 2019
1 × $13.00 -
×
 Profiletraders - Market Profile Day Trading
1 × $15.00
Profiletraders - Market Profile Day Trading
1 × $15.00 -
×
 Candlesticks Re-Ignited Workshop
1 × $23.00
Candlesticks Re-Ignited Workshop
1 × $23.00 -
×
 WD Gann’s Master Time Factor DVD With Miles Wilson Walker
1 × $6.00
WD Gann’s Master Time Factor DVD With Miles Wilson Walker
1 × $6.00 -
×
 George Wollsten: Expert Stock and Grain Trader with George Bayer
1 × $6.00
George Wollsten: Expert Stock and Grain Trader with George Bayer
1 × $6.00 -
×
 TRADING NFX Course with Andrew NFX
1 × $5.00
TRADING NFX Course with Andrew NFX
1 × $5.00 -
×
 Trade with a Day Job USA v2010 with Markets Mastered
1 × $6.00
Trade with a Day Job USA v2010 with Markets Mastered
1 × $6.00 -
×
 $20 – 52k 20 pips a day challange with Rafał Zuchowicz - TopMasterTrader
1 × $5.00
$20 – 52k 20 pips a day challange with Rafał Zuchowicz - TopMasterTrader
1 × $5.00 -
×
 Sniper Entry Course with ALGOHUB
1 × $5.00
Sniper Entry Course with ALGOHUB
1 × $5.00 -
×
 Active Trader Program (Smarter Starter Pack + the Number One Trading Plan)
1 × $15.00
Active Trader Program (Smarter Starter Pack + the Number One Trading Plan)
1 × $15.00 -
×
 60 Seconds Sure Shot Strategy with Albert E
1 × $6.00
60 Seconds Sure Shot Strategy with Albert E
1 × $6.00 -
×
 Gold & Silver Profit System with Bill Poulos
1 × $6.00
Gold & Silver Profit System with Bill Poulos
1 × $6.00 -
×
 Precision Pattern Trading with Daryl Guppy
1 × $6.00
Precision Pattern Trading with Daryl Guppy
1 × $6.00 -
×
 No Bull Investing with Jack Bernstein
1 × $6.00
No Bull Investing with Jack Bernstein
1 × $6.00 -
×
 W. D Gann 's Square Of 9 Applied To Modern Markets with Sean Avidar - Hexatrade350
1 × $23.00
W. D Gann 's Square Of 9 Applied To Modern Markets with Sean Avidar - Hexatrade350
1 × $23.00 -
×
 Market Evolution
1 × $6.00
Market Evolution
1 × $6.00 -
×
 SO FX Educational Course with SO FX
1 × $5.00
SO FX Educational Course with SO FX
1 × $5.00 -
×
 Pro Trading Blueprint with Limitless Forex Academy
1 × $5.00
Pro Trading Blueprint with Limitless Forex Academy
1 × $5.00 -
×
 Quantamentals - The Next Great Forefront Of Trading and Investing with Trading Markets
1 × $8.00
Quantamentals - The Next Great Forefront Of Trading and Investing with Trading Markets
1 × $8.00 -
×
 Triple Squeeze Indicator TOS
1 × $6.00
Triple Squeeze Indicator TOS
1 × $6.00 -
×
 Quality FX Academy
1 × $5.00
Quality FX Academy
1 × $5.00 -
×
 The Superstock Investor with Charles LaLoggia
1 × $6.00
The Superstock Investor with Charles LaLoggia
1 × $6.00 -
×
 Algo Trading Masterclass with Ali Casey - StatOasis
1 × $23.00
Algo Trading Masterclass with Ali Casey - StatOasis
1 × $23.00 -
×
 Study Guide for Technical Analysis Explained (1st Edition) with Martin Pring
1 × $6.00
Study Guide for Technical Analysis Explained (1st Edition) with Martin Pring
1 × $6.00 -
×
 The Orderflows Trade Opportunities Encyclopedia with Michael Valtos
1 × $8.00
The Orderflows Trade Opportunities Encyclopedia with Michael Valtos
1 × $8.00

Bollinger Bands Trading Strategies That Work
$6.00
File Size: Coming soon!
Delivery Time: 1–12 hours
Media Type: Online Course
Bollinger Bands Trading Strategies That Work
Understanding Bollinger Bands
Bollinger Bands, created by John Bollinger, are one of the most versatile and effective tools in a trader’s arsenal. These bands consist of a middle band (usually a 20-day simple moving average), an upper band (2 standard deviations above the middle band), and a lower band (2 standard deviations below the middle band). They help traders identify overbought and oversold conditions in the market.
How Bollinger Bands Work
The Concept of Volatility
Volatility is a key aspect of Bollinger Bands. The bands expand and contract based on market volatility. When the market is volatile, the bands widen, and when the market is stable, they contract. This behavior makes Bollinger Bands an excellent indicator for anticipating price movements.
The Middle Band
The middle band, which is typically a 20-day simple moving average, serves as the baseline for the upper and lower bands. It represents the average price over a specific period and helps in identifying the overall trend.
The Upper and Lower Bands
The upper and lower bands are set at 2 standard deviations away from the middle band. These bands act as dynamic support and resistance levels, which help traders make informed decisions.
Bollinger Bands Trading Strategies
Strategy 1: Bollinger Bounce
What is the Bollinger Bounce?
The Bollinger Bounce strategy relies on the concept that prices tend to revert to the mean. When the price touches the upper or lower band, it often bounces back towards the middle band.
How to Trade the Bollinger Bounce
- Identify the Touch: Wait for the price to touch the upper or lower band.
- Confirm the Bounce: Look for a reversal candlestick pattern to confirm the bounce.
- Enter the Trade: Enter the trade once the bounce is confirmed, aiming for the middle band as the target.
Strategy 2: Bollinger Squeeze
What is the Bollinger Squeeze?
The Bollinger Squeeze occurs when the bands contract, indicating low volatility. This situation often precedes a significant price movement, making it a great setup for breakout trades.
How to Trade the Bollinger Squeeze
- Identify the Squeeze: Look for the bands to contract tightly.
- Confirm the Breakout: Use additional indicators like the Relative Strength Index (RSI) to confirm the breakout direction.
- Enter the Trade: Enter the trade in the direction of the breakout, placing stop-loss orders just outside the bands.
Strategy 3: Riding the Bands
What is Riding the Bands?
Riding the Bands involves trading with the trend, where the price stays close to the upper or lower band for an extended period.
How to Trade by Riding the Bands
- Identify the Trend: Use the middle band to determine the trend direction.
- Confirm the Trend: Ensure the price consistently touches the upper or lower band without significant pullbacks.
- Enter the Trade: Enter the trade in the direction of the trend, using the opposite band as a trailing stop.
Strategy 4: Bollinger Band Breakouts
What are Bollinger Band Breakouts?
Breakouts occur when the price moves outside the bands, indicating a strong directional movement.
How to Trade Bollinger Band Breakouts
- Identify the Breakout: Look for the price to close outside the bands.
- Confirm the Strength: Use volume indicators to confirm the strength of the breakout.
- Enter the Trade: Enter the trade in the direction of the breakout, setting stop-loss orders within the bands.
Combining Bollinger Bands with Other Indicators
Relative Strength Index (RSI)
Combining Bollinger Bands with the RSI can enhance the reliability of trading signals. The RSI helps confirm overbought or oversold conditions, providing additional context for Bollinger Band signals.
Moving Averages
Using moving averages alongside Bollinger Bands can help in identifying the overall trend. For example, a 50-day moving average can be used to confirm long-term trends.
Volume Indicators
Volume indicators, such as the On-Balance Volume (OBV), can confirm the strength of breakouts and bounces, making them valuable tools in conjunction with Bollinger Bands.
Risk Management in Bollinger Bands Trading
Setting Stop-Loss Orders
Stop-loss orders are crucial in Bollinger Bands trading to manage risk effectively. Place stop-loss orders just outside the bands to minimize losses in case of false signals.
Position Sizing
Proper position sizing ensures that you do not risk too much on a single trade. Use a fixed percentage of your trading capital for each trade to manage risk effectively.
Regular Review and Adjustment
Regularly review your trading strategy and adjust the parameters of the Bollinger Bands to suit changing market conditions. This ongoing adjustment helps in maintaining the effectiveness of the strategy.
Conclusion
Bollinger Bands Trading Strategies are powerful tools for both novice and experienced traders. By understanding the principles behind Bollinger Bands and implementing these strategies, you can enhance your trading performance and achieve consistent results. Remember to combine Bollinger Bands with other indicators, practice risk management, and stay disciplined in your trading approach.
FAQs
What are Bollinger Bands?
Bollinger Bands are a technical analysis tool that consists of a middle band (usually a 20-day simple moving average) and two outer bands set at 2 standard deviations away from the middle band. They help identify overbought and oversold conditions.
How do Bollinger Bands help in trading?
Bollinger Bands help in identifying volatility and potential price reversals. They provide dynamic support and resistance levels, making them useful for various trading strategies.
What is the Bollinger Bounce strategy?
The Bollinger Bounce strategy involves trading based on the idea that prices tend to revert to the mean. When the price touches the upper or lower band, it often bounces back towards the middle band.
Can Bollinger Bands be used with other indicators?
Yes, Bollinger Bands can be combined with indicators like the Relative Strength Index (RSI), moving averages, and volume indicators to enhance the reliability of trading signals.
What is the Bollinger Squeeze?
The Bollinger Squeeze occurs when the bands contract, indicating low volatility. This situation often precedes a significant price movement, making it a great setup for breakout trades.
Be the first to review “Bollinger Bands Trading Strategies That Work”
You must be logged in to post a review.
Related products

Forex Trading
Original price was: $999.00.$15.00Current price is: $15.00.

Original price was: $695.00.$41.00Current price is: $41.00.
Forex Trading
Original price was: $2,000.00.$23.00Current price is: $23.00.
Forex Trading
Quantamentals – The Next Great Forefront Of Trading and Investing with Trading Markets
Original price was: $1,495.00.$8.00Current price is: $8.00.
Forex Trading
Original price was: $1,898.00.$10.00Current price is: $10.00.
Original price was: $997.00.$13.00Current price is: $13.00.
Original price was: $999.00.$5.00Current price is: $5.00.
Original price was: $1,849.00.$15.00Current price is: $15.00.

Forex Trading
Original price was: $1,098.00.$39.00Current price is: $39.00.

Forex Trading
Original price was: $2,995.00.$31.00Current price is: $31.00.

Forex Trading
Original price was: $850.00.$23.00Current price is: $23.00.

Forex Trading
Original price was: $799.00.$15.00Current price is: $15.00.
Forex Trading
Original price was: $499.00.$15.00Current price is: $15.00.

Original price was: $799.00.$15.00Current price is: $15.00.

Original price was: $450.00.$23.00Current price is: $23.00.
Original price was: $310.00.$23.00Current price is: $23.00.
Original price was: $700.00.$39.00Current price is: $39.00.

Original price was: $997.00.$8.00Current price is: $8.00.

Forex Trading
Original price was: $125.00.$17.00Current price is: $17.00.

Original price was: $649.00.$20.00Current price is: $20.00.
Reviews
There are no reviews yet.