-
×
 WondaFX Signature Strategy with WondaFX
1 × $5.00
WondaFX Signature Strategy with WondaFX
1 × $5.00 -
×
 CFA Level 1,2,3 - Study Guides 2006
1 × $6.00
CFA Level 1,2,3 - Study Guides 2006
1 × $6.00 -
×
 Special Webinars Module 1 with Trader Dante
1 × $6.00
Special Webinars Module 1 with Trader Dante
1 × $6.00 -
×
 Price Action Trading Volume 2 with Fractal Flow Pro
1 × $6.00
Price Action Trading Volume 2 with Fractal Flow Pro
1 × $6.00 -
×
 A Trader’s Guide To Discipline
1 × $6.00
A Trader’s Guide To Discipline
1 × $6.00 -
×
 Options Professional Online Webinar (2010-01 – 2010-02) with J.L.Lord
1 × $6.00
Options Professional Online Webinar (2010-01 – 2010-02) with J.L.Lord
1 × $6.00 -
×
 Momentum Scalping for Profits with Shay Horowitz
1 × $6.00
Momentum Scalping for Profits with Shay Horowitz
1 × $6.00 -
×
 Great Market Technicians of the 21st Century. Galileo, Fibonacci & Beethoven with Constance Brown
1 × $6.00
Great Market Technicians of the 21st Century. Galileo, Fibonacci & Beethoven with Constance Brown
1 × $6.00 -
×
 Greg Capra – 5 Pristine Trading DVD’s
1 × $31.00
Greg Capra – 5 Pristine Trading DVD’s
1 × $31.00 -
×
 5-Day Master Trader Program 2022 with Mark Minervini
1 × $31.00
5-Day Master Trader Program 2022 with Mark Minervini
1 × $31.00 -
×
 X-Factor Day-Trading
1 × $5.00
X-Factor Day-Trading
1 × $5.00 -
×
 Mastering Daily Option Trading with Option Pit
1 × $93.00
Mastering Daily Option Trading with Option Pit
1 × $93.00 -
×
 Hit & Run Trading: The Short-Term Stock Traders Bible (1996) with Jeff Cooper
1 × $6.00
Hit & Run Trading: The Short-Term Stock Traders Bible (1996) with Jeff Cooper
1 × $6.00 -
×
 Murrey Math Trading System Book with Murrey Math
1 × $6.00
Murrey Math Trading System Book with Murrey Math
1 × $6.00 -
×
 Thetimefactor - TRADING WITH PRICE
1 × $15.00
Thetimefactor - TRADING WITH PRICE
1 × $15.00 -
×
 Mastering Debit Spreads with Vince Vora
1 × $15.00
Mastering Debit Spreads with Vince Vora
1 × $15.00 -
×
 Guide to Winning with Automated Trading Systems with Jack Schwager
1 × $6.00
Guide to Winning with Automated Trading Systems with Jack Schwager
1 × $6.00 -
×
 Pro Trader Boot Camp Home Study with Derrick Oldensmith - T3 Live
1 × $31.00
Pro Trader Boot Camp Home Study with Derrick Oldensmith - T3 Live
1 × $31.00 -
×
 MTI - Trend Trader Course (Feb 2014)
1 × $23.00
MTI - Trend Trader Course (Feb 2014)
1 × $23.00 -
×
 Markers System Plus v5 (Oct 2016)
1 × $31.00
Markers System Plus v5 (Oct 2016)
1 × $31.00 -
×
 XLT - Forex Trading Course
1 × $6.00
XLT - Forex Trading Course
1 × $6.00 -
×
 Advanced AmiBroker Coding with Matt Radtke & Connors Research
1 × $23.00
Advanced AmiBroker Coding with Matt Radtke & Connors Research
1 × $23.00 -
×
 Algo Trading Masterclass with Ali Casey - StatOasis
1 × $23.00
Algo Trading Masterclass with Ali Casey - StatOasis
1 × $23.00 -
×
 Market Timing & Technical Analysis with Alan Shaw
1 × $6.00
Market Timing & Technical Analysis with Alan Shaw
1 × $6.00 -
×
 Introduction To The STRAT Course with Rob Smith
1 × $8.00
Introduction To The STRAT Course with Rob Smith
1 × $8.00 -
×
 Hawkeye Indicators for eSignal + Manual (janarps.com)
1 × $6.00
Hawkeye Indicators for eSignal + Manual (janarps.com)
1 × $6.00 -
×
 PRICE ACTION MASTERY
1 × $39.00
PRICE ACTION MASTERY
1 × $39.00 -
×
 Price Action Stock Day Trading Course with Trade That Swing
1 × $62.00
Price Action Stock Day Trading Course with Trade That Swing
1 × $62.00 -
×
 Price Headley - Using Williams %R The BigTrends Way
1 × $6.00
Price Headley - Using Williams %R The BigTrends Way
1 × $6.00 -
×
 Mindful Trading e-Workbook with Traders State Of Mind
1 × $6.00
Mindful Trading e-Workbook with Traders State Of Mind
1 × $6.00 -
×
 Get Rich with Dividends
1 × $6.00
Get Rich with Dividends
1 × $6.00 -
×
 Module 3 – Short Term Time Frame Trading In The Bund
1 × $6.00
Module 3 – Short Term Time Frame Trading In The Bund
1 × $6.00 -
×
 Layup Trading Strategies and Setups
1 × $54.00
Layup Trading Strategies and Setups
1 × $54.00 -
×
 May Madness with LIT Trading
1 × $5.00
May Madness with LIT Trading
1 × $5.00 -
×
 Greatest Trading Tools with Michael Parsons
1 × $6.00
Greatest Trading Tools with Michael Parsons
1 × $6.00 -
×
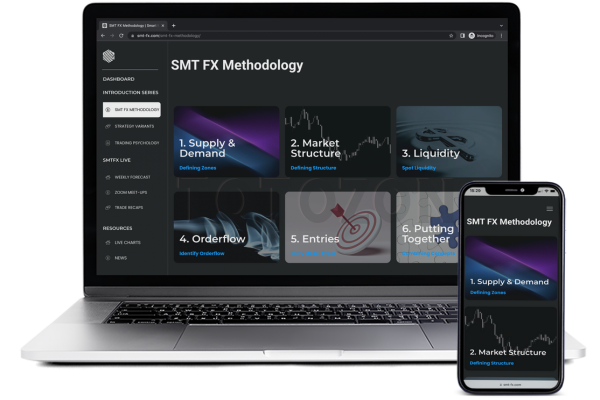 SMT FX Trading
1 × $5.00
SMT FX Trading
1 × $5.00 -
×
 The Indices Orderflow Masterclass with The Forex Scalpers
1 × $23.00
The Indices Orderflow Masterclass with The Forex Scalpers
1 × $23.00 -
×
 Guide To Selling High Probability Spreads Class with Don Kaufman
1 × $6.00
Guide To Selling High Probability Spreads Class with Don Kaufman
1 × $6.00 -
×
 Intra-Day Trading Techniques CD with Greg Capra
1 × $6.00
Intra-Day Trading Techniques CD with Greg Capra
1 × $6.00 -
×
 Ichimokutrade - Elliot Wave 101
1 × $15.00
Ichimokutrade - Elliot Wave 101
1 × $15.00 -
×
 Forex Millionaire Course with Willis University
1 × $6.00
Forex Millionaire Course with Willis University
1 × $6.00 -
×
 $20 – 52k 20 pips a day challange with Rafał Zuchowicz - TopMasterTrader
1 × $5.00
$20 – 52k 20 pips a day challange with Rafał Zuchowicz - TopMasterTrader
1 × $5.00 -
×
 5-Step-Trading Stocks II - Avoid Common Trading Mistakes - Online Course (April 2014)
1 × $23.00
5-Step-Trading Stocks II - Avoid Common Trading Mistakes - Online Course (April 2014)
1 × $23.00 -
×
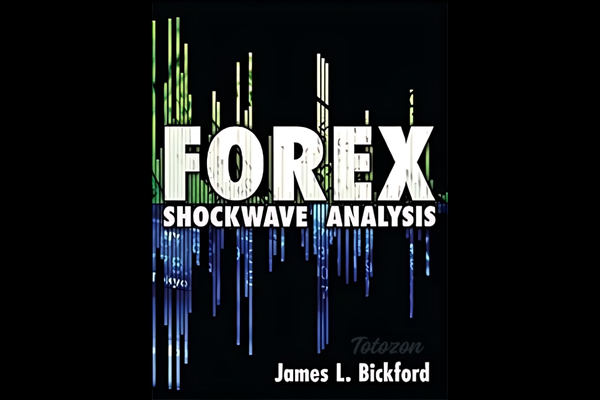 Forex Shockwave Analysis with James Bickford
1 × $6.00
Forex Shockwave Analysis with James Bickford
1 × $6.00 -
×
 The Big Picture Collection with Barbara Rockefeller
1 × $6.00
The Big Picture Collection with Barbara Rockefeller
1 × $6.00 -
×
 New Foundations for Auction Market Trading Course with Tom Alexander
1 × $54.00
New Foundations for Auction Market Trading Course with Tom Alexander
1 × $54.00 -
×
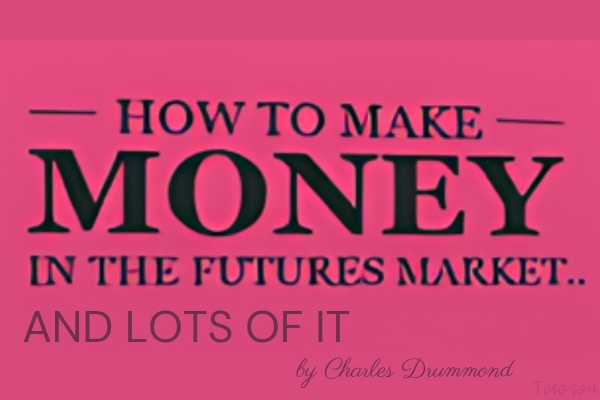 How to Make Money in the Futures Market … and Lots of It with Charles Drummond
1 × $6.00
How to Make Money in the Futures Market … and Lots of It with Charles Drummond
1 × $6.00 -
×
 Market Internals & Intraday Timing Webinar
1 × $6.00
Market Internals & Intraday Timing Webinar
1 × $6.00 -
×
 FX Prosperity Academy with Leonard Williams Jr
1 × $5.00
FX Prosperity Academy with Leonard Williams Jr
1 × $5.00 -
×
 Forex Meets the Market Profile with John Keppler
1 × $23.00
Forex Meets the Market Profile with John Keppler
1 × $23.00 -
×
 MotiveWave Course with Todd Gordon
1 × $23.00
MotiveWave Course with Todd Gordon
1 × $23.00 -
×
 How To Trade Fundamental News Release 2022 with Patrick Muke
1 × $6.00
How To Trade Fundamental News Release 2022 with Patrick Muke
1 × $6.00 -
×
 Low Timeframe Supply & Demand with RROP
1 × $5.00
Low Timeframe Supply & Demand with RROP
1 × $5.00 -
×
 Spyglass LSS Day Trading Workshop
1 × $15.00
Spyglass LSS Day Trading Workshop
1 × $15.00 -
×
 Advanced Spread Trading with Guy Bower - MasterClass Trader
1 × $15.00
Advanced Spread Trading with Guy Bower - MasterClass Trader
1 × $15.00

Bollinger Bands Trading Strategies That Work
$6.00
File Size: Coming soon!
Delivery Time: 1–12 hours
Media Type: Online Course
Bollinger Bands Trading Strategies That Work
Understanding Bollinger Bands
Bollinger Bands, created by John Bollinger, are one of the most versatile and effective tools in a trader’s arsenal. These bands consist of a middle band (usually a 20-day simple moving average), an upper band (2 standard deviations above the middle band), and a lower band (2 standard deviations below the middle band). They help traders identify overbought and oversold conditions in the market.
How Bollinger Bands Work
The Concept of Volatility
Volatility is a key aspect of Bollinger Bands. The bands expand and contract based on market volatility. When the market is volatile, the bands widen, and when the market is stable, they contract. This behavior makes Bollinger Bands an excellent indicator for anticipating price movements.
The Middle Band
The middle band, which is typically a 20-day simple moving average, serves as the baseline for the upper and lower bands. It represents the average price over a specific period and helps in identifying the overall trend.
The Upper and Lower Bands
The upper and lower bands are set at 2 standard deviations away from the middle band. These bands act as dynamic support and resistance levels, which help traders make informed decisions.
Bollinger Bands Trading Strategies
Strategy 1: Bollinger Bounce
What is the Bollinger Bounce?
The Bollinger Bounce strategy relies on the concept that prices tend to revert to the mean. When the price touches the upper or lower band, it often bounces back towards the middle band.
How to Trade the Bollinger Bounce
- Identify the Touch: Wait for the price to touch the upper or lower band.
- Confirm the Bounce: Look for a reversal candlestick pattern to confirm the bounce.
- Enter the Trade: Enter the trade once the bounce is confirmed, aiming for the middle band as the target.
Strategy 2: Bollinger Squeeze
What is the Bollinger Squeeze?
The Bollinger Squeeze occurs when the bands contract, indicating low volatility. This situation often precedes a significant price movement, making it a great setup for breakout trades.
How to Trade the Bollinger Squeeze
- Identify the Squeeze: Look for the bands to contract tightly.
- Confirm the Breakout: Use additional indicators like the Relative Strength Index (RSI) to confirm the breakout direction.
- Enter the Trade: Enter the trade in the direction of the breakout, placing stop-loss orders just outside the bands.
Strategy 3: Riding the Bands
What is Riding the Bands?
Riding the Bands involves trading with the trend, where the price stays close to the upper or lower band for an extended period.
How to Trade by Riding the Bands
- Identify the Trend: Use the middle band to determine the trend direction.
- Confirm the Trend: Ensure the price consistently touches the upper or lower band without significant pullbacks.
- Enter the Trade: Enter the trade in the direction of the trend, using the opposite band as a trailing stop.
Strategy 4: Bollinger Band Breakouts
What are Bollinger Band Breakouts?
Breakouts occur when the price moves outside the bands, indicating a strong directional movement.
How to Trade Bollinger Band Breakouts
- Identify the Breakout: Look for the price to close outside the bands.
- Confirm the Strength: Use volume indicators to confirm the strength of the breakout.
- Enter the Trade: Enter the trade in the direction of the breakout, setting stop-loss orders within the bands.
Combining Bollinger Bands with Other Indicators
Relative Strength Index (RSI)
Combining Bollinger Bands with the RSI can enhance the reliability of trading signals. The RSI helps confirm overbought or oversold conditions, providing additional context for Bollinger Band signals.
Moving Averages
Using moving averages alongside Bollinger Bands can help in identifying the overall trend. For example, a 50-day moving average can be used to confirm long-term trends.
Volume Indicators
Volume indicators, such as the On-Balance Volume (OBV), can confirm the strength of breakouts and bounces, making them valuable tools in conjunction with Bollinger Bands.
Risk Management in Bollinger Bands Trading
Setting Stop-Loss Orders
Stop-loss orders are crucial in Bollinger Bands trading to manage risk effectively. Place stop-loss orders just outside the bands to minimize losses in case of false signals.
Position Sizing
Proper position sizing ensures that you do not risk too much on a single trade. Use a fixed percentage of your trading capital for each trade to manage risk effectively.
Regular Review and Adjustment
Regularly review your trading strategy and adjust the parameters of the Bollinger Bands to suit changing market conditions. This ongoing adjustment helps in maintaining the effectiveness of the strategy.
Conclusion
Bollinger Bands Trading Strategies are powerful tools for both novice and experienced traders. By understanding the principles behind Bollinger Bands and implementing these strategies, you can enhance your trading performance and achieve consistent results. Remember to combine Bollinger Bands with other indicators, practice risk management, and stay disciplined in your trading approach.
FAQs
What are Bollinger Bands?
Bollinger Bands are a technical analysis tool that consists of a middle band (usually a 20-day simple moving average) and two outer bands set at 2 standard deviations away from the middle band. They help identify overbought and oversold conditions.
How do Bollinger Bands help in trading?
Bollinger Bands help in identifying volatility and potential price reversals. They provide dynamic support and resistance levels, making them useful for various trading strategies.
What is the Bollinger Bounce strategy?
The Bollinger Bounce strategy involves trading based on the idea that prices tend to revert to the mean. When the price touches the upper or lower band, it often bounces back towards the middle band.
Can Bollinger Bands be used with other indicators?
Yes, Bollinger Bands can be combined with indicators like the Relative Strength Index (RSI), moving averages, and volume indicators to enhance the reliability of trading signals.
What is the Bollinger Squeeze?
The Bollinger Squeeze occurs when the bands contract, indicating low volatility. This situation often precedes a significant price movement, making it a great setup for breakout trades.
Be the first to review “Bollinger Bands Trading Strategies That Work”
You must be logged in to post a review.
Related products

Original price was: $4,995.00.$15.00Current price is: $15.00.

Original price was: $649.00.$20.00Current price is: $20.00.

Original price was: $299.00.$8.00Current price is: $8.00.

Original price was: $999.00.$5.00Current price is: $5.00.
Original price was: $197.00.$5.00Current price is: $5.00.

Original price was: $1,200.00.$23.00Current price is: $23.00.

Forex Trading
Original price was: $500.00.$5.00Current price is: $5.00.

Forex Trading
Original price was: $2,997.00.$23.00Current price is: $23.00.

Forex Trading
Original price was: $850.00.$23.00Current price is: $23.00.

Forex Trading
Original price was: $125.00.$17.00Current price is: $17.00.

Forex Trading
Original price was: $249.00.$15.00Current price is: $15.00.

Forex Trading
The Complete Guide to Multiple Time Frame Analysis & Reading Price Action with Aiman Almansoori
Original price was: $1,399.00.$13.00Current price is: $13.00.

Forex Trading
Original price was: $697.00.$5.00Current price is: $5.00.

Original price was: $799.00.$15.00Current price is: $15.00.
Forex Trading
Original price was: $550.00.$5.00Current price is: $5.00.
Forex Trading
Original price was: $2,000.00.$23.00Current price is: $23.00.

Original price was: $997.00.$13.00Current price is: $13.00.

Forex Trading
Original price was: $1,098.00.$39.00Current price is: $39.00.

Original price was: $700.00.$39.00Current price is: $39.00.
Original price was: $895.00.$15.00Current price is: $15.00.
Reviews
There are no reviews yet.