-
×
 Advances in International Investments: Traditional and Alternative Approaches with Hung-Gay Fung, Xiaoqing Eleanor Xu & Jot Yau
1 × $6.00
Advances in International Investments: Traditional and Alternative Approaches with Hung-Gay Fung, Xiaoqing Eleanor Xu & Jot Yau
1 × $6.00 -
×
 How I Day Trade Course with Traderade
1 × $15.00
How I Day Trade Course with Traderade
1 × $15.00 -
×
 The Best Option Trading Course with David Jaffee - Best Stock Strategy
1 × $15.00
The Best Option Trading Course with David Jaffee - Best Stock Strategy
1 × $15.00 -
×
 SQX Mentorship with Tip Toe Hippo
1 × $23.00
SQX Mentorship with Tip Toe Hippo
1 × $23.00 -
×
 Fractal Markets FX (SMC)
1 × $5.00
Fractal Markets FX (SMC)
1 × $5.00 -
×
 The Ultimate Trading Resource with Clayton Bell, Alex Viscusi & Ben Chaffee
1 × $6.00
The Ultimate Trading Resource with Clayton Bell, Alex Viscusi & Ben Chaffee
1 × $6.00 -
×
 Gold Trading Academy Video Course
1 × $23.00
Gold Trading Academy Video Course
1 × $23.00 -
×
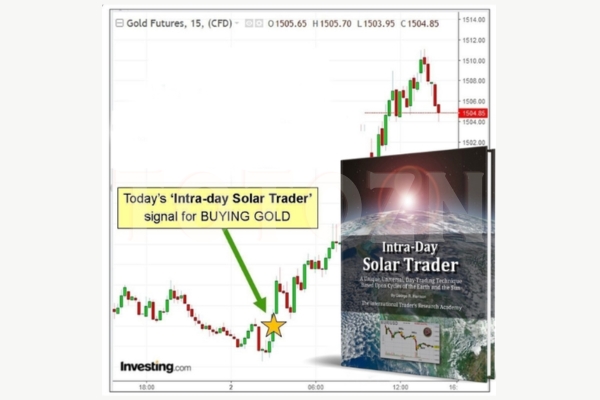 Intra-day Solar Trader with George Harrison
1 × $17.00
Intra-day Solar Trader with George Harrison
1 × $17.00 -
×
 Quantifiable Edges – Gold Subscription with Rob Hanna
1 × $54.00
Quantifiable Edges – Gold Subscription with Rob Hanna
1 × $54.00 -
×
 Simpler Options - Ultimate Guide to Debit Spreads – Nov 2014
1 × $6.00
Simpler Options - Ultimate Guide to Debit Spreads – Nov 2014
1 × $6.00 -
×
 Trading MoneyTides & Chaos in the Stock Market with Hans Hannula
1 × $6.00
Trading MoneyTides & Chaos in the Stock Market with Hans Hannula
1 × $6.00 -
×
 Investment Leadership & Portfolio Management with Brian Singer
1 × $6.00
Investment Leadership & Portfolio Management with Brian Singer
1 × $6.00 -
×
 Forex Trading For Beginners with John Jagerson - Investopedia Academy
1 × $6.00
Forex Trading For Beginners with John Jagerson - Investopedia Academy
1 × $6.00 -
×
 Option, Futures and Other Derivates 9th Edition
1 × $6.00
Option, Futures and Other Derivates 9th Edition
1 × $6.00 -
×
 Carolyn Boroden Package
1 × $15.00
Carolyn Boroden Package
1 × $15.00 -
×
 The Best of the Professional Traders Journal. Market Timing with Larry Connors
1 × $6.00
The Best of the Professional Traders Journal. Market Timing with Larry Connors
1 × $6.00 -
×
 Commodities for Dummies with Amine Bouchentouf
1 × $6.00
Commodities for Dummies with Amine Bouchentouf
1 × $6.00 -
×
 Essentials in Quantitative Trading QT01 By HangukQuant's
1 × $23.00
Essentials in Quantitative Trading QT01 By HangukQuant's
1 × $23.00 -
×
 The Crypto Code with Joel Peterson - Adam Short
1 × $15.00
The Crypto Code with Joel Peterson - Adam Short
1 × $15.00 -
×
 How to Make the Stock Market Make Money For You with Ted Warren
1 × $6.00
How to Make the Stock Market Make Money For You with Ted Warren
1 × $6.00 -
×
 Practical Applications of Candlestick Charts with Gary Wagner
1 × $6.00
Practical Applications of Candlestick Charts with Gary Wagner
1 × $6.00 -
×
 Trading The E-Minis for a Living with Don Miller
1 × $6.00
Trading The E-Minis for a Living with Don Miller
1 × $6.00 -
×
 Traders Winning Edge (Presentation) with Adrienne Laris Toghraie
1 × $6.00
Traders Winning Edge (Presentation) with Adrienne Laris Toghraie
1 × $6.00 -
×
 LEAPS Trading Strategies- Powerful Techniques for Options Trading Success - Marty Kearney
1 × $6.00
LEAPS Trading Strategies- Powerful Techniques for Options Trading Success - Marty Kearney
1 × $6.00 -
×
 Pattern Recognition: A Fundamental Introduction to Japanese Candlestick Charting Techniques Class with Jeff Bierman
1 × $6.00
Pattern Recognition: A Fundamental Introduction to Japanese Candlestick Charting Techniques Class with Jeff Bierman
1 × $6.00 -
×
 Currency Strategy with Callum Henderson
1 × $6.00
Currency Strategy with Callum Henderson
1 × $6.00 -
×
 Home Run Options Trading Course with Dave Aquino - Base Camp Trading
1 × $11.00
Home Run Options Trading Course with Dave Aquino - Base Camp Trading
1 × $11.00 -
×
 CFA Level 3- Examination Morning Session – Essay (2004)
1 × $6.00
CFA Level 3- Examination Morning Session – Essay (2004)
1 × $6.00 -
×
 Defending Options with Simpler Options
1 × $6.00
Defending Options with Simpler Options
1 × $6.00 -
×
 Advanced Trading Strategies with Larry Connors
1 × $6.00
Advanced Trading Strategies with Larry Connors
1 × $6.00 -
×
 The Sweep Show with Scott Pulcini Trader
1 × $23.00
The Sweep Show with Scott Pulcini Trader
1 × $23.00 -
×
 How to Buy Stocks Before They Skyrocket
1 × $6.00
How to Buy Stocks Before They Skyrocket
1 × $6.00 -
×
 Crash Course Special Edition Set with Chris Martenson
1 × $6.00
Crash Course Special Edition Set with Chris Martenson
1 × $6.00 -
×
 Trade What You See How To Profit from Pattern Recognition with Larry Pesavento & Leslie Jouflas
1 × $6.00
Trade What You See How To Profit from Pattern Recognition with Larry Pesavento & Leslie Jouflas
1 × $6.00 -
×
 E75 Forex System with James de Wet
1 × $6.00
E75 Forex System with James de Wet
1 × $6.00 -
×
 Slapped by the Invisible Hand: The Panic of 2007 with Gary Gorton
1 × $6.00
Slapped by the Invisible Hand: The Panic of 2007 with Gary Gorton
1 × $6.00 -
×
 Price Analysis Webinar with Carolyn Boroden
1 × $6.00
Price Analysis Webinar with Carolyn Boroden
1 × $6.00 -
×
 Researching your Trade
1 × $6.00
Researching your Trade
1 × $6.00 -
×
 Swift Trader, Perfecting the Art of DayTrading with Charles Kim
1 × $6.00
Swift Trader, Perfecting the Art of DayTrading with Charles Kim
1 × $6.00 -
×
 Daytrade (Italian) with Guiuseppe Migliorino
1 × $6.00
Daytrade (Italian) with Guiuseppe Migliorino
1 × $6.00 -
×
 Core Strategy Program + Extended Learning Track with Ota Courses
1 × $124.00
Core Strategy Program + Extended Learning Track with Ota Courses
1 × $124.00 -
×
 Order flow self-study training program with iMFtracker
1 × $10.00
Order flow self-study training program with iMFtracker
1 × $10.00 -
×
 Master Commodities Course
1 × $6.00
Master Commodities Course
1 × $6.00 -
×
 Options, Futures & Other Derivatives (5th Ed.)
1 × $6.00
Options, Futures & Other Derivatives (5th Ed.)
1 × $6.00 -
×
 Simpler Options - Insider’s Guide to Generating Income using Options Strategies Course (Oct 2014)
1 × $6.00
Simpler Options - Insider’s Guide to Generating Income using Options Strategies Course (Oct 2014)
1 × $6.00 -
×
 Trading Masterclass POTM + PFTM + PTMI with Anton Kreil
1 × $6.00
Trading Masterclass POTM + PFTM + PTMI with Anton Kreil
1 × $6.00 -
×
 Options Trading & Ultimate MasterClass With Tyrone Abela - FX Evolution
1 × $54.00
Options Trading & Ultimate MasterClass With Tyrone Abela - FX Evolution
1 × $54.00 -
×
 Confidence Game. How a Hadge Fund Manager Called Wall Street’s Bluff with Christine Richard
1 × $6.00
Confidence Game. How a Hadge Fund Manager Called Wall Street’s Bluff with Christine Richard
1 × $6.00 -
×
 Day One Trader with John Sussex
1 × $6.00
Day One Trader with John Sussex
1 × $6.00 -
×
 Planetary Stock Trading with Bill Meridian
1 × $6.00
Planetary Stock Trading with Bill Meridian
1 × $6.00 -
×
 Trading Psychology, Day-trading & Swing Trading with Alexander Elder
1 × $31.00
Trading Psychology, Day-trading & Swing Trading with Alexander Elder
1 × $31.00 -
×
 Bond Market Course with The Macro Compass
1 × $15.00
Bond Market Course with The Macro Compass
1 × $15.00

Practical Introduction to Bollinger Bands 2013
$6.00
File Size: Coming soon!
Delivery Time: 1–12 hours
Media Type: Online Course
Practical Introduction to Bollinger Bands 2013
Understanding Bollinger Bands
What Are Bollinger Bands?
Bollinger Bands are a popular technical analysis tool developed by John Bollinger in the 1980s. They consist of a middle band, which is a simple moving average, and two outer bands that are standard deviations away from the middle band. These bands help traders understand volatility and identify potential buy and sell signals.
Importance in Technical Analysis
Bollinger Bands are essential for traders because they provide a visual representation of price volatility and potential market reversals. They can be applied to various asset classes, including stocks, commodities, and currencies.
Components of Bollinger Bands
The Middle Band
The middle band is typically a 20-day simple moving average (SMA). This average smooths out price data, providing a central value around which the upper and lower bands are calculated.
The Upper and Lower Bands
The upper and lower bands are usually set two standard deviations away from the middle band. These bands expand and contract based on market volatility, offering insights into price movements.
Standard Deviation
Standard deviation measures the dispersion of data from its mean. In Bollinger Bands, it helps determine the distance between the upper and lower bands and the middle band.
Calculating Bollinger Bands
Step-by-Step Calculation
- Calculate the 20-day SMA: Add the closing prices of the past 20 days and divide by 20.
- Determine the standard deviation: Calculate the standard deviation of the same 20-day period.
- Upper Band: Middle Band + (2 * Standard Deviation)
- Lower Band: Middle Band – (2 * Standard Deviation)
Example Calculation
If the 20-day SMA is $100 and the standard deviation is $5, the upper band would be $110 ($100 + (2 * $5)) and the lower band would be $90 ($100 – (2 * $5)).
Using Bollinger Bands in Trading
Identifying Trends
Bollinger Bands can help identify the direction of a trend. When the price consistently touches the upper band, it indicates an uptrend. Conversely, touching the lower band suggests a downtrend.
Overbought and Oversold Conditions
When the price moves near the upper band, the asset might be overbought, signaling a potential sell. If the price approaches the lower band, it might be oversold, indicating a potential buy.
Breakouts and Volatility
Bollinger Bands can also signal breakouts. When the bands squeeze together, it indicates low volatility and a potential breakout. A sudden widening of the bands suggests increased volatility and potential trading opportunities.
Practical Applications
Trading Strategies
Bollinger Bounce
This strategy is based on the idea that the price will revert to the mean. When the price touches the upper band, traders might consider selling. Conversely, touching the lower band might be a buy signal.
Bollinger Squeeze
The Bollinger Squeeze strategy focuses on periods of low volatility. When the bands narrow, it suggests that a breakout is imminent. Traders can prepare to enter positions in the direction of the breakout.
Combining with Other Indicators
Bollinger Bands can be combined with other technical indicators like the Relative Strength Index (RSI) or Moving Average Convergence Divergence (MACD) to enhance trading decisions.
Advantages of Bollinger Bands
Visual Clarity
Bollinger Bands provide a clear visual representation of price volatility, making it easier for traders to identify potential buy and sell signals.
Flexibility
They can be used in various markets and on different time frames, making them versatile tools for traders of all styles.
Reliability
When used correctly, Bollinger Bands can be reliable indicators of market trends and potential reversals.
Limitations of Bollinger Bands
Not a Standalone Indicator
Bollinger Bands should not be used in isolation. They are most effective when combined with other technical analysis tools.
False Signals
Like all technical indicators, Bollinger Bands can produce false signals. Traders should use them with caution and confirm signals with additional analysis.
Tips for Using Bollinger Bands
Customize Settings
Traders can adjust the period and standard deviation settings of Bollinger Bands to suit their trading style and the specific asset being traded.
Monitor Market Conditions
Regularly review market conditions and adjust your trading strategy accordingly. Bollinger Bands are more effective in certain market environments.
Practice and Patience
Successful trading with Bollinger Bands requires practice and patience. Use a demo account to test strategies before applying them to live trading.
Conclusion
Bollinger Bands are a powerful tool for traders, offering insights into market volatility and potential trading opportunities. By understanding their components, calculations, and applications, traders can effectively incorporate Bollinger Bands into their trading strategies to improve their decision-making and profitability.
FAQs
What are Bollinger Bands used for?
Bollinger Bands are used to measure market volatility and identify potential buy and sell signals based on price movements relative to the bands.
How do you calculate Bollinger Bands?
Bollinger Bands are calculated using a 20-day simple moving average and adding/subtracting two standard deviations to create the upper and lower bands.
Can Bollinger Bands be used for day trading?
Yes, Bollinger Bands can be used for day trading, as well as swing trading and long-term investing, due to their flexibility in different time frames.
What is the Bollinger Squeeze?
The Bollinger Squeeze occurs when the bands narrow, indicating low volatility and a potential breakout. It suggests that traders should prepare for a possible significant price move.
Should Bollinger Bands be used with other indicators?
Yes, Bollinger Bands are most effective when used in conjunction with other technical indicators, such as RSI or MACD, to confirm signals and enhance trading decisions.
Be the first to review “Practical Introduction to Bollinger Bands 2013”
You must be logged in to post a review.
Related products

Original price was: $139.00.$23.00Current price is: $23.00.

Forex Trading
Original price was: $249.00.$15.00Current price is: $15.00.

Forex Trading
Original price was: $239.00.$8.00Current price is: $8.00.

Original price was: $895.00.$15.00Current price is: $15.00.

Forex Trading
Original price was: $550.00.$5.00Current price is: $5.00.

Original price was: $497.00.$31.00Current price is: $31.00.

Forex Trading
Original price was: $1,098.00.$39.00Current price is: $39.00.

Original price was: $2,120.00.$15.00Current price is: $15.00.

Forex Trading
Original price was: $125.00.$17.00Current price is: $17.00.

Original price was: $1,200.00.$23.00Current price is: $23.00.

Original price was: $997.00.$13.00Current price is: $13.00.

Forex Trading
Quantamentals – The Next Great Forefront Of Trading and Investing with Trading Markets
Original price was: $1,495.00.$8.00Current price is: $8.00.

Forex Trading
Original price was: $397.00.$31.00Current price is: $31.00.

Original price was: $799.00.$15.00Current price is: $15.00.

Original price was: $299.00.$8.00Current price is: $8.00.

Forex Trading
Original price was: $2,000.00.$23.00Current price is: $23.00.

Original price was: $700.00.$39.00Current price is: $39.00.

Original price was: $310.00.$23.00Current price is: $23.00.

Original price was: $999.00.$5.00Current price is: $5.00.
Original price was: $1,800.00.$54.00Current price is: $54.00.

Reviews
There are no reviews yet.